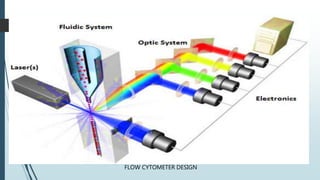
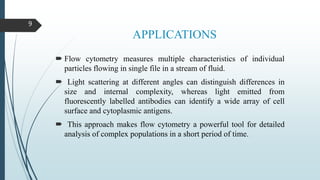
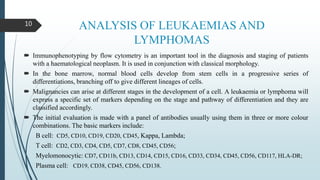
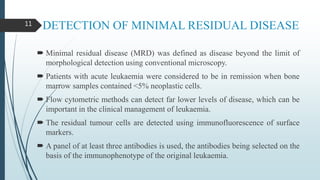
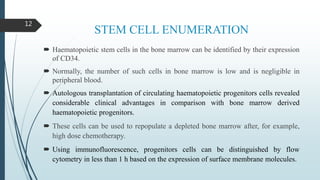
Flow cytometry is a technique that uses lasers to measure physical and chemical properties of cells as they flow in a fluid stream. A flow cytometer consists of three main systems: fluidics to transport cells to the laser, optics including lasers and detectors, and electronics to convert light signals to electronic data. Cells passing through the laser beam scatter and fluoresce light which is detected and used to measure properties like size, granularity, and presence of fluorescent markers. Flow cytometry has many applications in diagnostics including immunophenotyping of leukemias and lymphomas, detecting minimal residual disease, stem cell enumeration, and detecting autoantibodies.
FLOW CYTOMETRY, PRINCIPLE, APPLICATION, USE IN HAEMATOLOGY, COMPONENT OF FLOW CYTOMETRY, DATA INTERPRETATION, DATA ANALYSIS, CELL SHORTING ADVANTAGES AND DISADVANTAGES, IMMUNOLOGICAL CLASSIFICATION OF ACUTE
LEUKEMIA
This slide show forms part of the Introduction to Flow Cytometry seminar help by The Garvan MLC Flow Cytometry Facility. The Garvan MLC Flow Cytometry Facility is part of the Garvan Institute of Medical Research and is located in Sydney NSW.
It is a laser based technology that measures and analyses different physical and chemical properties of the cells/particles flowing in a stream of fluid through a beam of light
This method is used to visualise the localisation and quantity of a protein of interest. The target protein is bound to by a specific primary antibody, which in turn is detected by a secondary antibody conjugated to a fluorophore. A fluorescent or confocal microscope is used to visualise the protein.
Immunocytochemistry (ICC) differs from immunohistochemistry (IHC) in that the former is performed on samples of intact cells that have had most, if not all, of their surrounding extracellular matrix removed. In contrast, immunohistochemical samples are sections of biological tissue, where each cell is surrounded by tissue architecture and other cells normally found in the intact tissue. These differences cause the samples to be prepared differently. For ICC, the sample requires permeabilisation so that the antibodies can reach the intracellular targets. Depending on the thickness of the sample, IHC samples do not require this.
Do you have a technical question? Get in touch: info@stjohnslabs.com
Creative Bioarray introduces the tissue array technology and the procedure of making TMAs. Pre-made tissue array and custom tissue array are both provided. In addition, related services are also available.
Fluorescence- Activated Cell Sorter is a powerful technique used in cell sorting, cell-cycle analysis etc.
The presentation gives a basic understanding of the principle of FACS, instrumentation, interpretation of results, applications, how to do cell-cycle analysis using FACS and various troubleshooting tips.
Flow cytometry is a laser-based technique to count and analysis the size, shape and properties of individual cells within a heterogeneous population of cells.
Introduction, the principle of immunofluorescence, Technique, Fluorescent microscope and its components, Application and types of immunofluorescence, Direct and indirect immunofluorescence, FACS (Fluorescence-activated cell sorting), Uses and limitations of Immunofluorescence
a brief introduction to countercurrent chromatography with its principle. working and modes of operation along with little bit of history, the types of CCC and its applications
Anti ulcer drugs and their Advance pharmacology ||
Anti-ulcer drugs are medications used to prevent and treat ulcers in the stomach and upper part of the small intestine (duodenal ulcers). These ulcers are often caused by an imbalance between stomach acid and the mucosal lining, which protects the stomach lining.
||Scope: Overview of various classes of anti-ulcer drugs, their mechanisms of action, indications, side effects, and clinical considerations.
Title: Sense of Smell
Presenter: Dr. Faiza, Assistant Professor of Physiology
Qualifications:
MBBS (Best Graduate, AIMC Lahore)
FCPS Physiology
ICMT, CHPE, DHPE (STMU)
MPH (GC University, Faisalabad)
MBA (Virtual University of Pakistan)
Learning Objectives:
Describe the primary categories of smells and the concept of odor blindness.
Explain the structure and location of the olfactory membrane and mucosa, including the types and roles of cells involved in olfaction.
Describe the pathway and mechanisms of olfactory signal transmission from the olfactory receptors to the brain.
Illustrate the biochemical cascade triggered by odorant binding to olfactory receptors, including the role of G-proteins and second messengers in generating an action potential.
Identify different types of olfactory disorders such as anosmia, hyposmia, hyperosmia, and dysosmia, including their potential causes.
Key Topics:
Olfactory Genes:
3% of the human genome accounts for olfactory genes.
400 genes for odorant receptors.
Olfactory Membrane:
Located in the superior part of the nasal cavity.
Medially: Folds downward along the superior septum.
Laterally: Folds over the superior turbinate and upper surface of the middle turbinate.
Total surface area: 5-10 square centimeters.
Olfactory Mucosa:
Olfactory Cells: Bipolar nerve cells derived from the CNS (100 million), with 4-25 olfactory cilia per cell.
Sustentacular Cells: Produce mucus and maintain ionic and molecular environment.
Basal Cells: Replace worn-out olfactory cells with an average lifespan of 1-2 months.
Bowman’s Gland: Secretes mucus.
Stimulation of Olfactory Cells:
Odorant dissolves in mucus and attaches to receptors on olfactory cilia.
Involves a cascade effect through G-proteins and second messengers, leading to depolarization and action potential generation in the olfactory nerve.
Quality of a Good Odorant:
Small (3-20 Carbon atoms), volatile, water-soluble, and lipid-soluble.
Facilitated by odorant-binding proteins in mucus.
Membrane Potential and Action Potential:
Resting membrane potential: -55mV.
Action potential frequency in the olfactory nerve increases with odorant strength.
Adaptation Towards the Sense of Smell:
Rapid adaptation within the first second, with further slow adaptation.
Psychological adaptation greater than receptor adaptation, involving feedback inhibition from the central nervous system.
Primary Sensations of Smell:
Camphoraceous, Musky, Floral, Pepperminty, Ethereal, Pungent, Putrid.
Odor Detection Threshold:
Examples: Hydrogen sulfide (0.0005 ppm), Methyl-mercaptan (0.002 ppm).
Some toxic substances are odorless at lethal concentrations.
Characteristics of Smell:
Odor blindness for single substances due to lack of appropriate receptor protein.
Behavioral and emotional influences of smell.
Transmission of Olfactory Signals:
From olfactory cells to glomeruli in the olfactory bulb, involving lateral inhibition.
Primitive, less old, and new olfactory systems with different path
TEST BANK for Operations Management, 14th Edition by William J. Stevenson, Ve...kevinkariuki227
TEST BANK for Operations Management, 14th Edition by William J. Stevenson, Verified Chapters 1 - 19, Complete Newest Version.pdf
Title: Sense of Taste
Presenter: Dr. Faiza, Assistant Professor of Physiology
Qualifications:
MBBS (Best Graduate, AIMC Lahore)
FCPS Physiology
ICMT, CHPE, DHPE (STMU)
MPH (GC University, Faisalabad)
MBA (Virtual University of Pakistan)
Learning Objectives:
Describe the structure and function of taste buds.
Describe the relationship between the taste threshold and taste index of common substances.
Explain the chemical basis and signal transduction of taste perception for each type of primary taste sensation.
Recognize different abnormalities of taste perception and their causes.
Key Topics:
Significance of Taste Sensation:
Differentiation between pleasant and harmful food
Influence on behavior
Selection of food based on metabolic needs
Receptors of Taste:
Taste buds on the tongue
Influence of sense of smell, texture of food, and pain stimulation (e.g., by pepper)
Primary and Secondary Taste Sensations:
Primary taste sensations: Sweet, Sour, Salty, Bitter, Umami
Chemical basis and signal transduction mechanisms for each taste
Taste Threshold and Index:
Taste threshold values for Sweet (sucrose), Salty (NaCl), Sour (HCl), and Bitter (Quinine)
Taste index relationship: Inversely proportional to taste threshold
Taste Blindness:
Inability to taste certain substances, particularly thiourea compounds
Example: Phenylthiocarbamide
Structure and Function of Taste Buds:
Composition: Epithelial cells, Sustentacular/Supporting cells, Taste cells, Basal cells
Features: Taste pores, Taste hairs/microvilli, and Taste nerve fibers
Location of Taste Buds:
Found in papillae of the tongue (Fungiform, Circumvallate, Foliate)
Also present on the palate, tonsillar pillars, epiglottis, and proximal esophagus
Mechanism of Taste Stimulation:
Interaction of taste substances with receptors on microvilli
Signal transduction pathways for Umami, Sweet, Bitter, Sour, and Salty tastes
Taste Sensitivity and Adaptation:
Decrease in sensitivity with age
Rapid adaptation of taste sensation
Role of Saliva in Taste:
Dissolution of tastants to reach receptors
Washing away the stimulus
Taste Preferences and Aversions:
Mechanisms behind taste preference and aversion
Influence of receptors and neural pathways
Impact of Sensory Nerve Damage:
Degeneration of taste buds if the sensory nerve fiber is cut
Abnormalities of Taste Detection:
Conditions: Ageusia, Hypogeusia, Dysgeusia (parageusia)
Causes: Nerve damage, neurological disorders, infections, poor oral hygiene, adverse drug effects, deficiencies, aging, tobacco use, altered neurotransmitter levels
Neurotransmitters and Taste Threshold:
Effects of serotonin (5-HT) and norepinephrine (NE) on taste sensitivity
Supertasters:
25% of the population with heightened sensitivity to taste, especially bitterness
Increased number of fungiform papillae
These lecture slides, by Dr Sidra Arshad, offer a quick overview of physiological basis of a normal electrocardiogram.
Learning objectives:
1. Define an electrocardiogram (ECG) and electrocardiography
2. Describe how dipoles generated by the heart produce the waveforms of the ECG
3. Describe the components of a normal electrocardiogram of a typical bipolar leads (limb II)
4. Differentiate between intervals and segments
5. Enlist some common indications for obtaining an ECG
Study Resources:
1. Chapter 11, Guyton and Hall Textbook of Medical Physiology, 14th edition
2. Chapter 9, Human Physiology - From Cells to Systems, Lauralee Sherwood, 9th edition
3. Chapter 29, Ganong’s Review of Medical Physiology, 26th edition
4. Electrocardiogram, StatPearls - https://www.ncbi.nlm.nih.gov/books/NBK549803/
5. ECG in Medical Practice by ABM Abdullah, 4th edition
6. ECG Basics, http://www.nataliescasebook.com/tag/e-c-g-basics
Pulmonary Thromboembolism - etilogy, types, medical- Surgical and nursing man...VarunMahajani
Disruption of blood supply to lung alveoli due to blockage of one or more pulmonary blood vessels is called as Pulmonary thromboembolism. In this presentation we will discuss its causes, types and its management in depth.
Explore natural remedies for syphilis treatment in Singapore. Discover alternative therapies, herbal remedies, and lifestyle changes that may complement conventional treatments. Learn about holistic approaches to managing syphilis symptoms and supporting overall health.
micro teaching on communication m.sc nursing.pdfAnurag Sharma
Microteaching is a unique model of practice teaching. It is a viable instrument for the. desired change in the teaching behavior or the behavior potential which, in specified types of real. classroom situations, tends to facilitate the achievement of specified types of objectives.
MANAGEMENT OF ATRIOVENTRICULAR CONDUCTION BLOCK.pdfJim Jacob Roy
Cardiac conduction defects can occur due to various causes.
Atrioventricular conduction blocks ( AV blocks ) are classified into 3 types.
This document describes the acute management of AV block.
Ozempic: Preoperative Management of Patients on GLP-1 Receptor Agonists Saeid Safari
Preoperative Management of Patients on GLP-1 Receptor Agonists like Ozempic and Semiglutide
ASA GUIDELINE
NYSORA Guideline
2 Case Reports of Gastric Ultrasound
HOT NEW PRODUCT! BIG SALES FAST SHIPPING NOW FROM CHINA!! EU KU DB BK substit...GL Anaacs
Contact us if you are interested:
Email / Skype : kefaya1771@gmail.com
Threema: PXHY5PDH
New BATCH Ku !!! MUCH IN DEMAND FAST SALE EVERY BATCH HAPPY GOOD EFFECT BIG BATCH !
Contact me on Threema or skype to start big business!!
Hot-sale products:
NEW HOT EUTYLONE WHITE CRYSTAL!!
5cl-adba precursor (semi finished )
5cl-adba raw materials
ADBB precursor (semi finished )
ADBB raw materials
APVP powder
5fadb/4f-adb
Jwh018 / Jwh210
Eutylone crystal
Protonitazene (hydrochloride) CAS: 119276-01-6
Flubrotizolam CAS: 57801-95-3
Metonitazene CAS: 14680-51-4
Payment terms: Western Union,MoneyGram,Bitcoin or USDT.
Deliver Time: Usually 7-15days
Shipping method: FedEx, TNT, DHL,UPS etc.Our deliveries are 100% safe, fast, reliable and discreet.
Samples will be sent for your evaluation!If you are interested in, please contact me, let's talk details.
We specializes in exporting high quality Research chemical, medical intermediate, Pharmaceutical chemicals and so on. Products are exported to USA, Canada, France, Korea, Japan,Russia, Southeast Asia and other countries.
2. INTRODUCTION
‘Flow Cytometry’ as the name suggests is a technique for cell counting and
measurement of different properties of the cell (‘cyto’= cell;
‘metry’=count/measurement).
It is a laser based technology that measures and analyses different physical
and chemical properties of the cells/particles flowing in a stream of fluid
through a beam of light.
An optical-to-electronic coupling system is used to record the way in
which the particle emits fluorescence and scatters incident light from the
laser.
2
3. COMPONENTS OF A FLOW CYTOMETER
A flow cytometer is made up of three main systems: fluidics, optics, and
electronics.
The fluidics system transports particles in a stream to the laser beam for
interrogation.
The optics system consists of lasers to illuminate the particles in the sample
stream and optical filters to direct the resulting light signals to the appropriate
detectors.
The electronics system converts the detected light signals into electronic
signals that can be processed by the computer. For some instruments equipped
with a sorting feature, the electronics system is also capable of initiating sorting
decisions to charge and deflect particles.
3
4. WORKING OF A FLOW CYTOMETER
In the flow cytometer, particles are carried to the laser intercept in a fluid stream. Any
suspended particle or cell from 0.2–150 micrometres in size is suitable for analysis.
The portion of the fluid stream where particles are located is called the sample core.
When particles pass through the laser intercept, they scatter laser light. Any fluorescent
molecules present on the particle fluoresce.
The scattered and fluorescent light is collected by appropriately positioned lenses.
A combination of beam splitters and filters steers the scattered and fluorescent light to the
appropriate detectors.
The detectors produce electronic signals proportional to the optical signals striking them.
4
6. CONCEPT OF SCATTERING
Physical properties, such as size (represented by forward angle light scatter) and internal
complexity (represented by right-angle scatter) can resolve certain cell populations.
FSC collects light at 180° from the point at which the laser beam intersects the cells, usually
on a linear scale. It is correlated with cell size, and thus can distinguish normal lymphocytes
(small), monocytes (intermediate), and neoplastic cells (generally they are large in size).
SSC collects right-angle light at 90° and is correlated with cytoplasmic granularity and
nuclear configuration.
The combination of both FSC and SSC can distinguish normal lymphocytes, granulocytes,
and monocytes.
The detection of lymphocytes and monocytes provides a reliable internal control to evaluate
the size of the cells of interest.
6
7. FLOW CYTOMETRY ANALYSIS
ANTIBODY
Highly specific monoclonal antibodies are used that are produced by cloned antibody secreting
cells.
Antibodies are based on cluster of differentiation (CD)- a protocol used for identification and
distinction of cell surface antigens.
Using CD system we can identify cells by the presence or absence of particular surface
markers for e.g. CD3+ or CD20+ etc.
Antibodies conjugated to fluorescent dyes can bind specific proteins on cell membranes or
inside cells.
When labelled cells are passed by a light source, the fluorescent molecules are excited to a
higher energy state. Upon returning to their resting states, the fluorochromes emit light energy
at higher wavelengths.
The use of multiple fluorochromes, each with similar excitation wavelengths and different
emission wavelengths (or “colours”), allows several cell properties to be measured
simultaneously.
7
8. 8
FLUOROCHROMES
Fluorochromes are substances that can be excited by certain light source (such as laser) and emit
a fluorescent signal at a single wavelength.
Fluorescent dyes can directly bind to certain cellular content, such as DNA and RNA, and allow
us to perform quantitative analysis on individual cells.
However, in most cases fluorochromes are conjugated with monoclonal antibodies, which
specifically target cellular antigens/markers.
E.g.-Fluorescein isothiocyanate (FITC), Phycoerythrin (PE), PE-Texas Red, Peridininchlorophyl
protein(PerCP).
Interestingly, although some of them can be excited by the same light source, the different
fluorochromes may emit fluorescent signals with different wavelengths/colours. Thus, multiple
fluorochromes can be simultaneously excited by a light source and detected by their emission
fluorescent signals with different wavelengths, respectively.
9. APPLICATIONS
Flow cytometry measures multiple characteristics of individual
particles flowing in single file in a stream of fluid.
Light scattering at different angles can distinguish differences in
size and internal complexity, whereas light emitted from
fluorescently labelled antibodies can identify a wide array of cell
surface and cytoplasmic antigens.
This approach makes flow cytometry a powerful tool for detailed
analysis of complex populations in a short period of time.
9
10. ANALYSIS OF LEUKAEMIAS AND
LYMPHOMAS
Immunophenotyping by flow cytometry is an important tool in the diagnosis and staging of patients
with a haematological neoplasm. It is used in conjunction with classical morphology.
In the bone marrow, normal blood cells develop from stem cells in a progressive series of
differentiations, branching off to give different lineages of cells.
Malignancies can arise at different stages in the development of a cell. A leukaemia or lymphoma will
express a specific set of markers depending on the stage and pathway of differentiation and they are
classified accordingly.
The initial evaluation is made with a panel of antibodies usually using them in three or more colour
combinations. The basic markers include:
B cell: CD5, CD10, CD19, CD20, CD45, Kappa, Lambda;
T cell: CD2, CD3, CD4, CD5, CD7, CD8, CD45, CD56;
Myelomonocytic: CD7, CD11b, CD13, CD14, CD15, CD16, CD33, CD34, CD45, CD56, CD117, HLA-DR;
Plasma cell: CD19, CD38, CD45, CD56, CD138.
10
11. DETECTION OF MINIMAL RESIDUAL DISEASE
Minimal residual disease (MRD) was defined as disease beyond the limit of
morphological detection using conventional microscopy.
Patients with acute leukaemia were considered to be in remission when bone
marrow samples contained <5% neoplastic cells.
Flow cytometric methods can detect far lower levels of disease, which can be
important in the clinical management of leukaemia.
The residual tumour cells are detected using immunofluorescence of surface
markers.
A panel of at least three antibodies is used, the antibodies being selected on the
basis of the immunophenotype of the original leukaemia.
11
12. STEM CELL ENUMERATION
Haematopoietic stem cells in the bone marrow can be identified by their expression
of CD34.
Normally, the number of such cells in bone marrow is low and is negligible in
peripheral blood.
Autologous transplantation of circulating haematopoietic progenitors cells revealed
considerable clinical advantages in comparison with bone marrow derived
haematopoietic progenitors.
These cells can be used to repopulate a depleted bone marrow after, for example,
high dose chemotherapy.
Using immunofluorescence, progenitors cells can be distinguished by flow
cytometry in less than 1 h based on the expression of surface membrane molecules.
12
13. SOLID ORGAN TRANSPLANTATION
T cell cross-match
Flow cytometry can be used to crossmatch a
recipient's serum with donor lymphocytes to
detect antibodies that could interfere with
engraftment.
Prior to organ transplantation, the organ
donor's lymphocytes are incubated with
serum from the potential recipient of the graft.
After washing, bound immunoglobulins are
detected using an FITC-conjugated anti-
human IgG antibody. The T cells are
identified using a PE-CD3 conjugate.
Post-operative monitoring
After the organ transplant, analysis of the
peripheral blood lymphocytes may help to
indicate early rejection and bone marrow
toxicity during immunosuppressive therapies,
and to help in the differentiation of infections
from transplant rejection.
A variety of cell surface markers and
activation antigens can be used depending on
the clinical condition and the organ
transplanted.
13
14. DETECTION OF AUTOANTIBODIES
Autoantibodies to leucocytes, platelets and erythrocytes may be found in a
variety of autoimmune conditions and can cause anaemia, leukopenia, or
thrombocytopenia.
They are detected by immunofluorescence in either a direct or an indirect
assay.
In the former, anti-human Ig are used to detect Ig on the surface of the
patient’s cells.
In the indirect assay, the reaction of antibodies in the patient’s serum with
cells from a normal person is observed.
The procedures are similar to those used for a T cell crossmatch.
14
15. HIV INFECTION
Determination of the numbers of CD4 +ve lymphocytes in the peripheral
blood is used to monitor patients with HIV infections.
The percentage of CD4 +ve cells can be obtained in a single tube by
staining for CD45/CD3/CD4.
A cytogram of SS versus CD45 is used to identify the lymphocytes and a
cytogram of CD4 versus CD3 to enumerate the CD4+ve T cells.
An extended panel is used to obtain a more complete picture of the
peripheral blood lymphocytes.
The absolute number of CD4 +ve cells is the clinically relevant parameter
for a discussion on counting cells.
15
16. FOETO-MATERNAL HAEMORRHAGE
Foeto-maternal bleeding can sensitise a Rhesus blood group D-ve mother to D+ve blood
cells from the foetus.
In a subsequent pregnancy, haemolytic disease of the new born child can be caused by the
destruction of Rhesus D +ve blood cells of the foetus by maternal anti-D antibodies.
Prophylactic anti-D given to the Rhesus D -ve mother shortly after delivery of a Rhesus D
+ve child significantly reduces the incidence of anti-D sensitisation in the mother and has
led to the virtual elimination of the disease from mothers so treated.
Since the dose of anti-D given is related to the size of the foeto-maternal haemorrhage,
quantitation of foetal-maternal haemorrhage is therefore important.
Quantitation is achieved by labelling the erythrocytes in a sample of maternal blood with
FITC-conjugated, non-agglutinating anti-D antibodies.
A population of as few as 0.1% foetal cells is sufficient to sensitise the parent so at least
500,000 cells should be analysed to obtain a statistically significant estimation.
16
17. IMMUNODEFICIENCY DISEASES
Diseases resulting from primary immunodeficiencies, which are usually found in infants and
young children, can be a result of defects in T-cells, B-cells, granulocytes or monocytes.
1. X-linked agammaglobulinemia-
Decreased serum immunoglobulins of all isotypes and decreased to absent peripheral B cells.
As B cells are significantly reduced or absent in XLA, flow analysis focuses on monocytes
and/or platelets.
2. LRBA deficiency(lipopolysaccharide-responsive beige-like anchor)-
Reduced immunoglobulins affecting at least two isotypes, manifest with recurrent infections,
severe pulmonary and gastrointestinal complications.
Caused by LRBA gene mutations, assessment of LRBA protein T cells, B cells, monocytes, and
NK cells provides a rapid and easy way of determining LRBA deficiency.
17
18. 18
3. X-linked hyper-IgM syndrome-
Severely impaired production of class-switched immunoglobulins with normal or elevated levels
of IgM due to impaired class switch recombination.
Caused by mutations in the CD40LG gene, encoding the CD40 ligand protein, a member of the
tumour necrosis factor (TNF) family, expressed on activated CD4+ T cells.
Flow cytometric analysis is performed to examine expression of CD40 ligand protein.
4. DOCK8 deficiency (dedicator of cytokinesis 8)-
Significant eosinophilia, elevated serum IgE levels, reduced T and B cells, decreased serum IgM
levels, variably impaired IgG functional antibody responses with reduced in vitro proliferation of
activated CD8+ T cells.
The flow cytometric assay for DOCK8 is able to identify all patients with a germ line genetic
mutation in DOCK8, making it a reliable and quick diagnostic test.
Genetic testing is complicated by the large size of the gene.
19. PAROXYSMAL NOCTURNAL HAEMOGLOBINURIA
Paroxysmal nocturnal haemoglobinuria (PNH) is an acquired disease characterised
by the development of an abnormal clone of precursor cells in the bone marrow.
The white cells and red cells produced are dysfunctional and are susceptible to
lysis.
Conventional laboratory tests for the diagnosis of PNH include the sugar water test
and the Ham’s acid haemolysis test. Problems associated with these tests include
stringent specimen requirements and limited specificity.
Analysis of this clonal abnormality by flow cytometry, in general, can be
accomplished by analysis of CD55 and CD59 on red cells specific for decay-
accelerating factor and membrane-inhibitor of reactive lysis, respectively.
19
20. CONTAMINATING LEUKOCYTES
The presence of contaminating leukocytes in transfused products of blood
may cause a number of adverse effects. These include:
Non-haemolytic febrile reactions
Graft-versus-host disease
Cytomegalovirus transmission
Pulmonary oedema
Alloimmunization to HLA class I antigens
Flow cytometry offers a sensitive measure of the number of remaining
leucocytes in leucofiltered products, such as plasma and red blood cells.
20
21. PLATELET COUNTING AND FUNCTION21
Flow cytometry can be used to count platelets and also to measure their surface proteins.
The surface protein change during activation of the platelets can be used to measure their activation
state.
Platelets are easily activated and blood has to be taken and handled with care; for this reason, whole
blood methods are generally preferred.
Platelet analysis using thiazol orange by flow cytometry can have application in
Identification of inherited disorders
Monitoring of anti-platelet therapy
Monitoring clinical course of disease
Monitoring platelet production in thrombocytopenia
Identification of patients at risk of thrombosis
Accurate platelet counting in thrombocytopenia
Diagnosis of heparin induced thrombocytopenia
22. THE BASOPHIL ACTIVATION TEST
Flow cytometry can be a reliable tool for monitoring basophil activation
upon allergen challenge by detecting surface expression of
degranulation/activation markers (CD63 or CD203c).
The basophil activation test has become a standardized tool for in
vitro diagnosis of immediate allergy.
It is also suitable for pharmacological studies on non-purified human
basophils.
22
23. DNAANALYSIS
Dyes are available such as propidium iodide that bind DNA in a proportional and linear
fashion.
This allows the quantitation of DNA content, enabling the identification of normal diploid cells
at rest, those that are actively synthesizing DNA, and those that are either pre-mitotic or
actually in mitosis.
Once these phases of the cell cycle have been identified, antibody detection of cell cycle-related
proteins can be combined with DNA content determination to relate protein expression with
stages of the cell cycle.
APOPTOSIS DETECTION
Apoptotic cells have many characteristics that can be measured by flow cytometry like cell
plasma membrane changes, changes in plasma membrane permeability, changes in
mitochondrial membrane permeability, caspase activation, and DNA cleavage.
Determination of any one or a combination of these changes by flow cytometry allows the
identification and quantification of apoptotic cells in a mixed population.
It can also give valuable information about the molecular pathways that cells take during cell
death.
23
24. ADVANTAGES
Fast technique.
Allows a great deal of information to be
collected.
With the help of computerization a large
population of cells can be studied which can
provide statistically significant information.
Flow cytometry allows cell by cell
fluorescence study.
The development of fluorescent DNA
probes should permit analysis at
chromosome level.
LIMITATIONS
Since cells are used in suspension,
information concerning architecture is lost, a
particular problem when determining the
phenotype of lymphoid organs.
Results depend on specimen collection.
The quality of the cell labelling is affected by
the viability of cells.
Heterogeneous populations may contain a
more fragile subpopulation which might be
damaged during cell labelling, leading to
false interpretation.
24
25. RECENT DEVELOPMENTS IN FLOW
CYTOMETRY
One of the most important progresses in flow cytometry technology is the discovery of
Quantum dots (QDs) that provide a great opportunity for highly multiplexed experiments and
improved resolution. QDs do not have an absorption spectrum unlike FITC and PE.
Instead, they have a wide absorption spectrum and so can be excited by a range of different
wavelengths.
They are also extremely photostable at wavelengths greater than 300nm and their different
colors can be excited simultaneously by the same source.
Antibody conjugated QDs are suitable to stain both surface antigens and intracellular antigens.
Spectral Flow Cytometers - high-resolution measurements of the cell and other particles
Microfabricated Flow Cytometers-use microfluidics. used to analyze single cells in a small
population, cellular differences in gene expression or response to a drug within a population of
cells.
25
26. FLOW CYTOMETRY MARKET ANALYSIS
(Flow Cytometry Market Analysis By Technology (Cell-Based, Bead-Based), By Application (Research, Industrial, Clinical),
By End-use (Commercials, Hospitals, Academics, Clinical Labs), By Product & Service, & Segment Forecasts, 2014 - 2025
Published: February 2017 )
The global flow cytometry market size was valued at USD 3.27 billion in 2016 and is expected to
grow at a CAGR of 10.6% over the forecast period.
Key drivers include rising prevalence of chronic diseases, which needs toxicity testing such as
cancer tests and demand for rapid, accurate, & sensitive prognosis techniques for disease validation.
Growing awareness level amongst patients and healthcare professionals and high level of healthcare
expenditure are high-rendering drivers for flow cytometry industry growth.
associated advantages of cell-based assays such as ease-of-use, high sensitivity & reproductively,
and advancement in reagents & software used for the analysis are other factors expected to drive the
growth.
Increasing demand for early diagnosis and rising awareness pertaining to associated benefits with
cell-based assays are the factors attributing to its dominance over the forecast period.
26
27. The instrument segment dominated the market in 2016 owing to greater penetration coupled
with advantages such as accurate result, cost-effective nature, and user-friendliness. Reagents
and consumables, owing to their increased usage in cancer diagnostics are expected to register
lucrative growth.
Flow cytometry has applications in research, clinical diagnosis, and industrial sectors.
Research segment dominated in 2016 owing to an increasing R&D pertaining to cancer and
other infectious diseases. Flow cytometry also has applications in various industries such as
food microbiology and plant tissue culture.
Clinical diagnosis is expected to be the fastest growing application segment by 2025. Clinical
diagnosis market is driven by factors such as increasing demand for cost-effective disease
diagnostic tools and associated benefits of these assays in disease detection.
27
28. The commercial organization segment held the largest revenue share owing to wide
applications across various verticals such as food microbiology, blood banks, and plant cell
culture. The introduction of multiplex probes and reagents for specific applications in
diagnostics & drug discovery is expected to serve this vertical with growth opportunities by
catering to the users in research and small peripheral laboratories.
Hospitals are expected to grow at lucrative CAGR due to increasing diagnostic tests
necessitated by rising prevalence of chronic & infectious diseases, supportive reimbursement
policies, and growing awareness amongst patients.
Some of the key players operating in this industry are Beckman Coulter, Inc.; Becton,
Dickinson and Company; Sysmex Corporation; Agilent Technologies; Merck & Co., Inc.,
Apogee Flow Systems Ltd.; Bio-Rad Laboratories, Inc.; Thermo Fisher Scientific,
Stratedigm, Inc.; Luminex Corporation; Miltenyi Biotec; and GE Healthcare.
28
29. REFERENCES
1. Qadir, M., Barcos, M., Stewart, C.C., Sait, S.N., Ford, L.A. and Baer, M.R. (2006) Routine immunophenotyping in acute leukemia: Role in lineage assignment and
reassignment. Cytometry70:329-334.
2. Craig, F.E. and Foon, K.A. (2008) Flow cytometric immunophenotyping for hematologic neoplasms. Blood 111:3941-3967.
3. Kern, W., Haferlach, C., Haferlach, T. and Schnittger, S. (2008) Monitoring of minimal residual disease in acute myeloid leukemia. Cancer 112:4-16.
4. Mandy, F., Janossy, G., Bergeron, M., Pilon, R. and Faucher, S. (2008) Affordable CD4 T-cell enumeration for resource-limited regions: A status report for
2008. Cytometry, 74, Suppl 1:S27-39.
5. Gratama, J.W., Orfao, A. and 14 other authors (1998) Flow cytometric enumeration of CD34+ hematopoietic stem and progenitor cells. Cytometry 34:128-142.
6. Bell, A., Shenton, B. and Garner, G. (1998) The flow cytometric crossmatch in solid organ transplantation. Proc. RMS 33:219-220.
7. Shanahan, T. (1997) Application of flow cytometry in transplantation medicine. Immunol. Invest.26:91-101.
8. Nance, S.J., Nelson, J.M., Arndt, P,A., Lam, H.C. and Garratty, G. (1989) Quantitation of fetal-maternal hemorrhage by flow cytometry. A simple and accurate
method. Am. J. Clin. Pathol. 91:288-92.
9. Michael Brown and Carl Wittwer(2000) Flow Cytometry: Principles and Clinical Applications in Hematology.Clinical Chemistry 46:8(B) 1221–1229
10. Aysun Adan, Günel Alizada, Yağmur Kiraz, Yusuf Baran & Ayten Nalbant(2015) Flow cytometry: basic principles and applications. Critical Reviews in
Biotechnology ISSN: 0738-8551
11. David L. Jaye, Robert A. Bray, Howard M. Gebel, Waynea. C. Harris And Edmund K. Waller “Translational Applications Of Flowcytometry In Clinical Practice” J
Immunol (2012)
12. Radhia Boumiza, Anne Lise Debard and Guillaume Monneret “The basophil activation test by flow cytometry: recent developments in clinical studies,
standardization and emerging perspectives”. Clinical and Molecular Allergy2005
29