Download to read offline

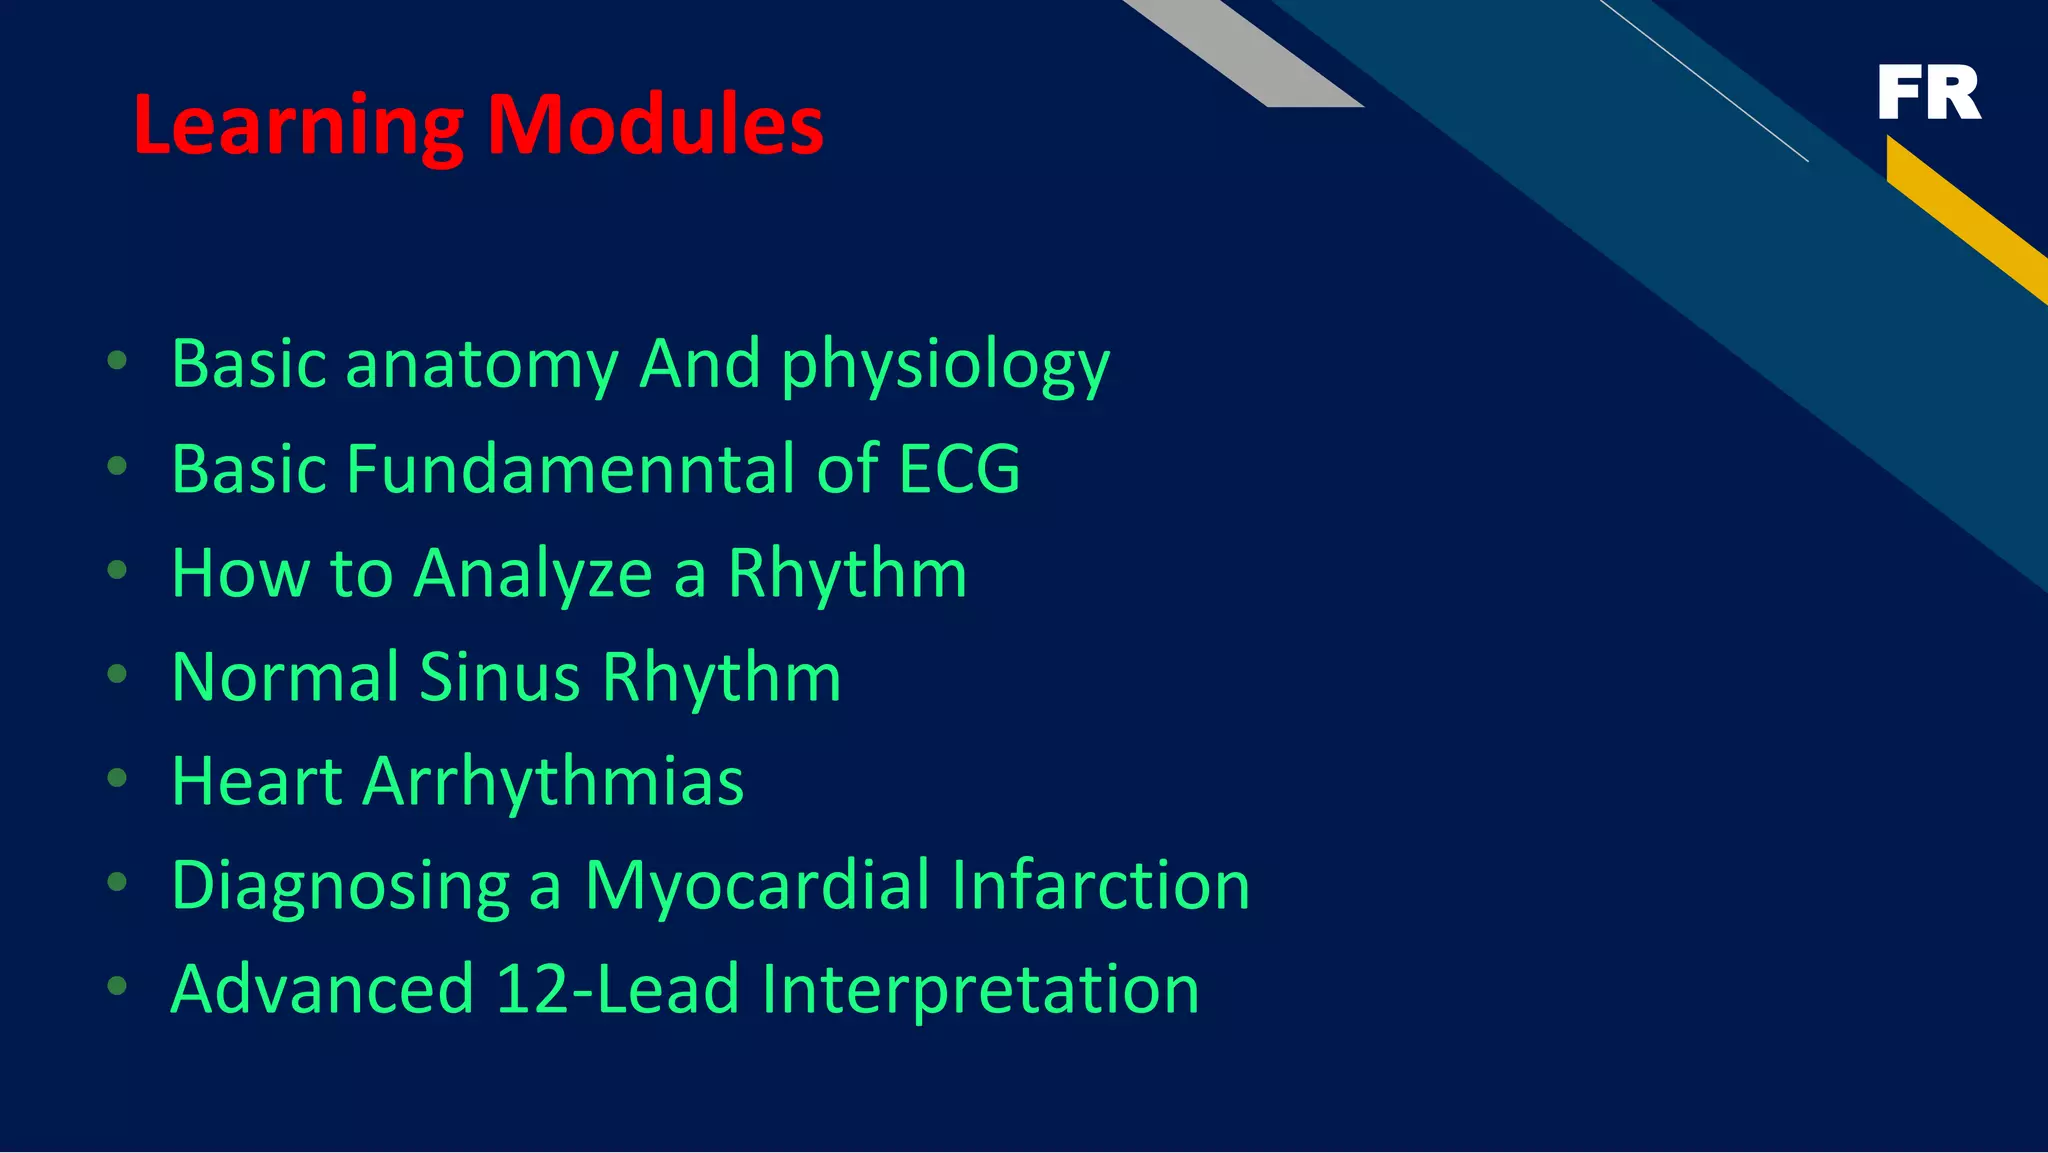

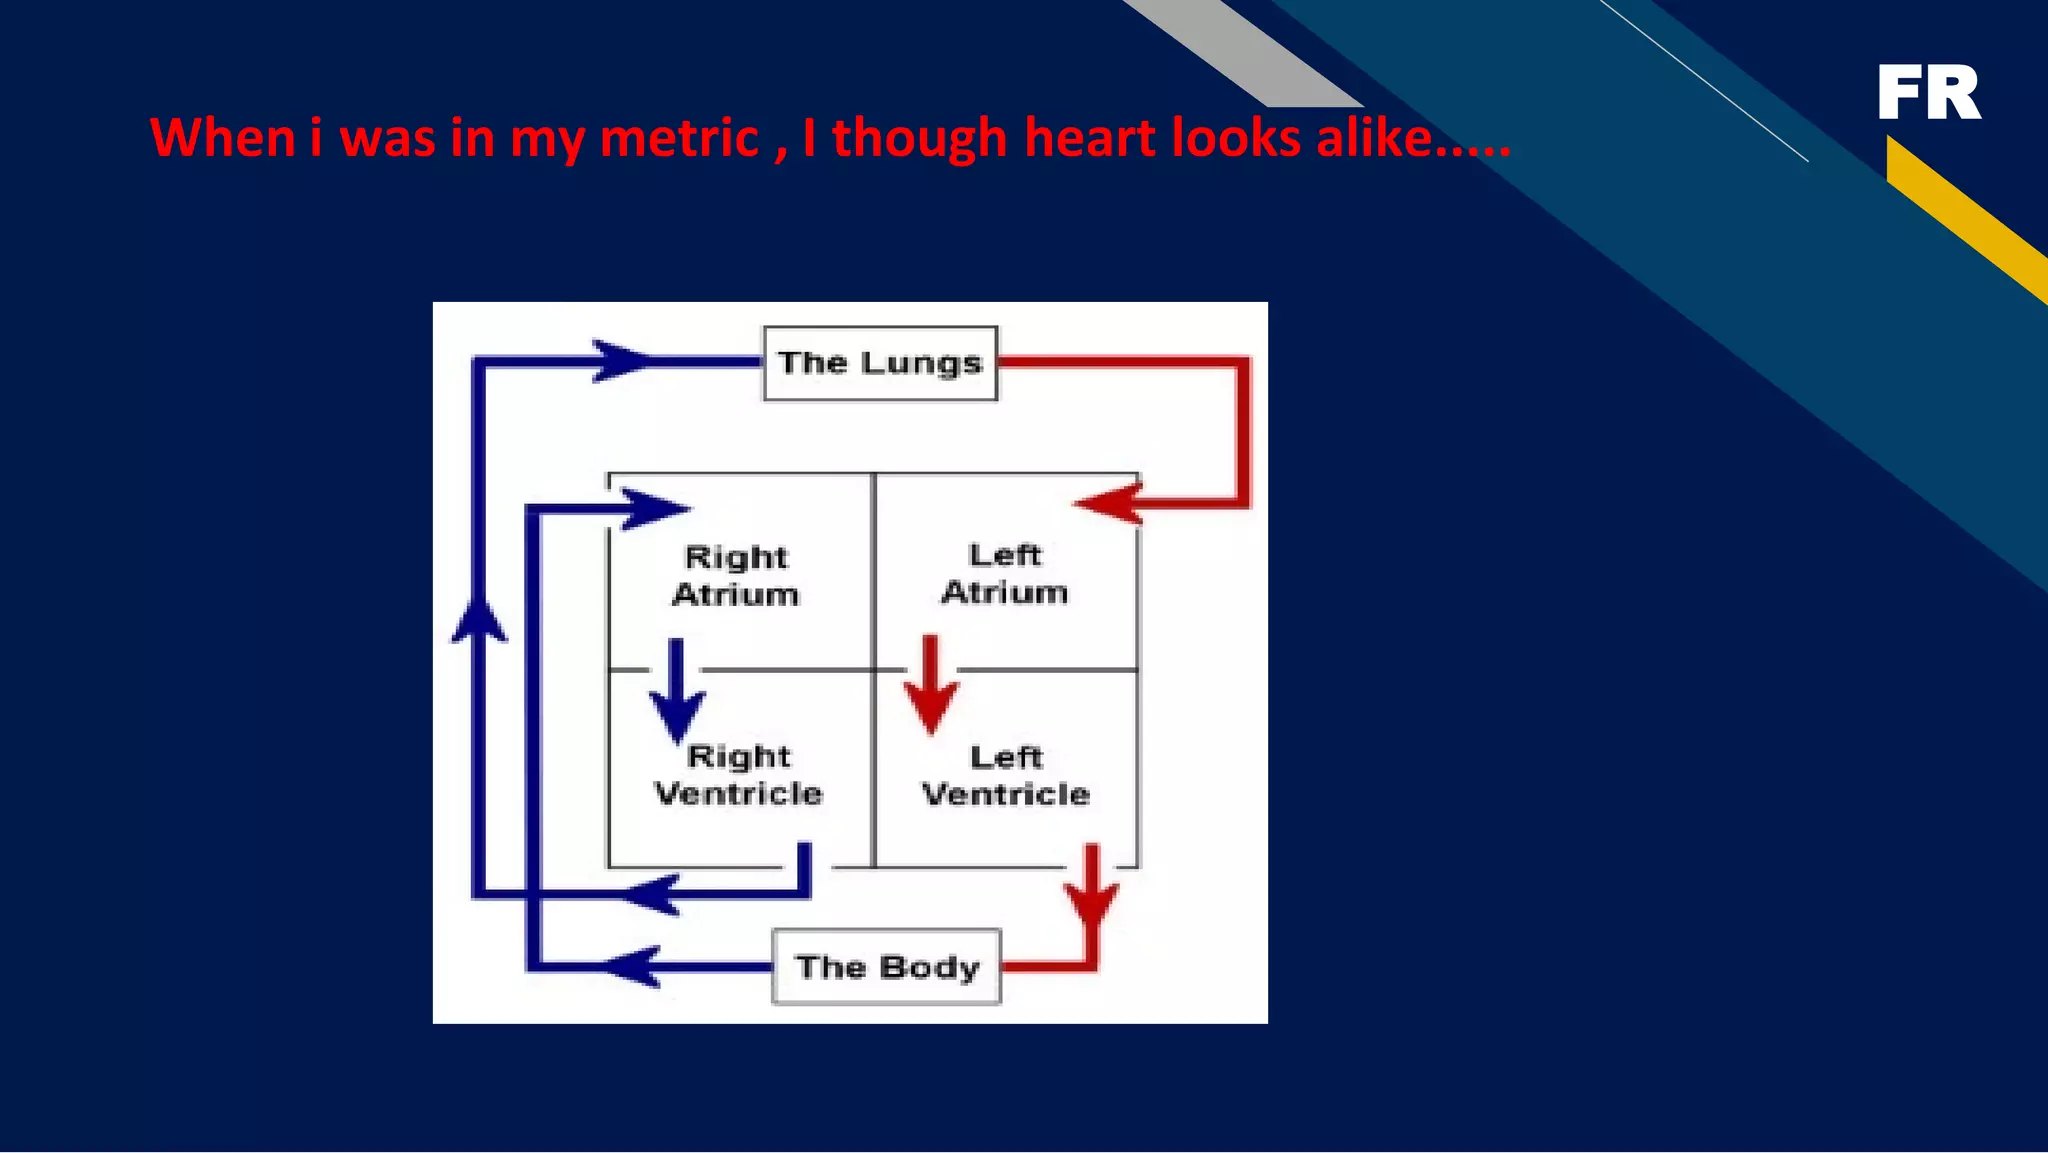


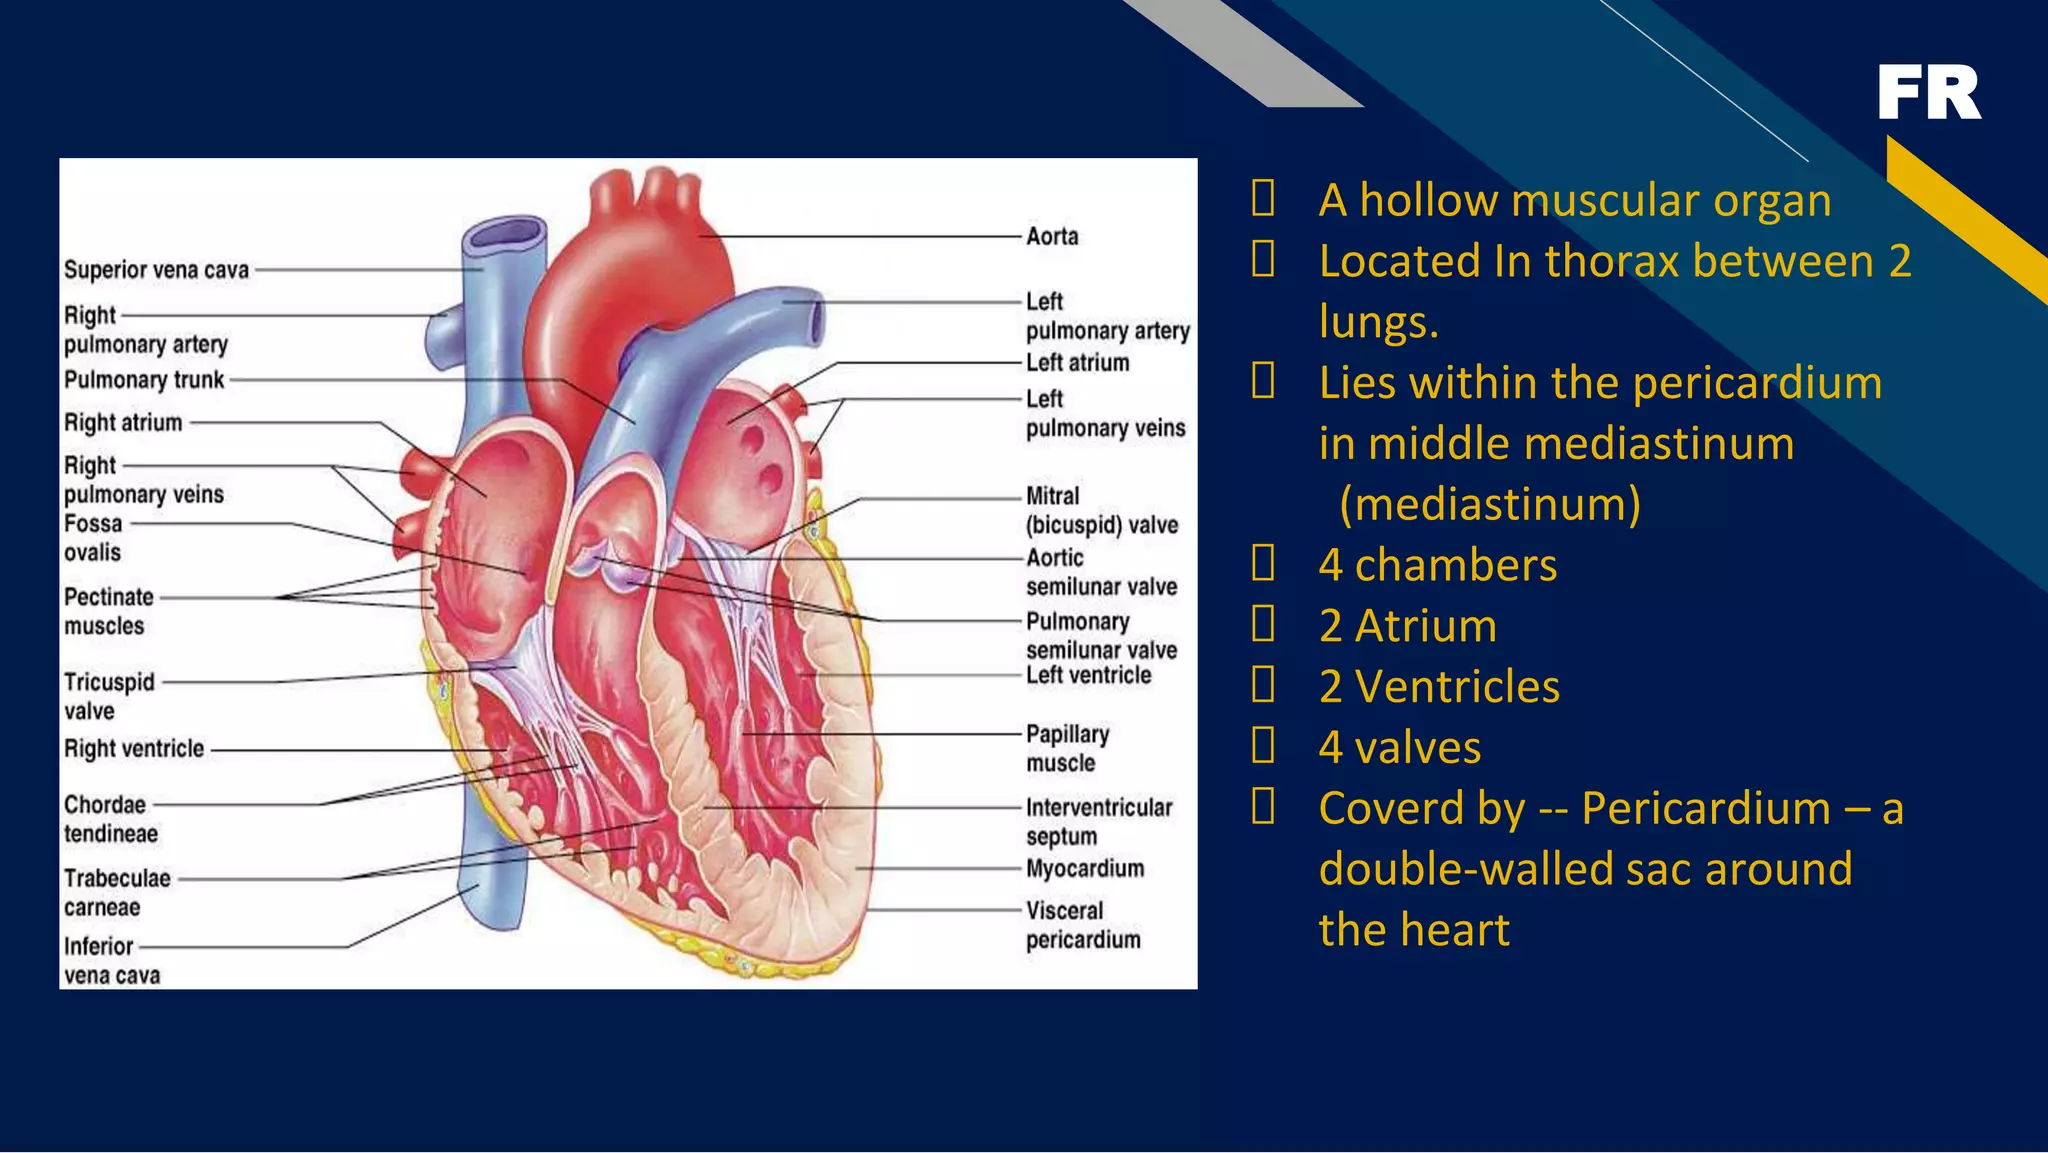
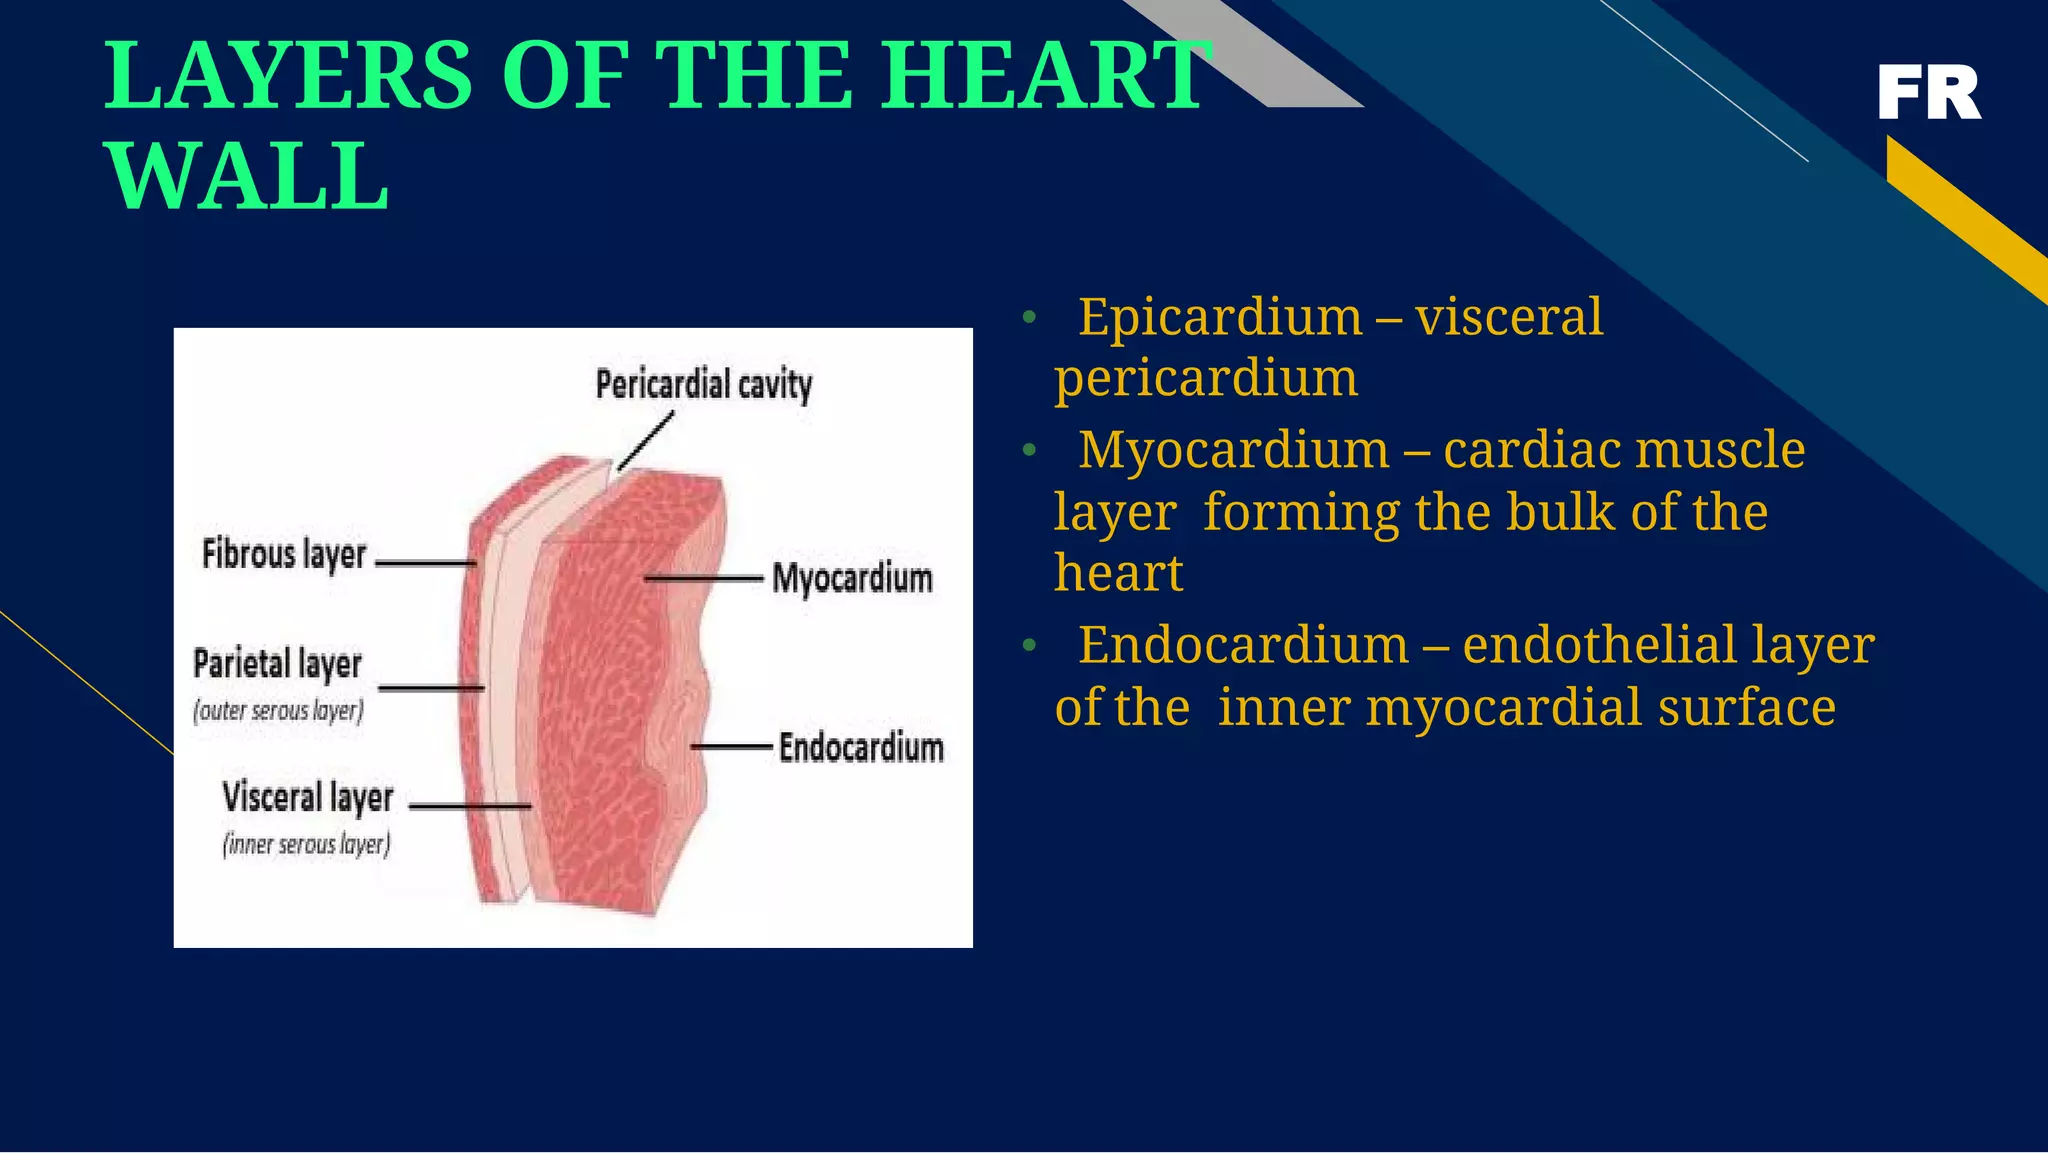
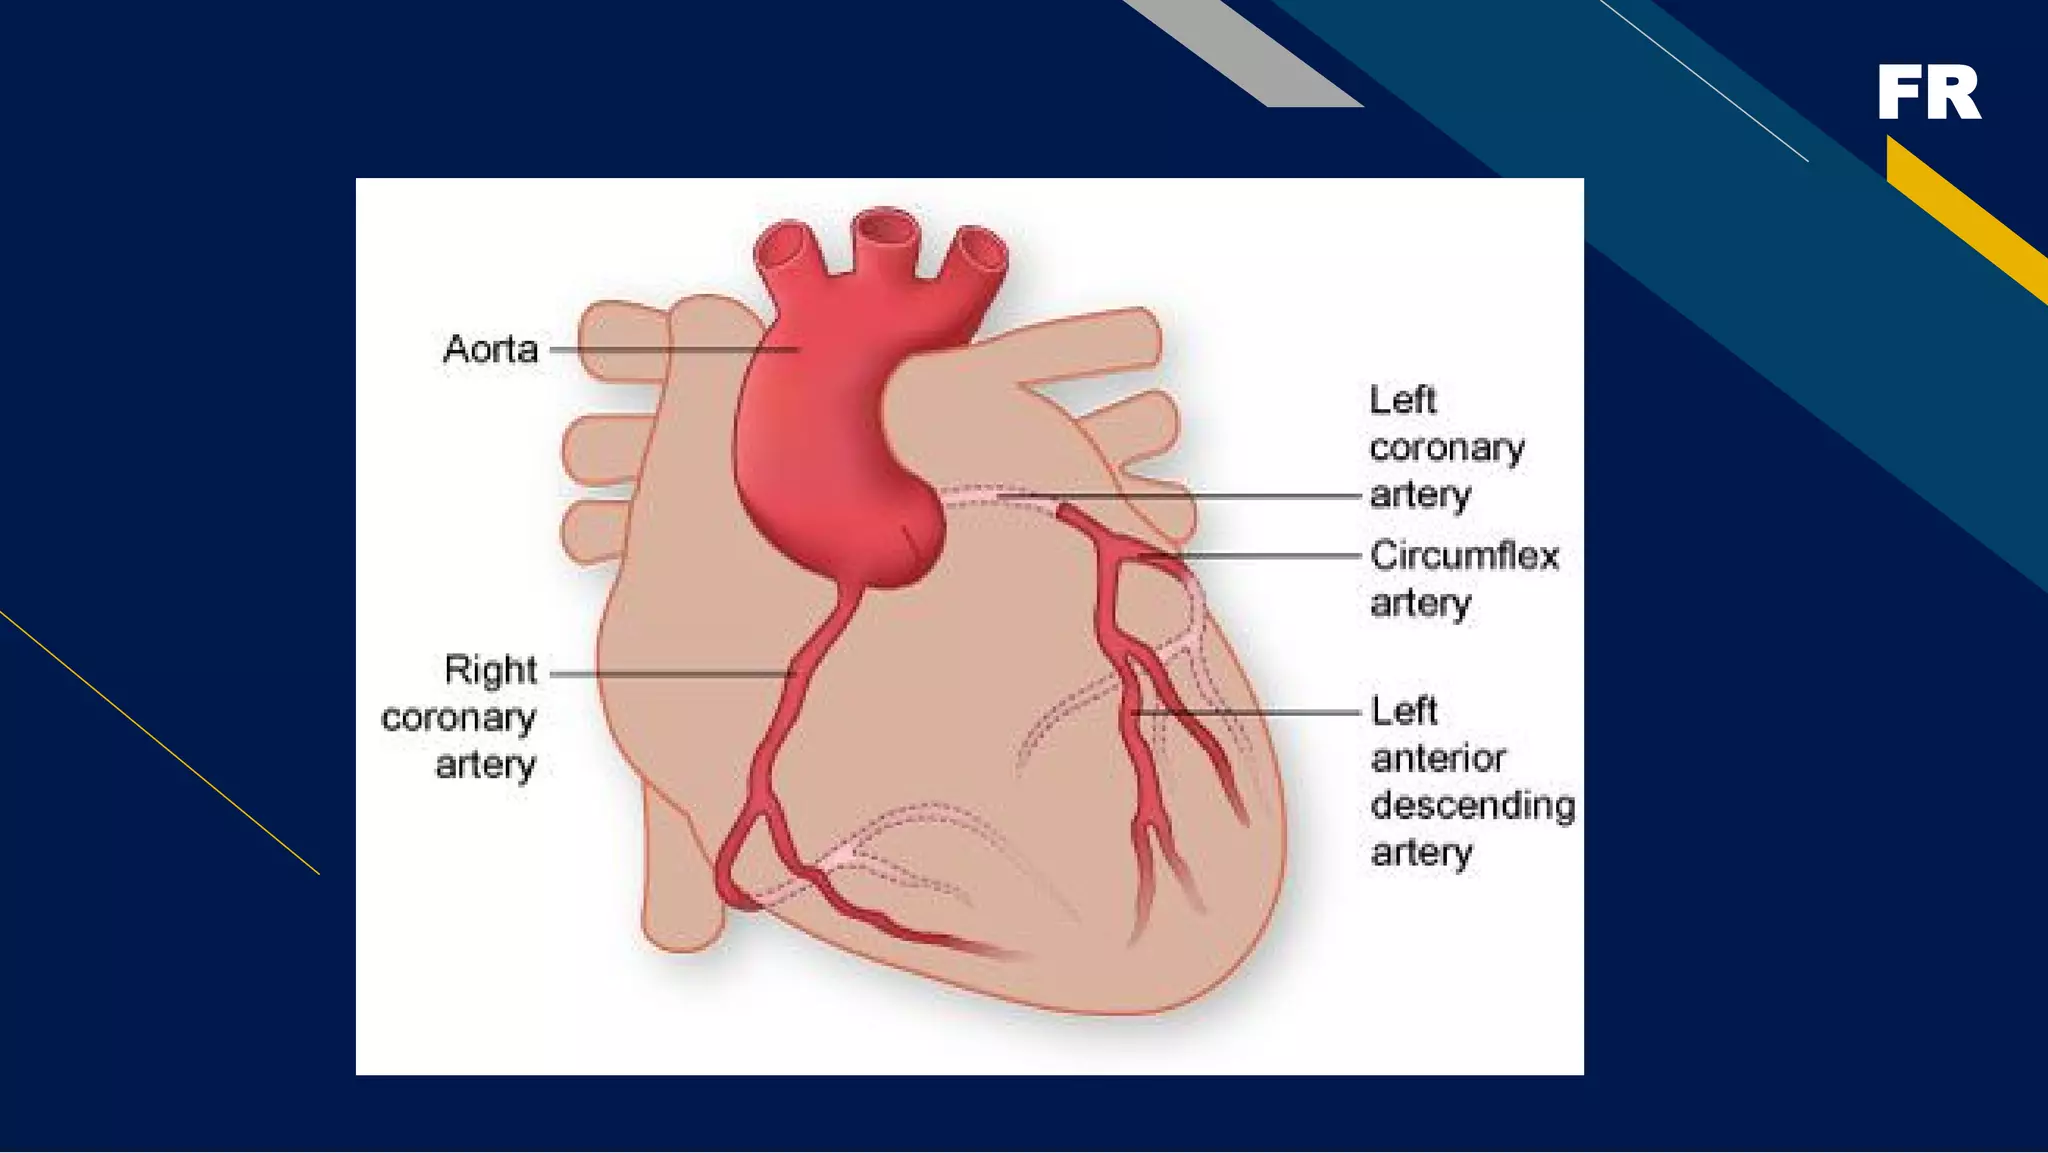
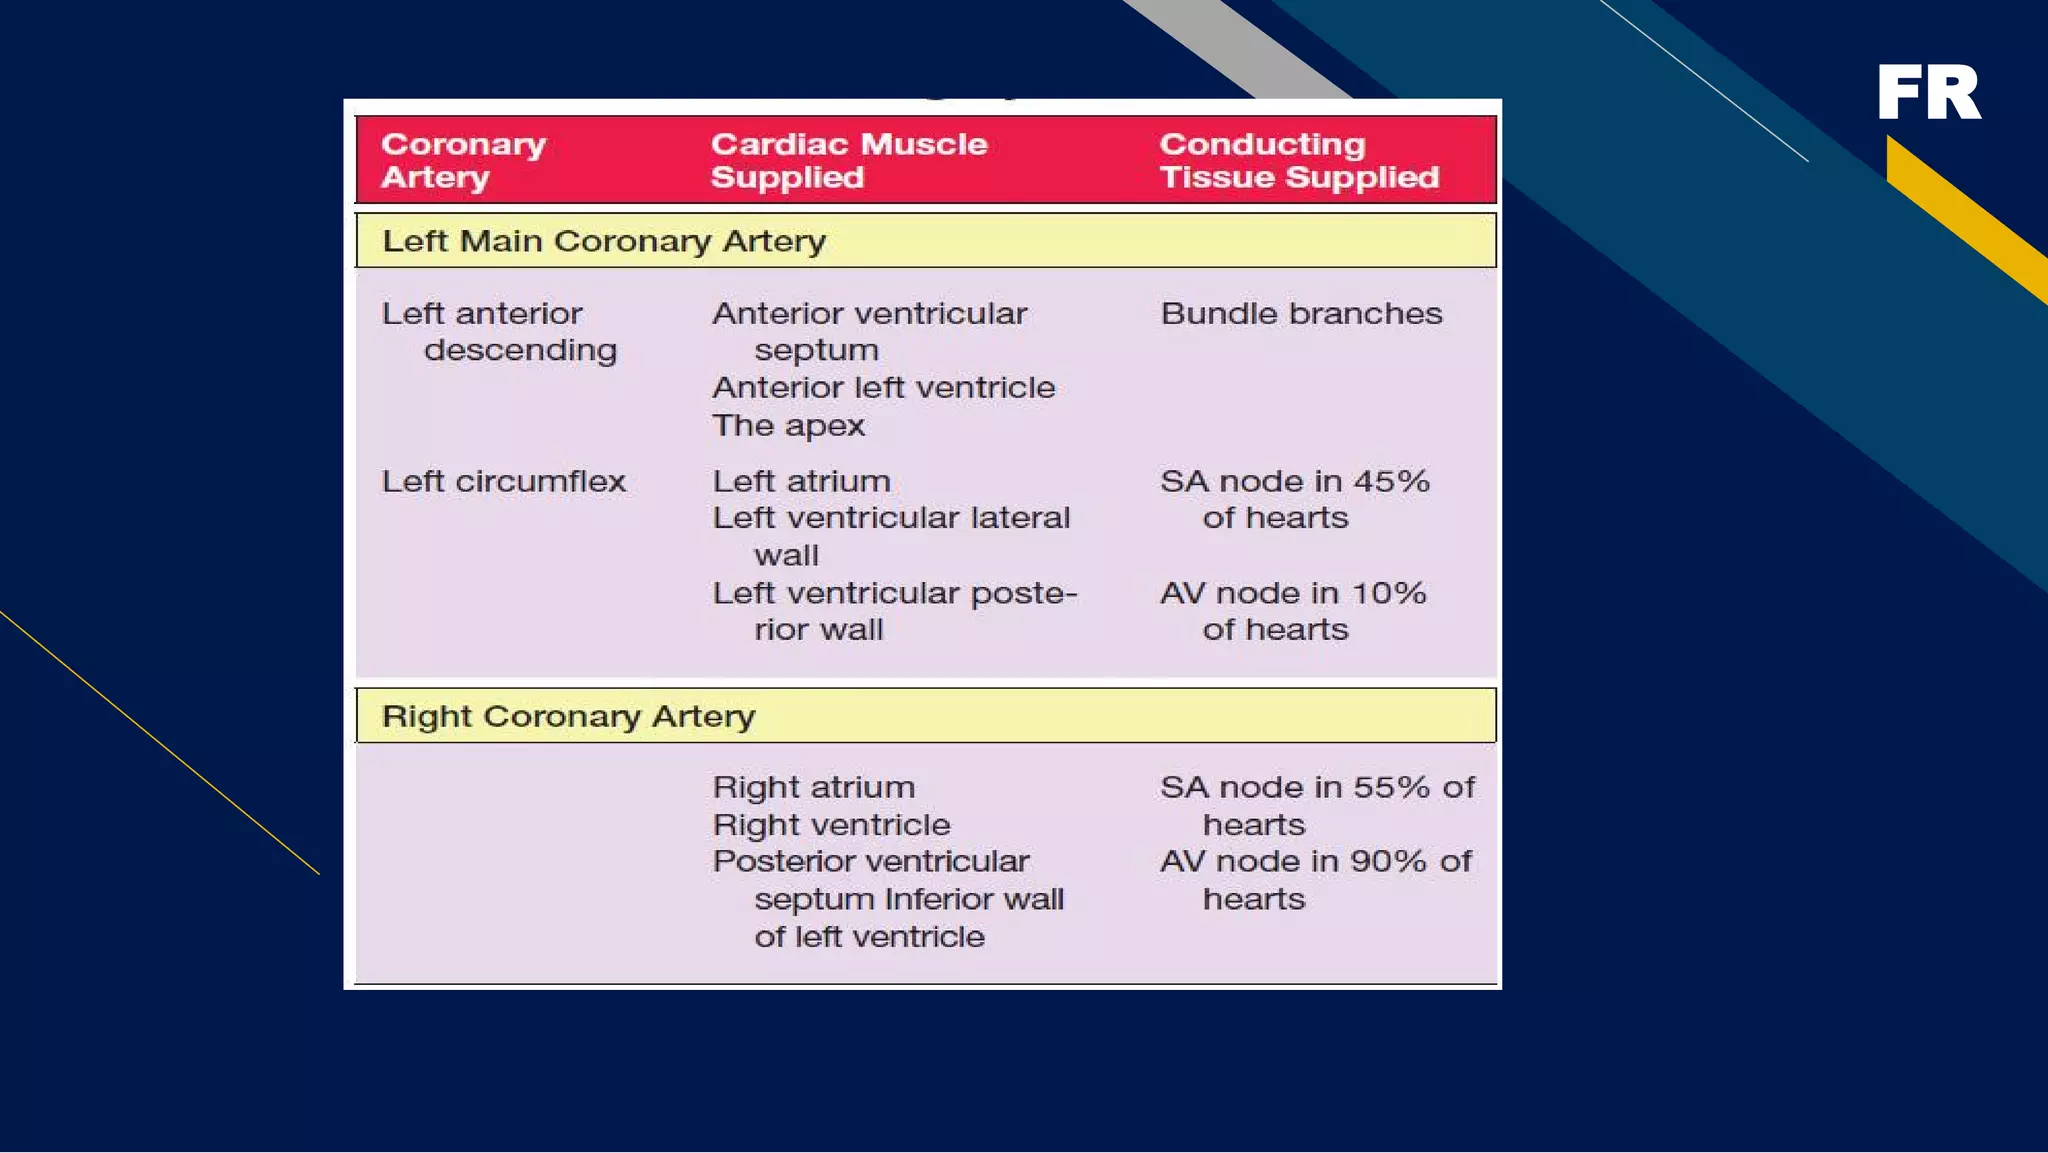
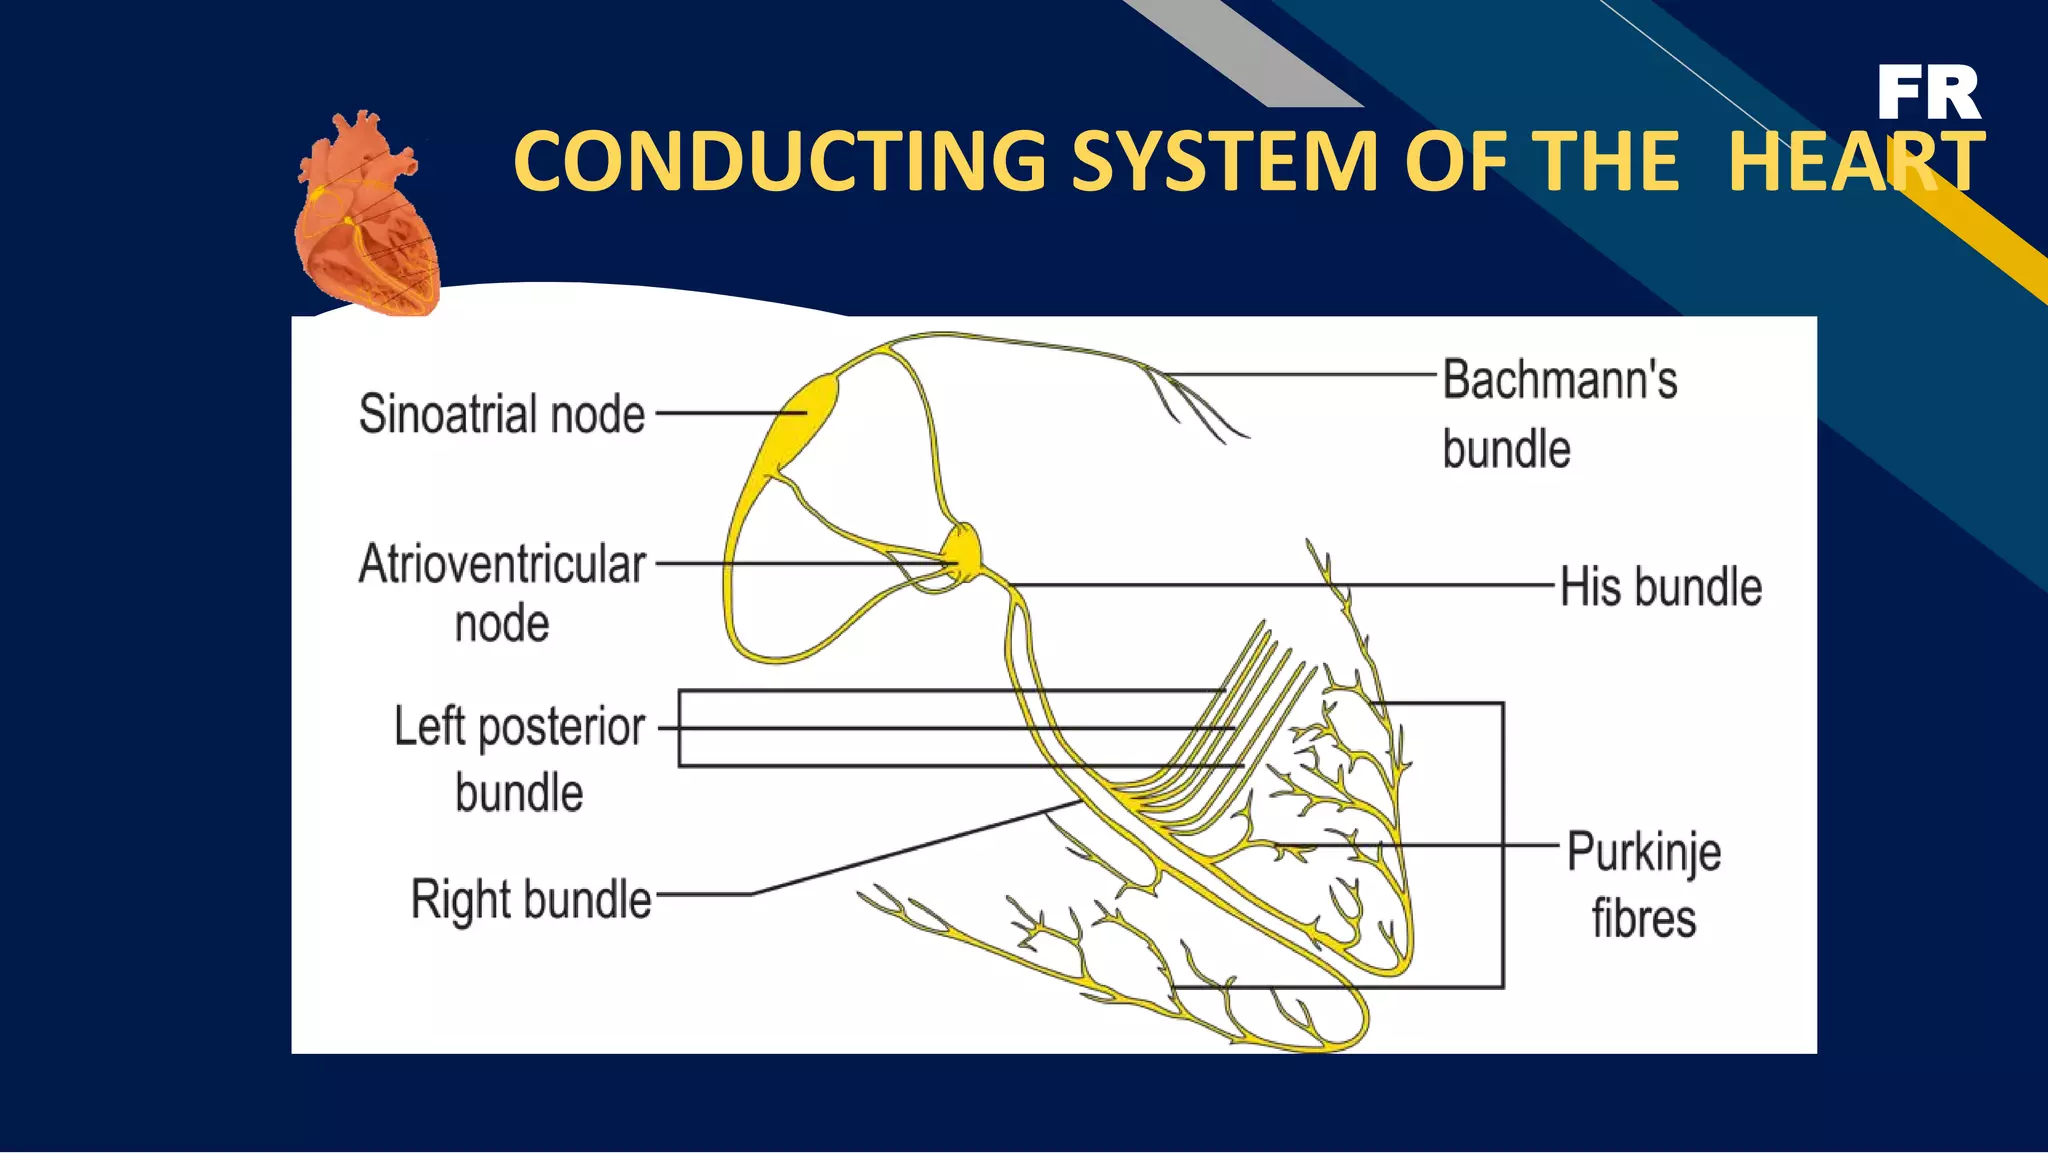
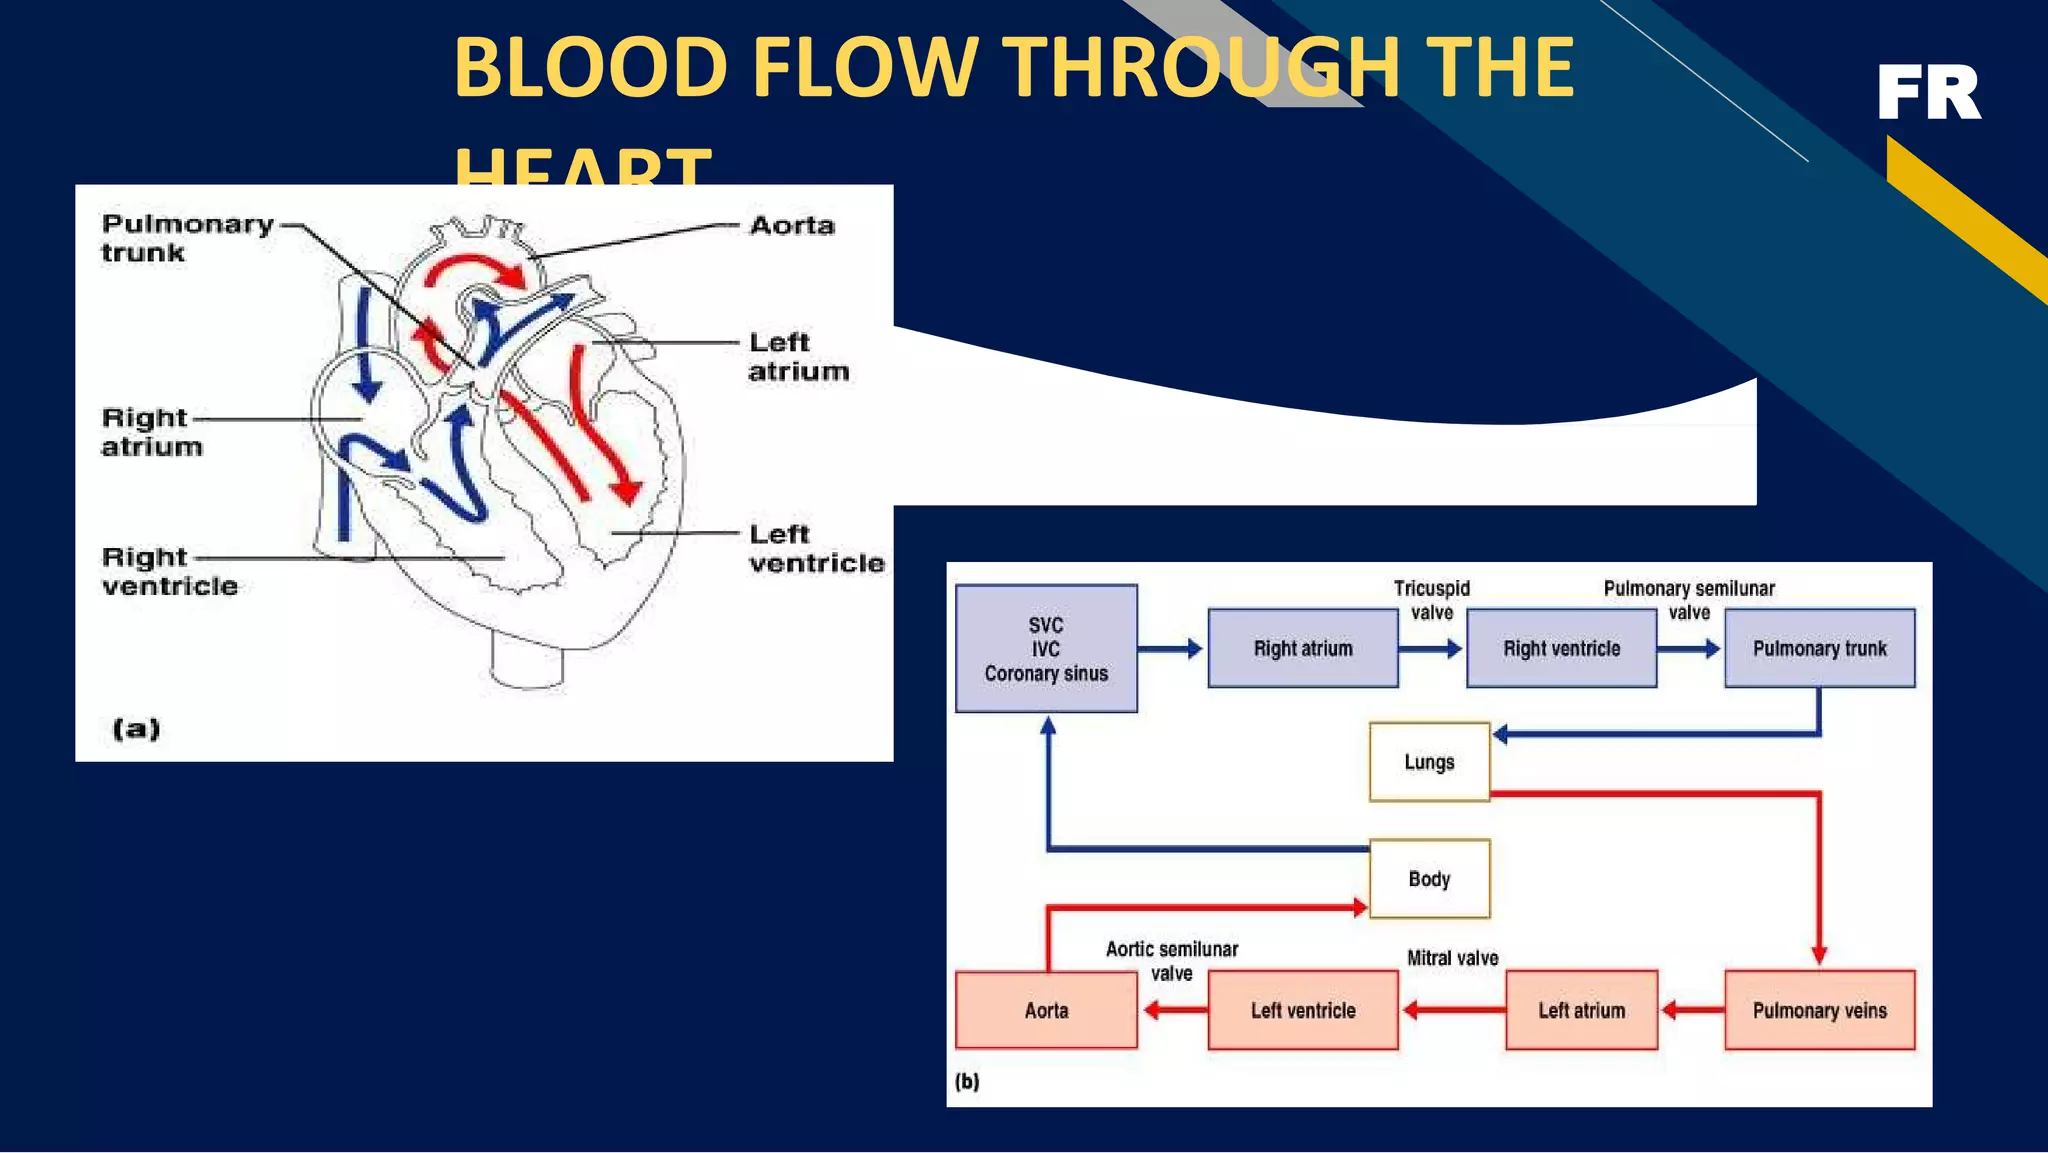
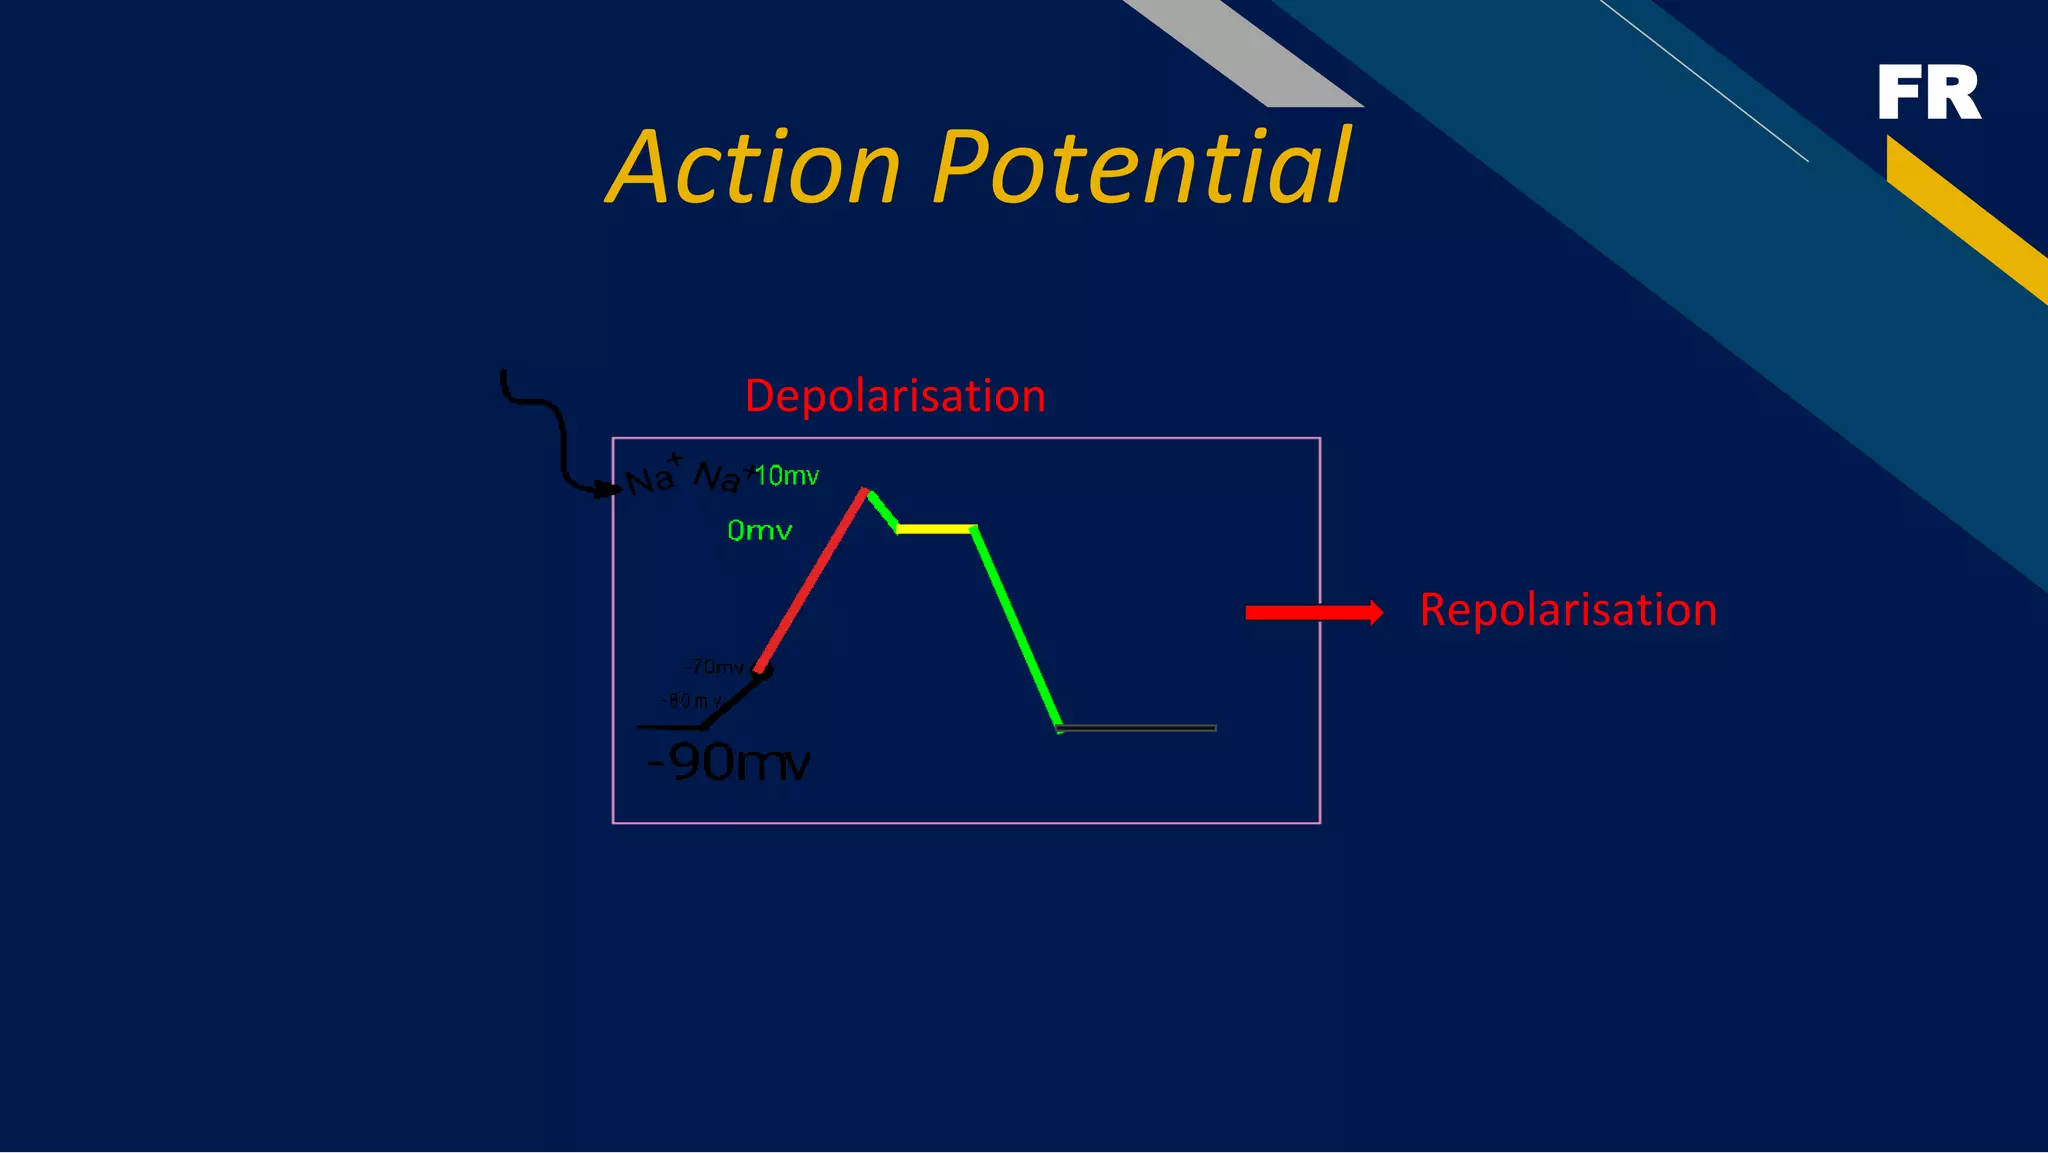
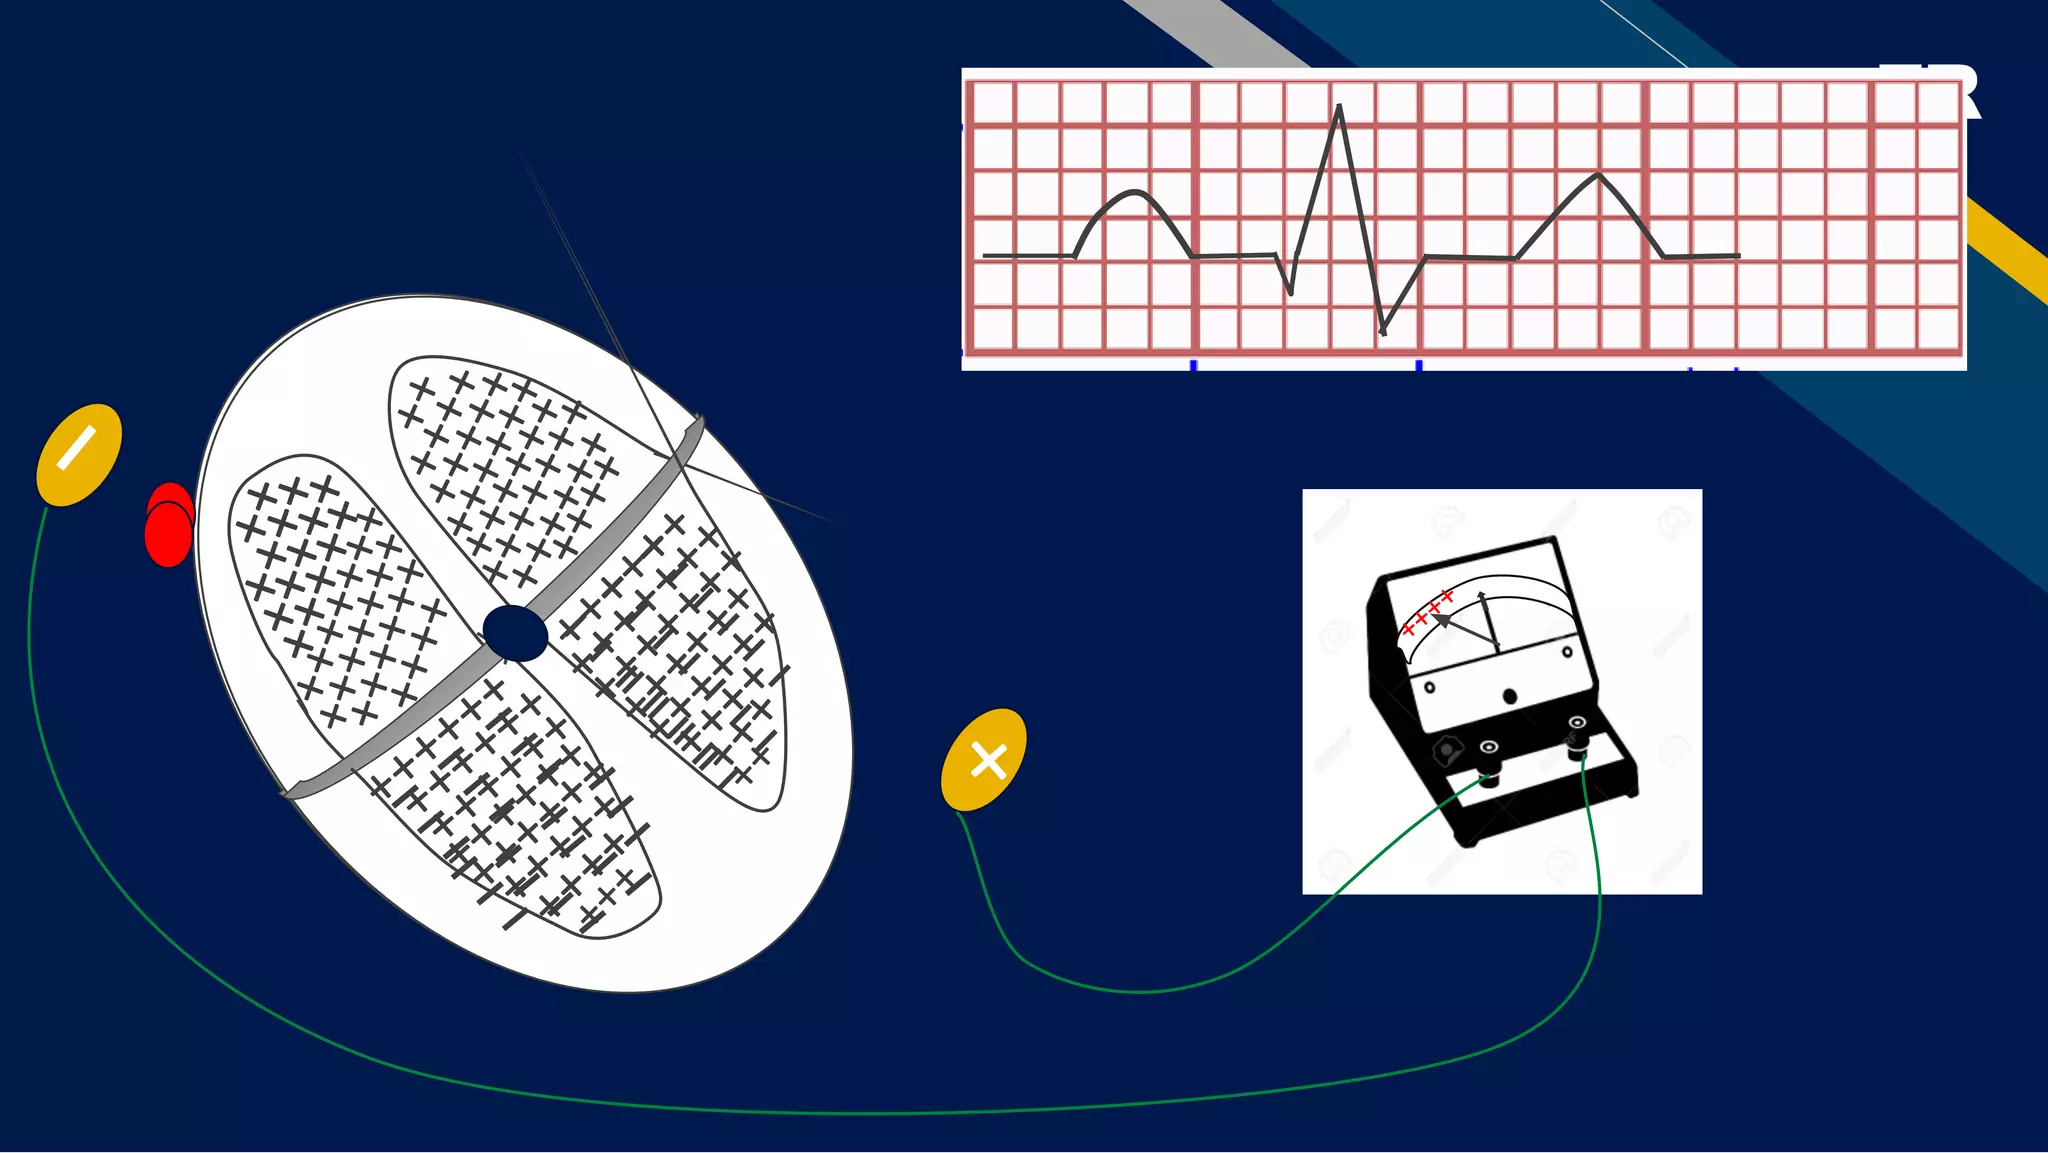
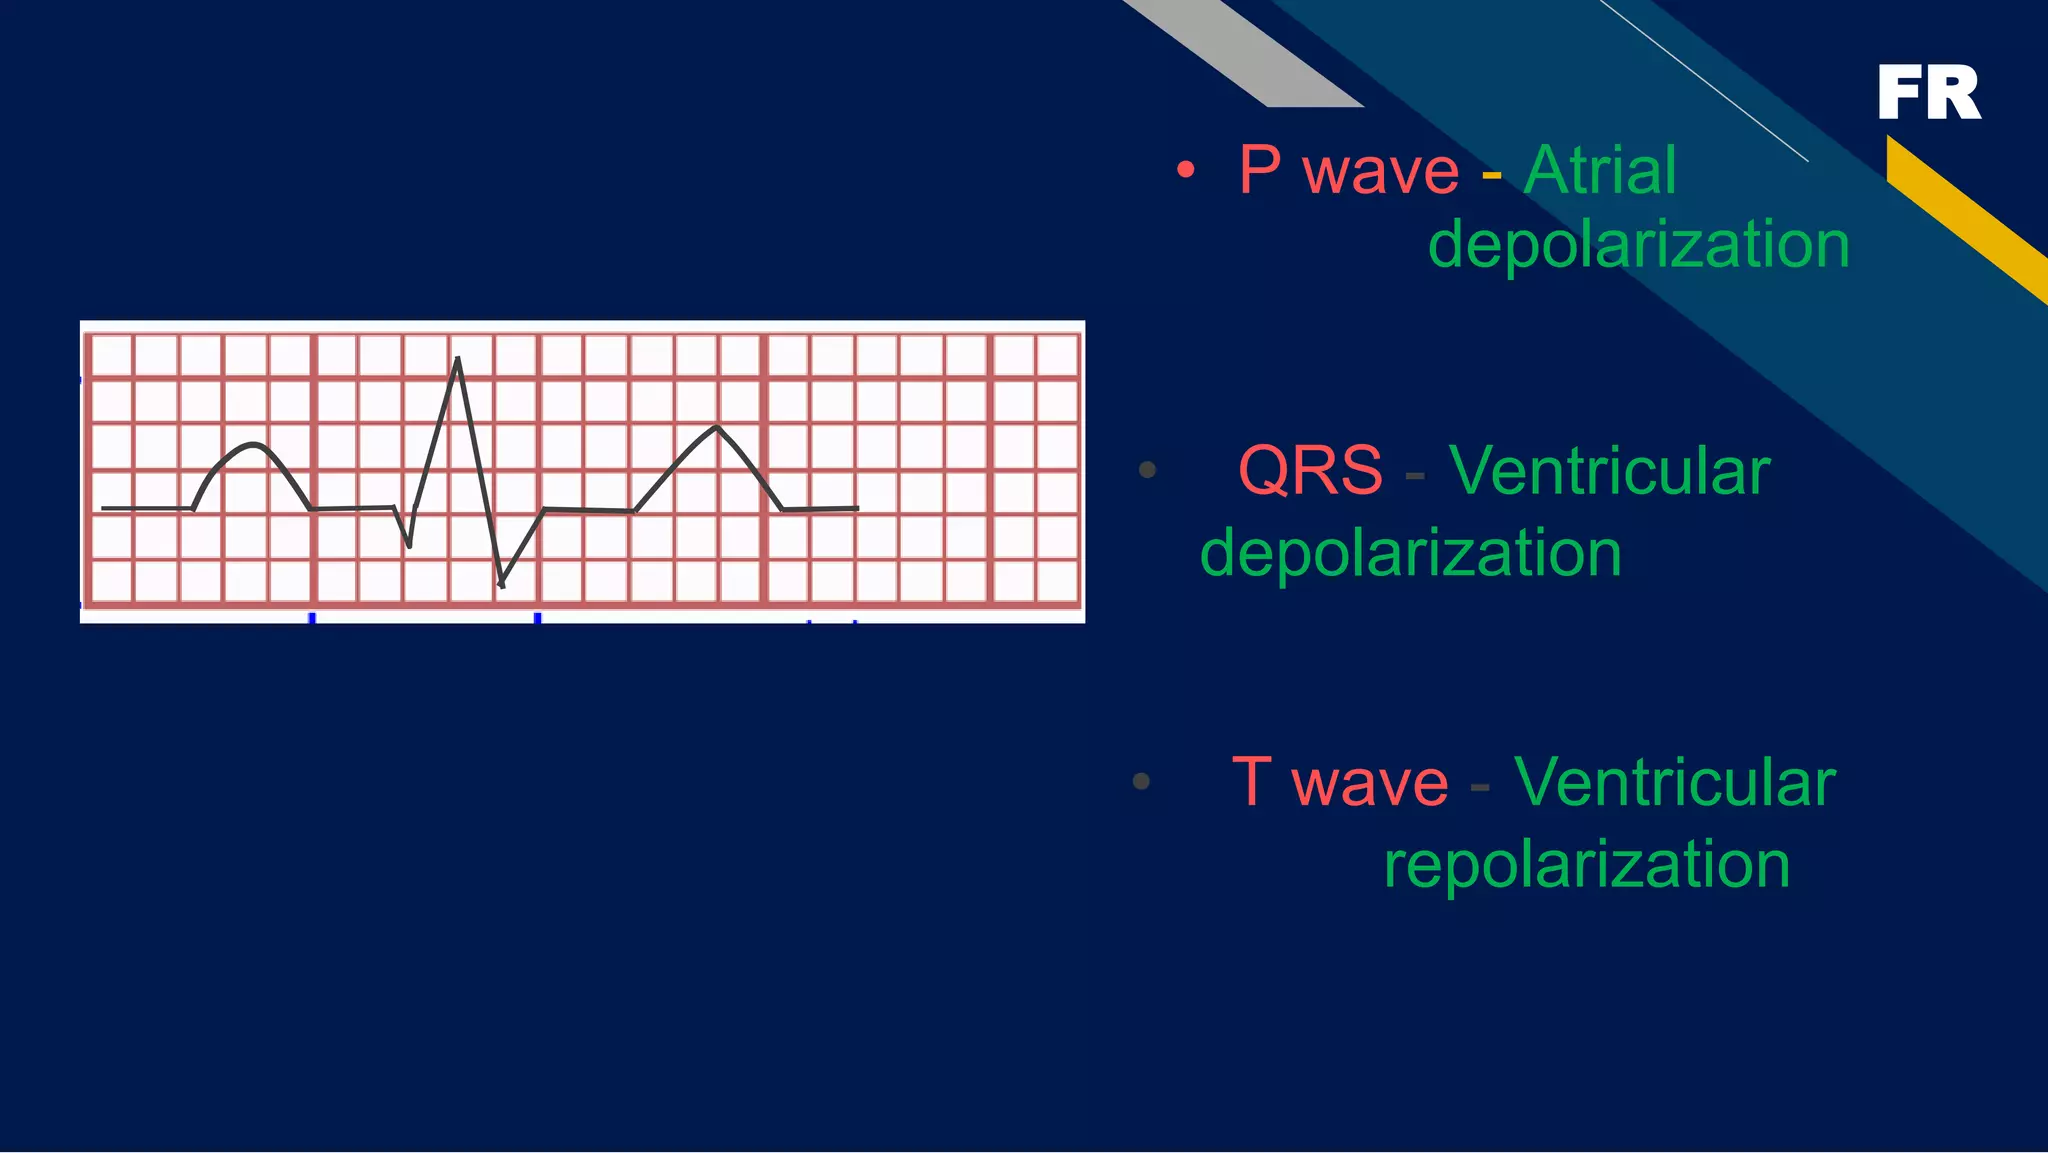

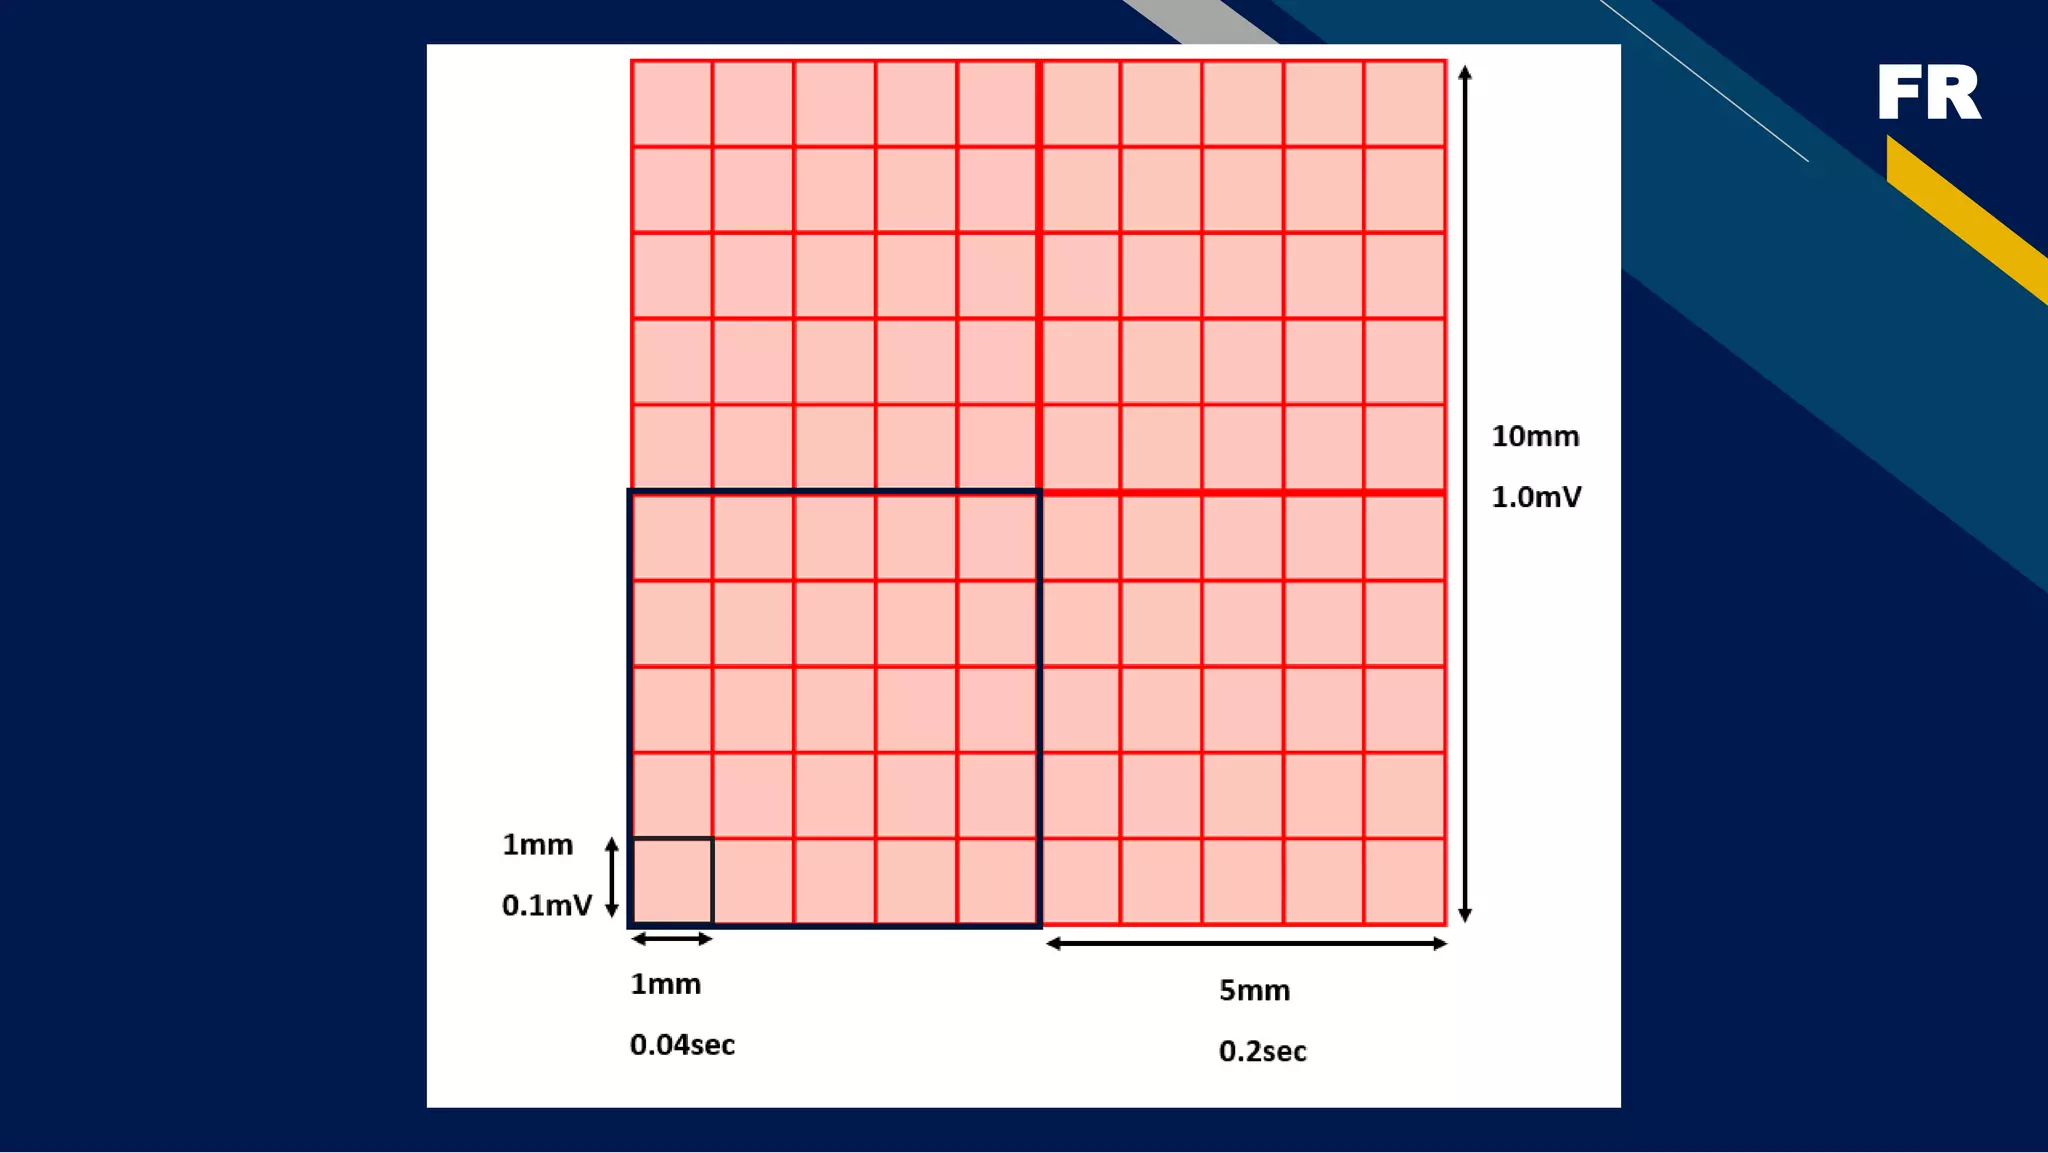
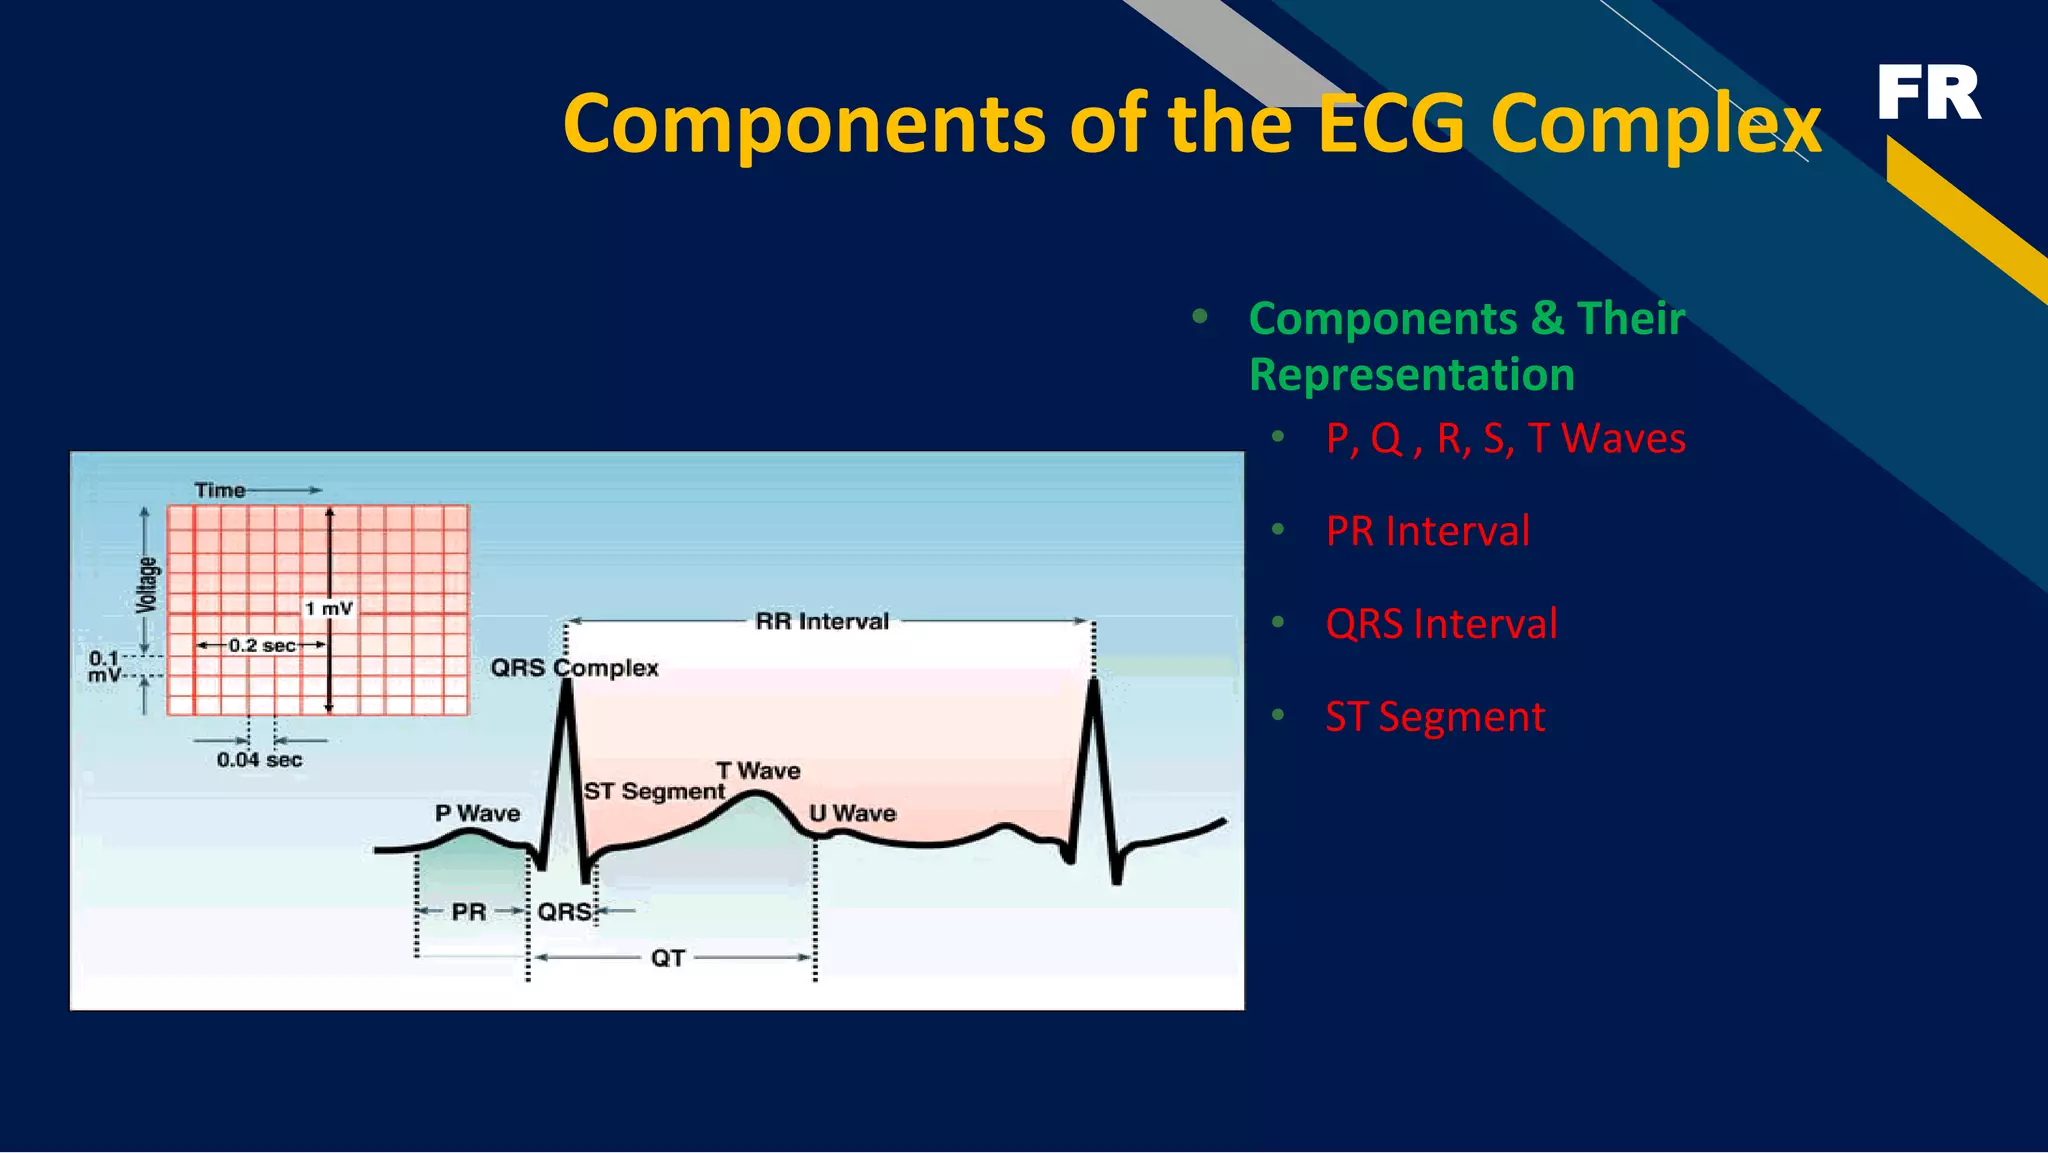

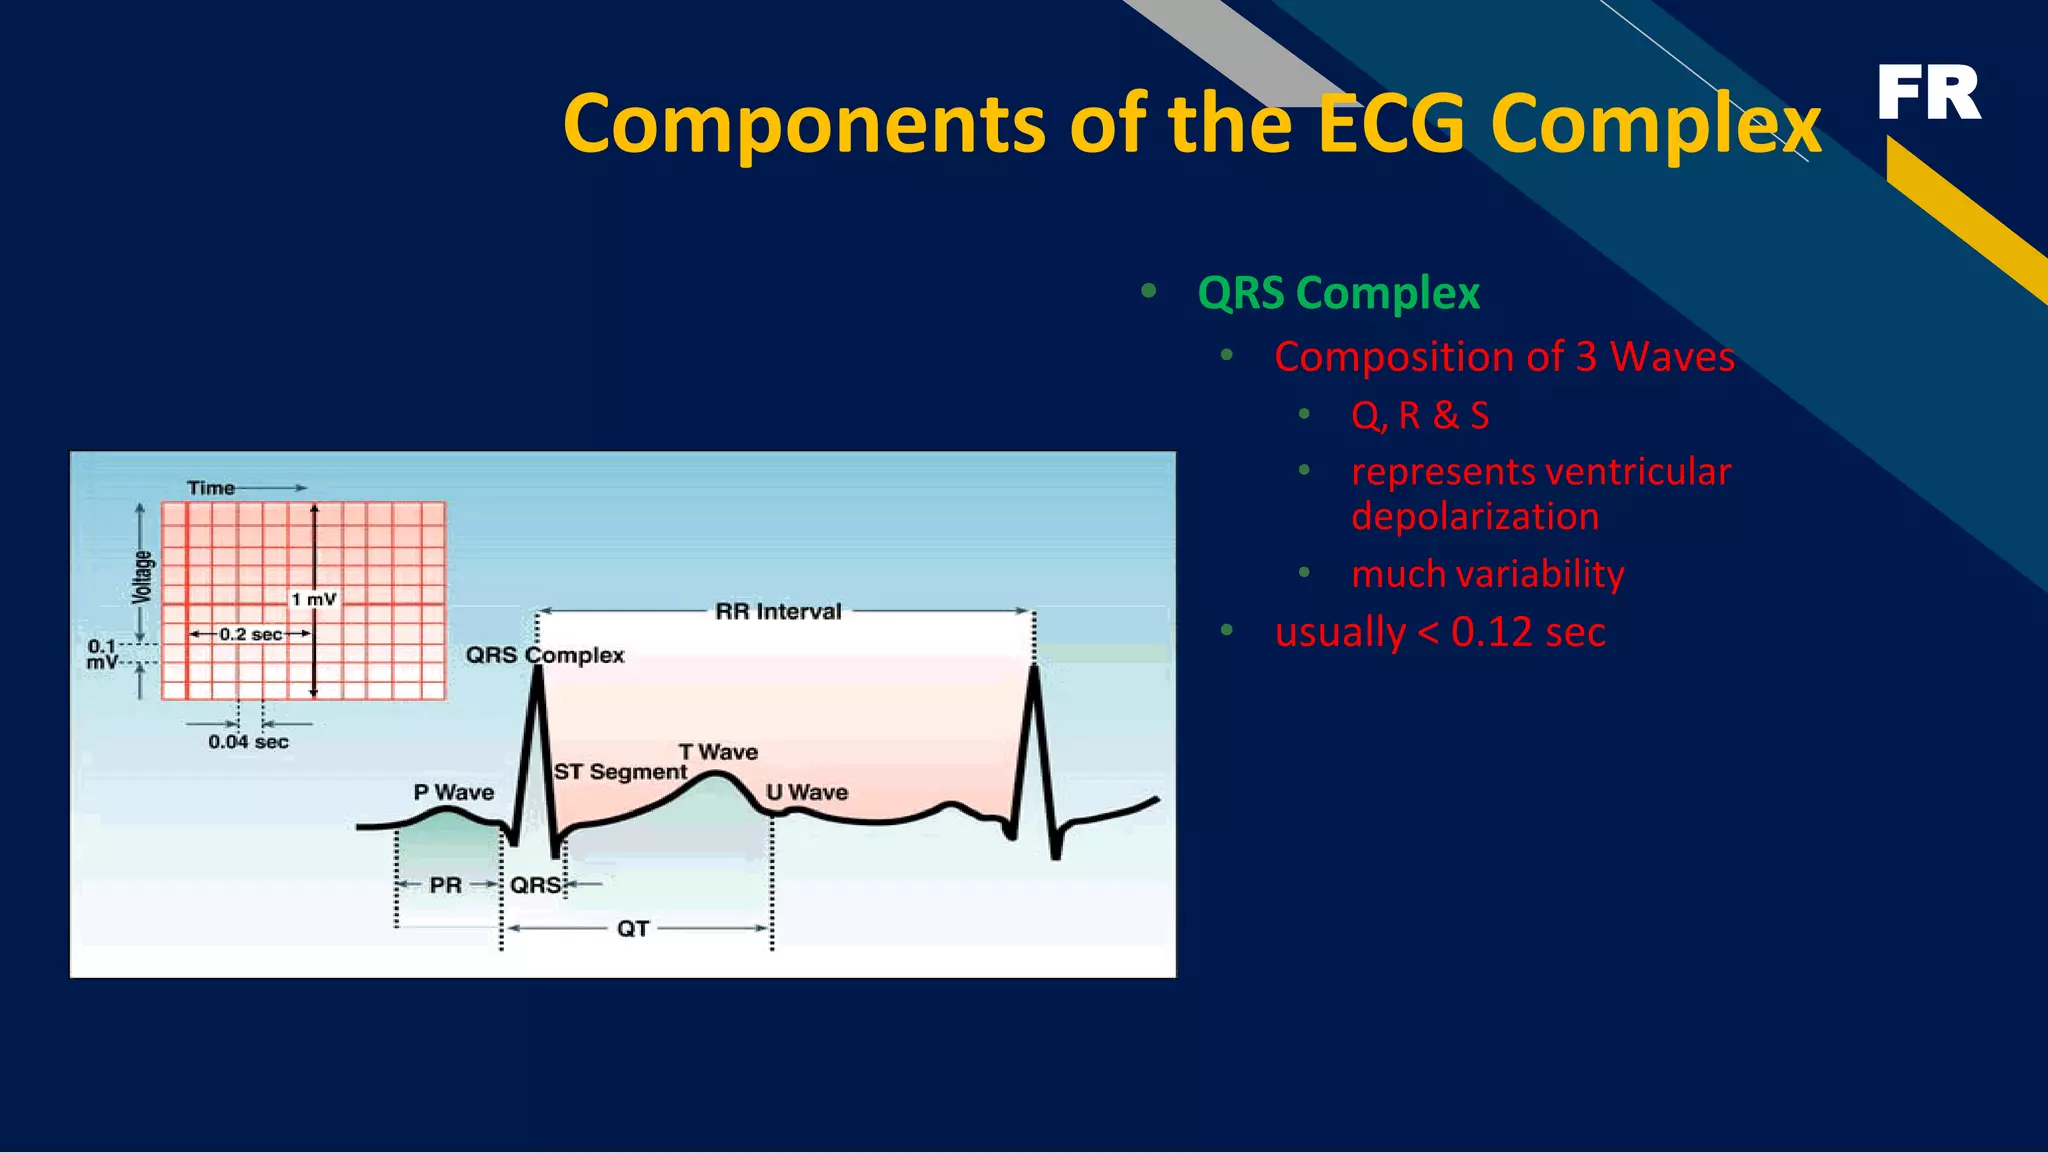

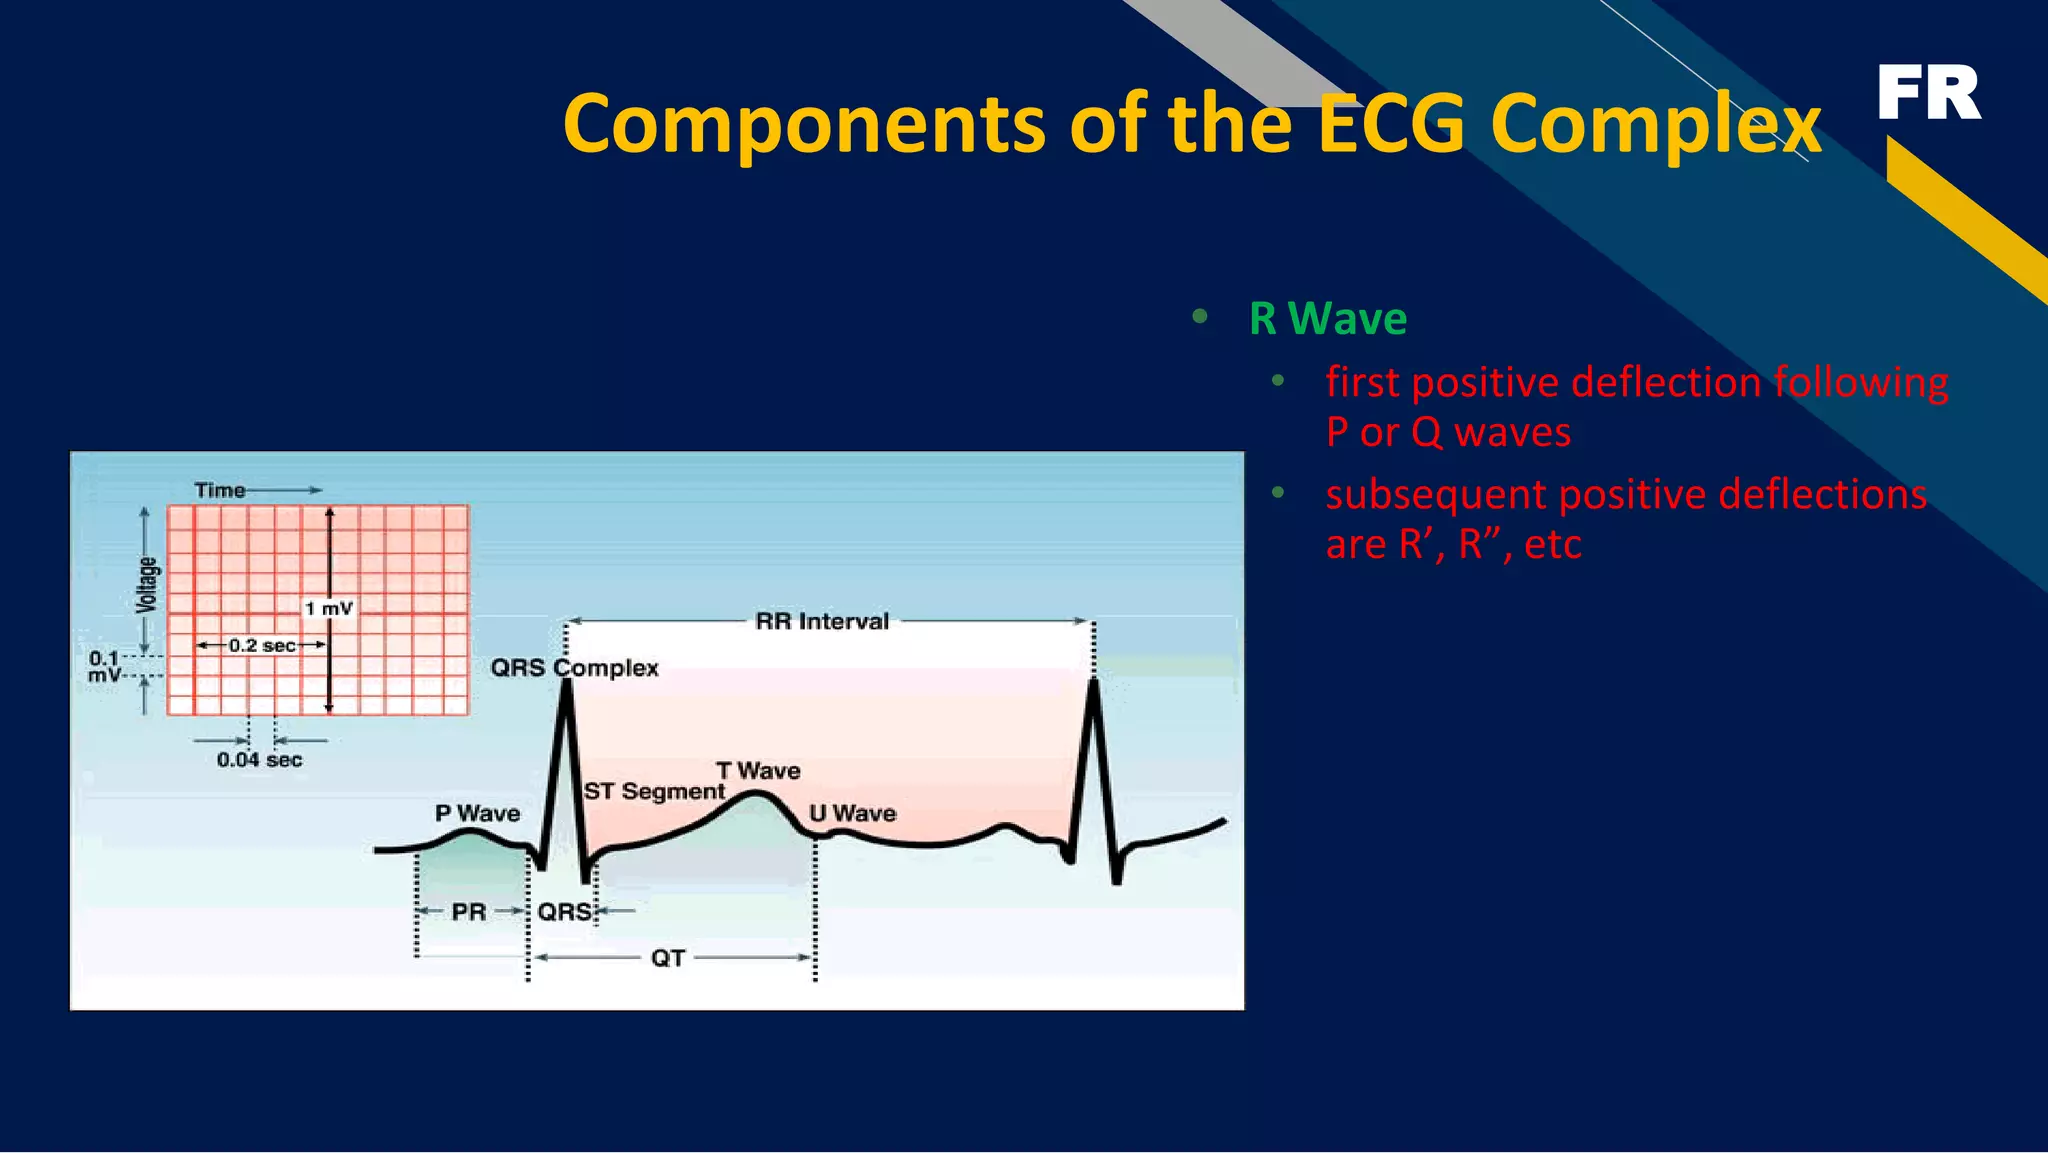


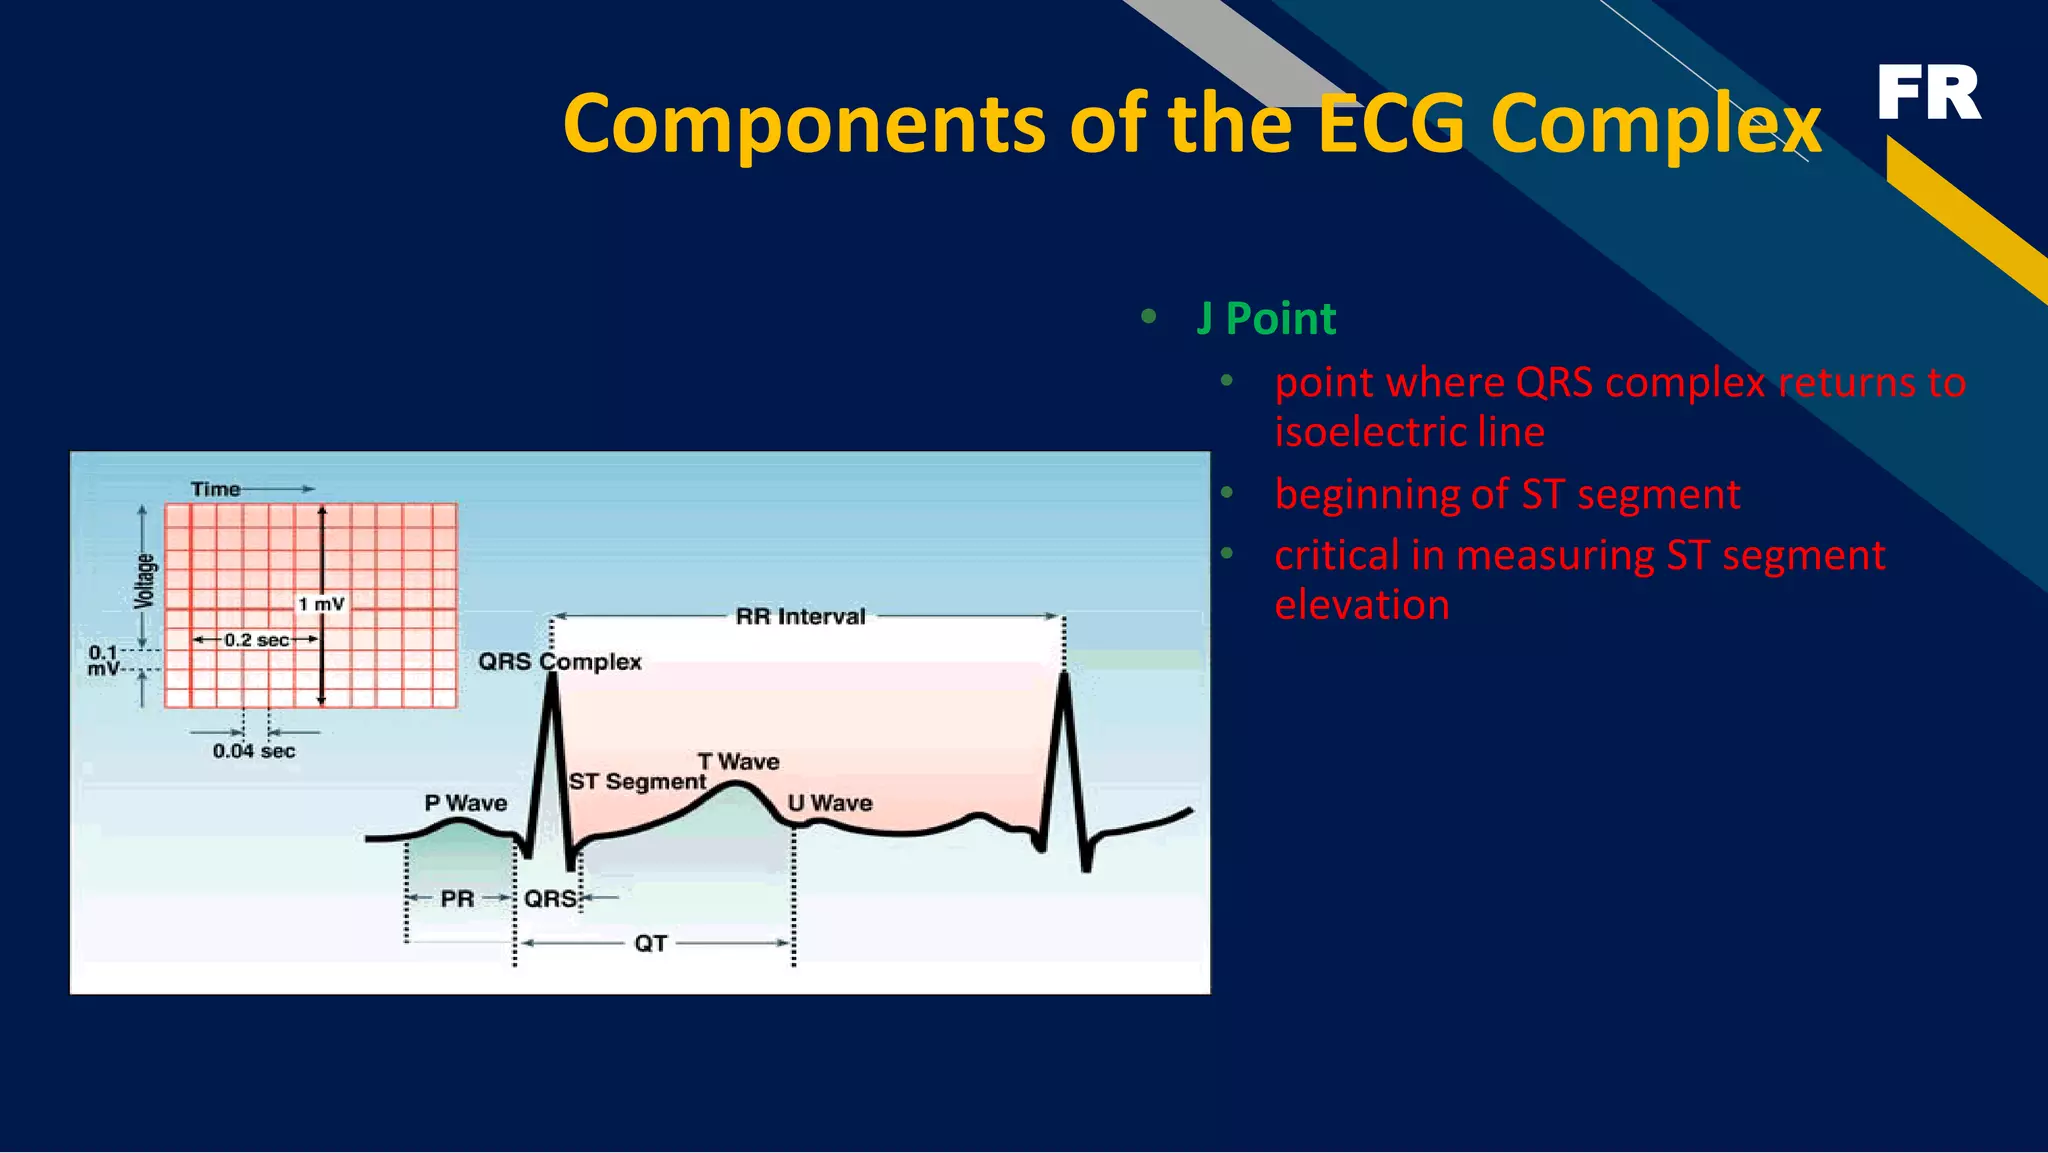
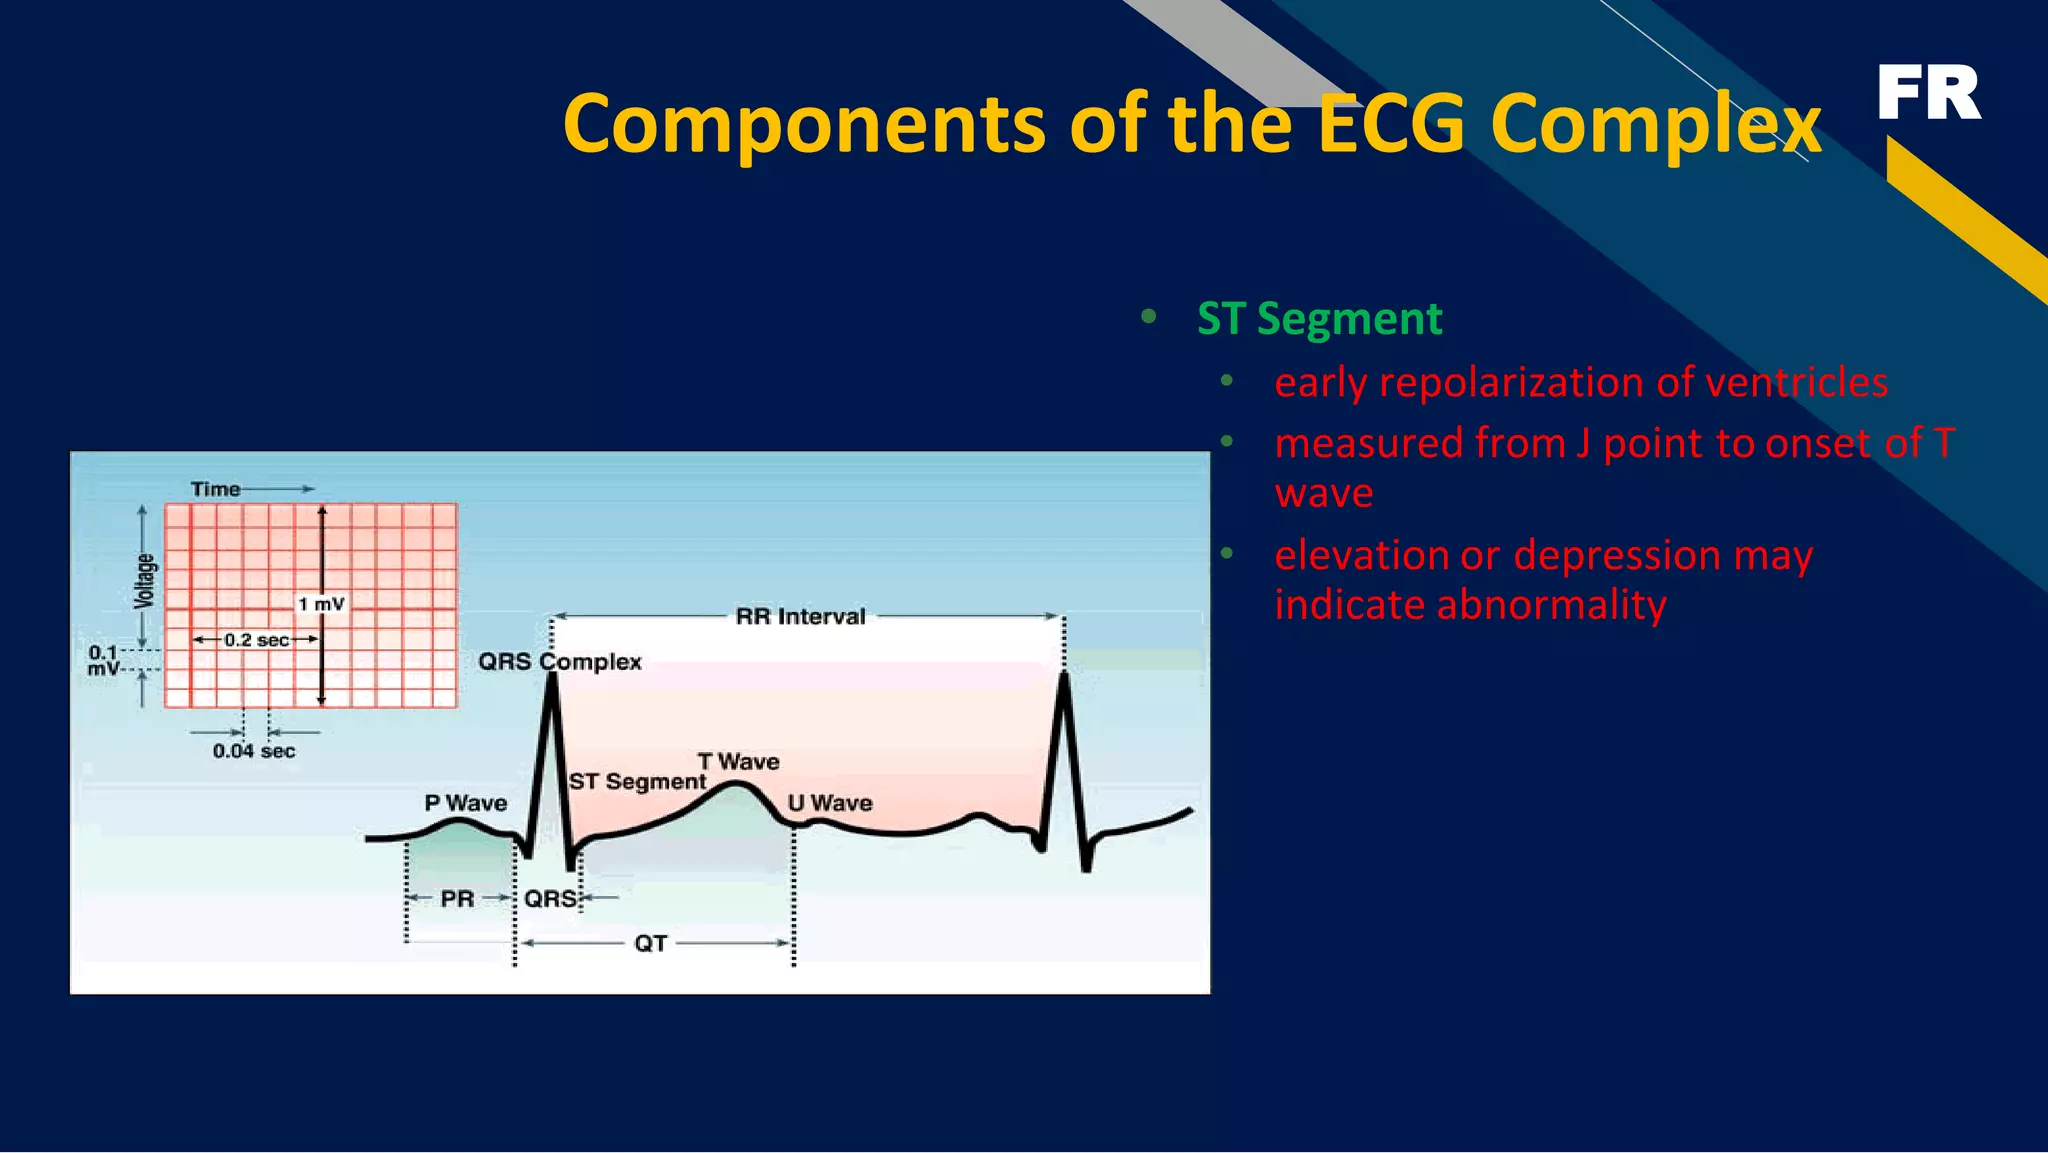
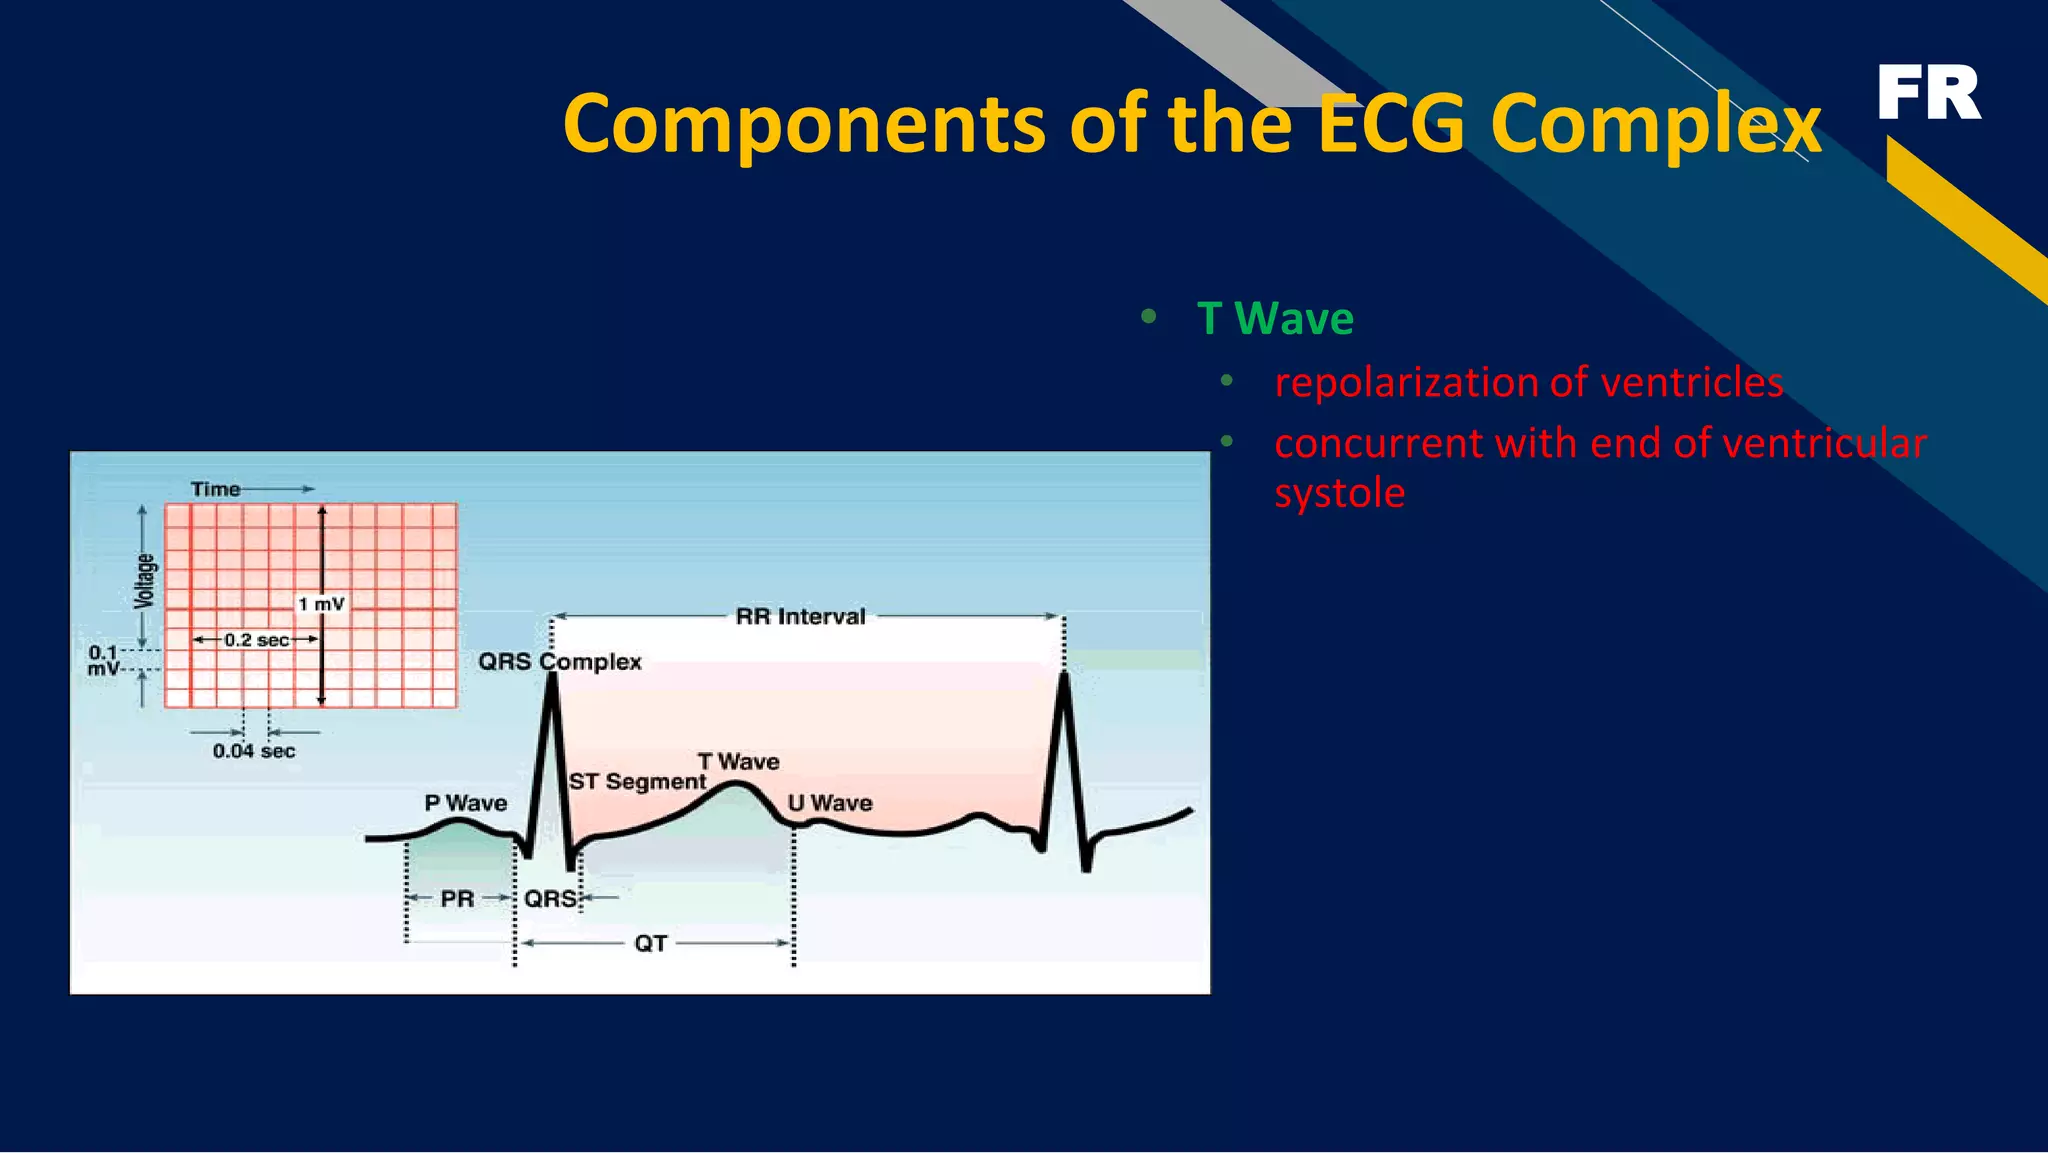
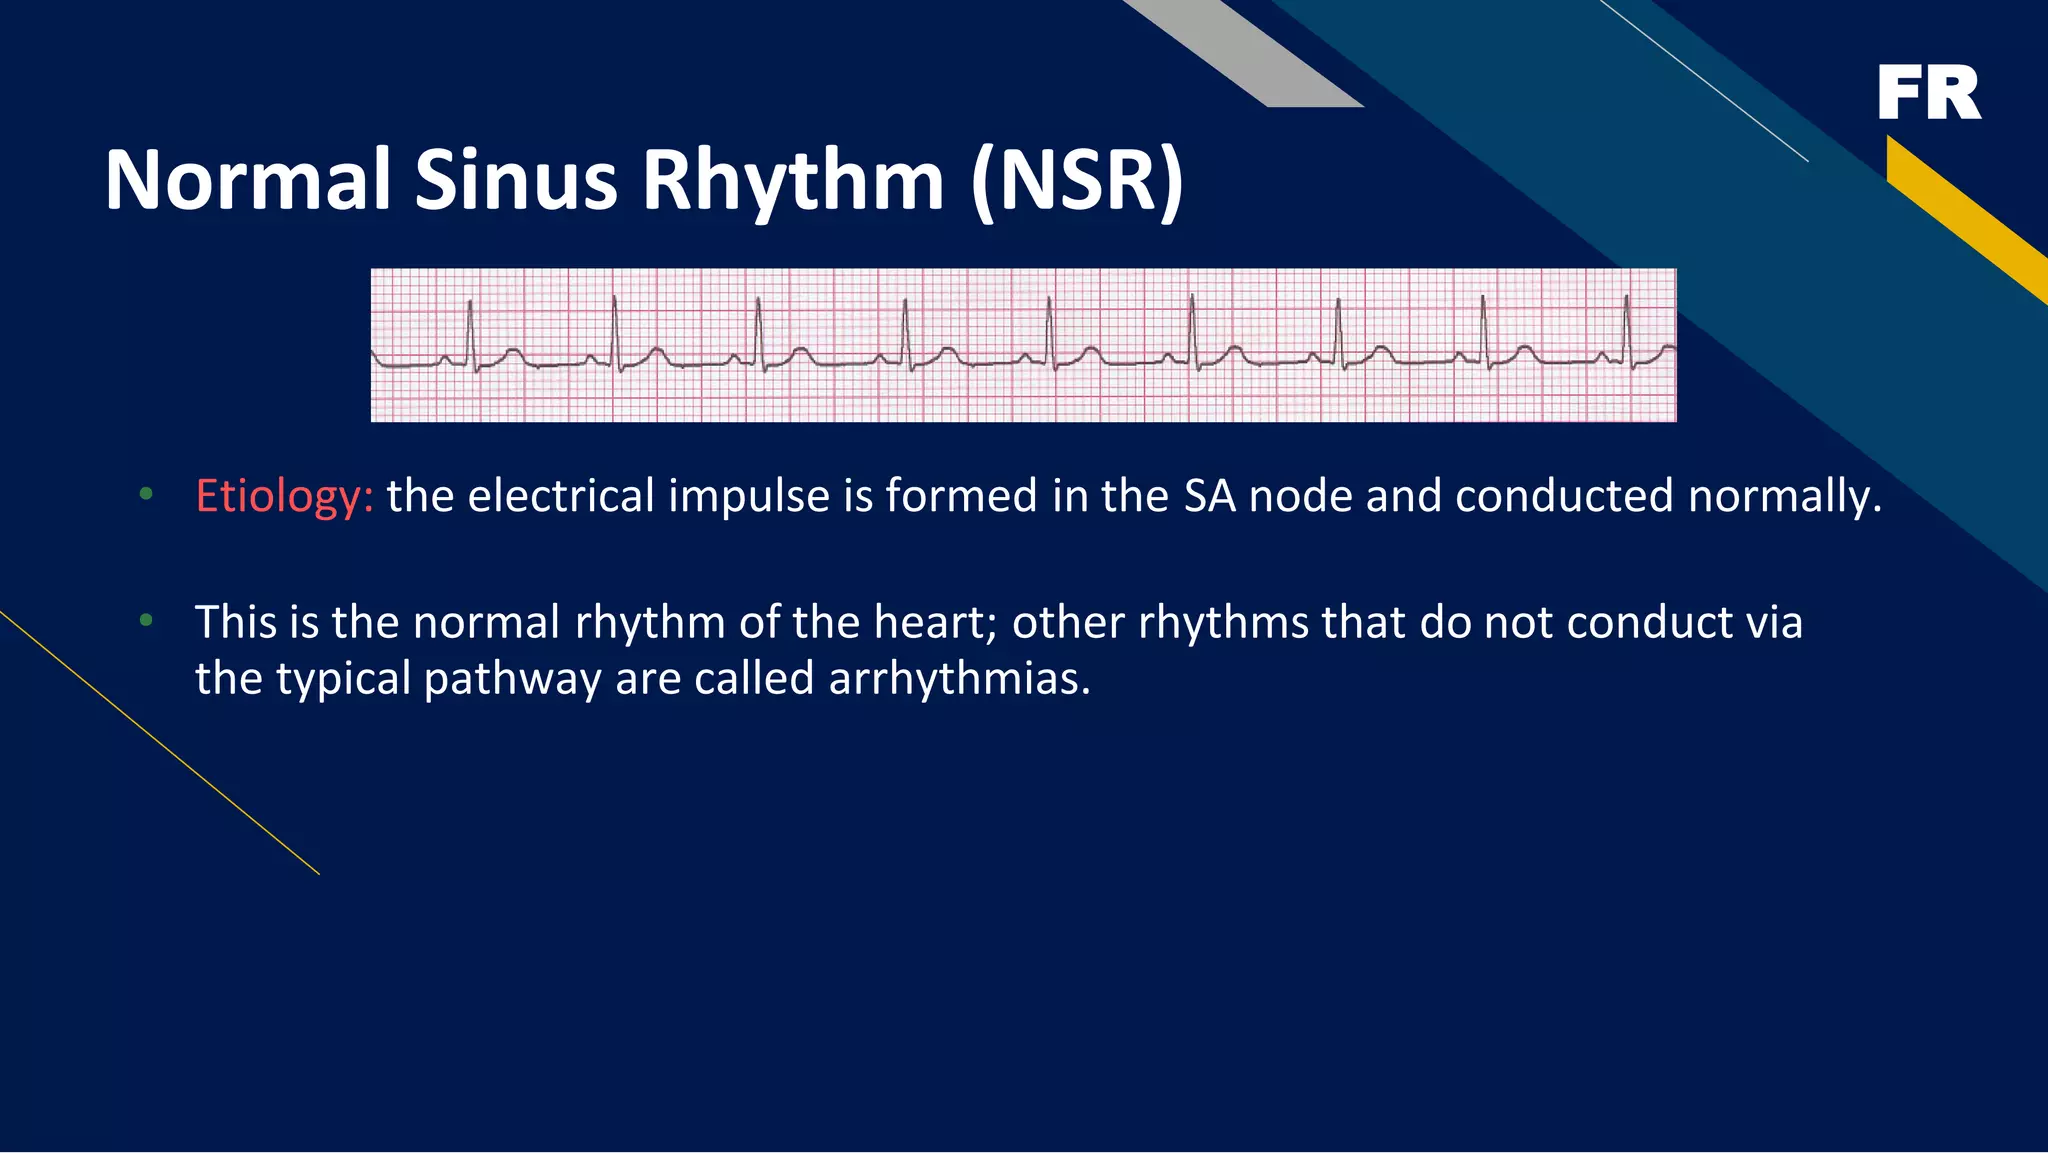
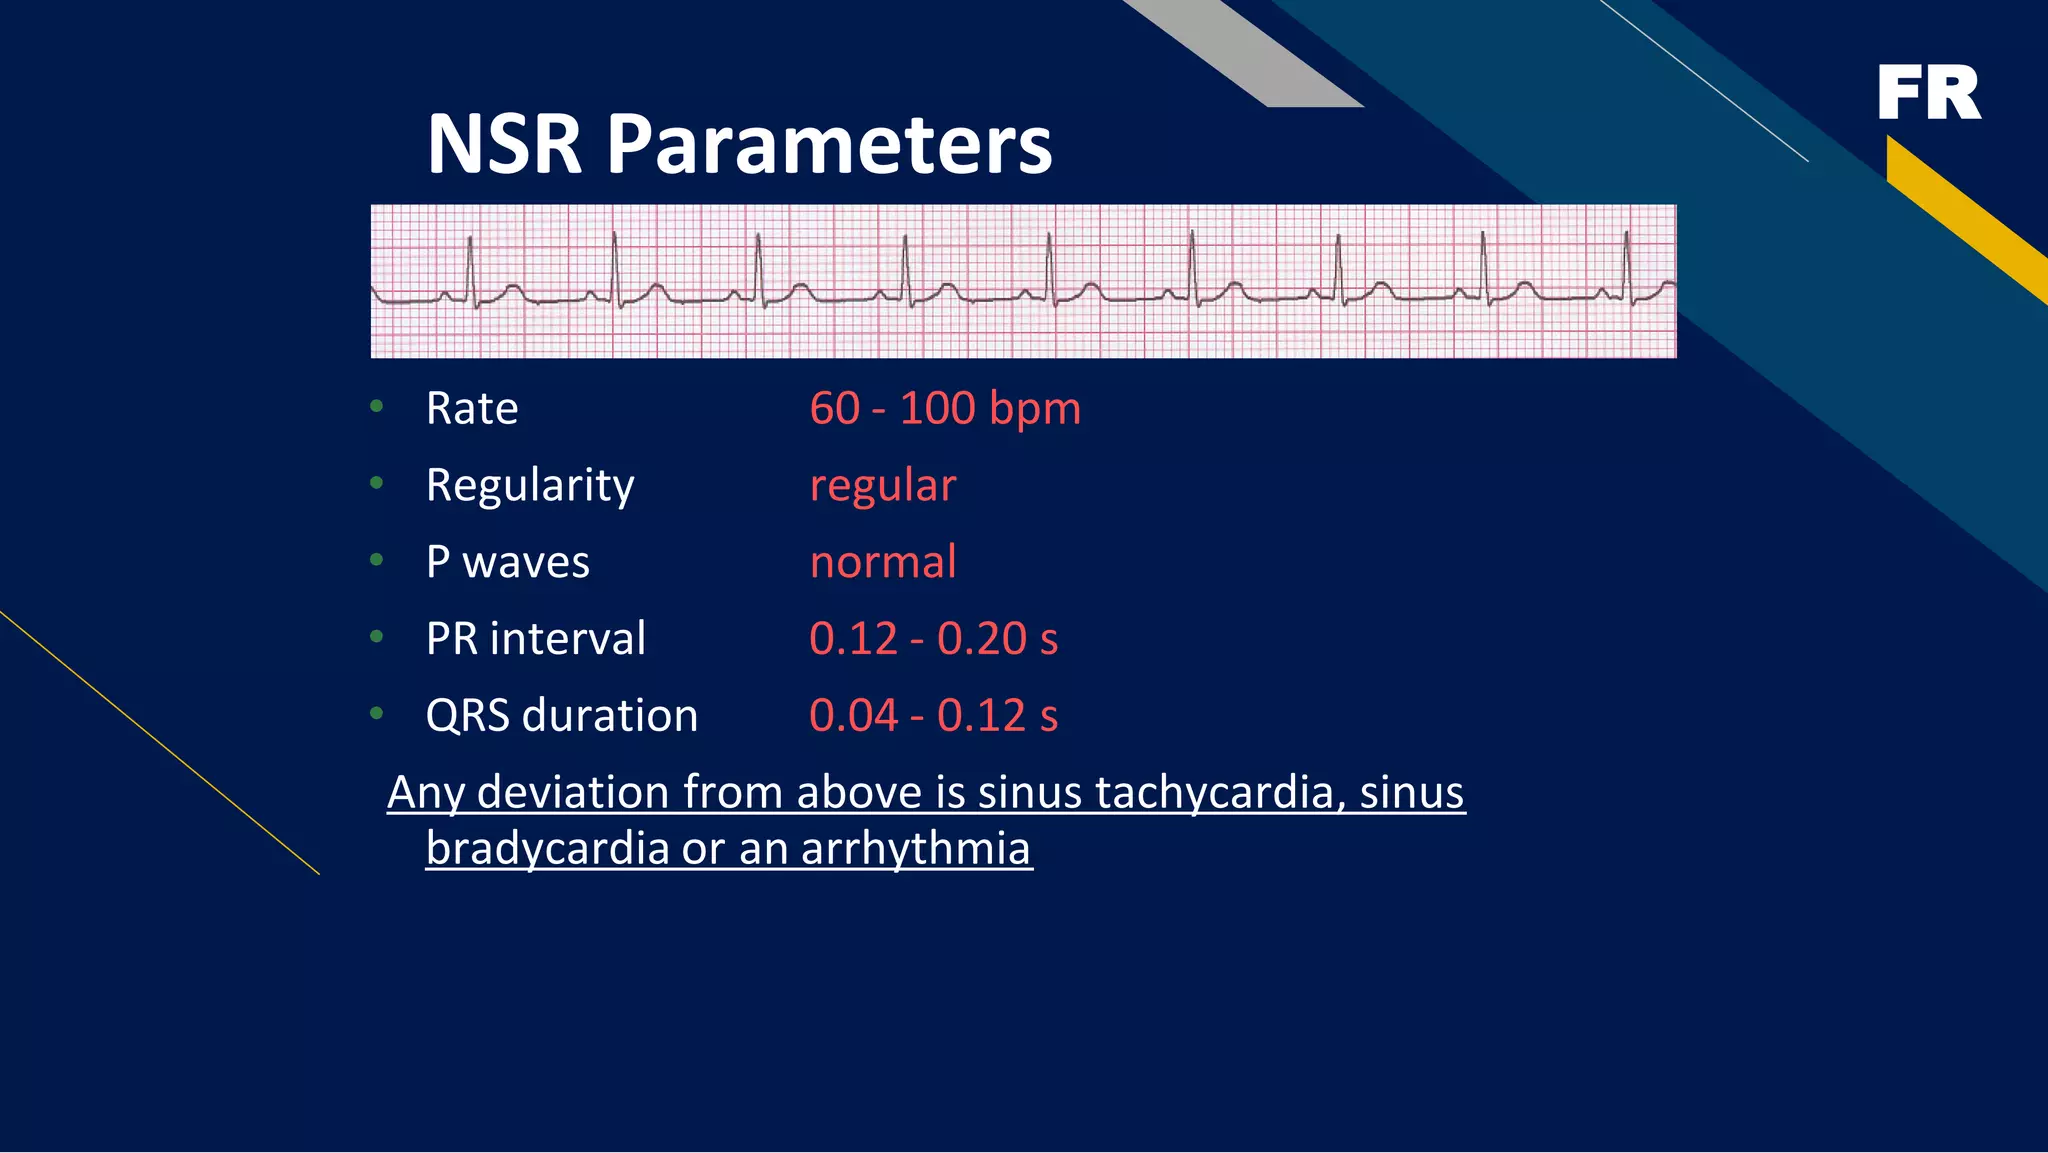
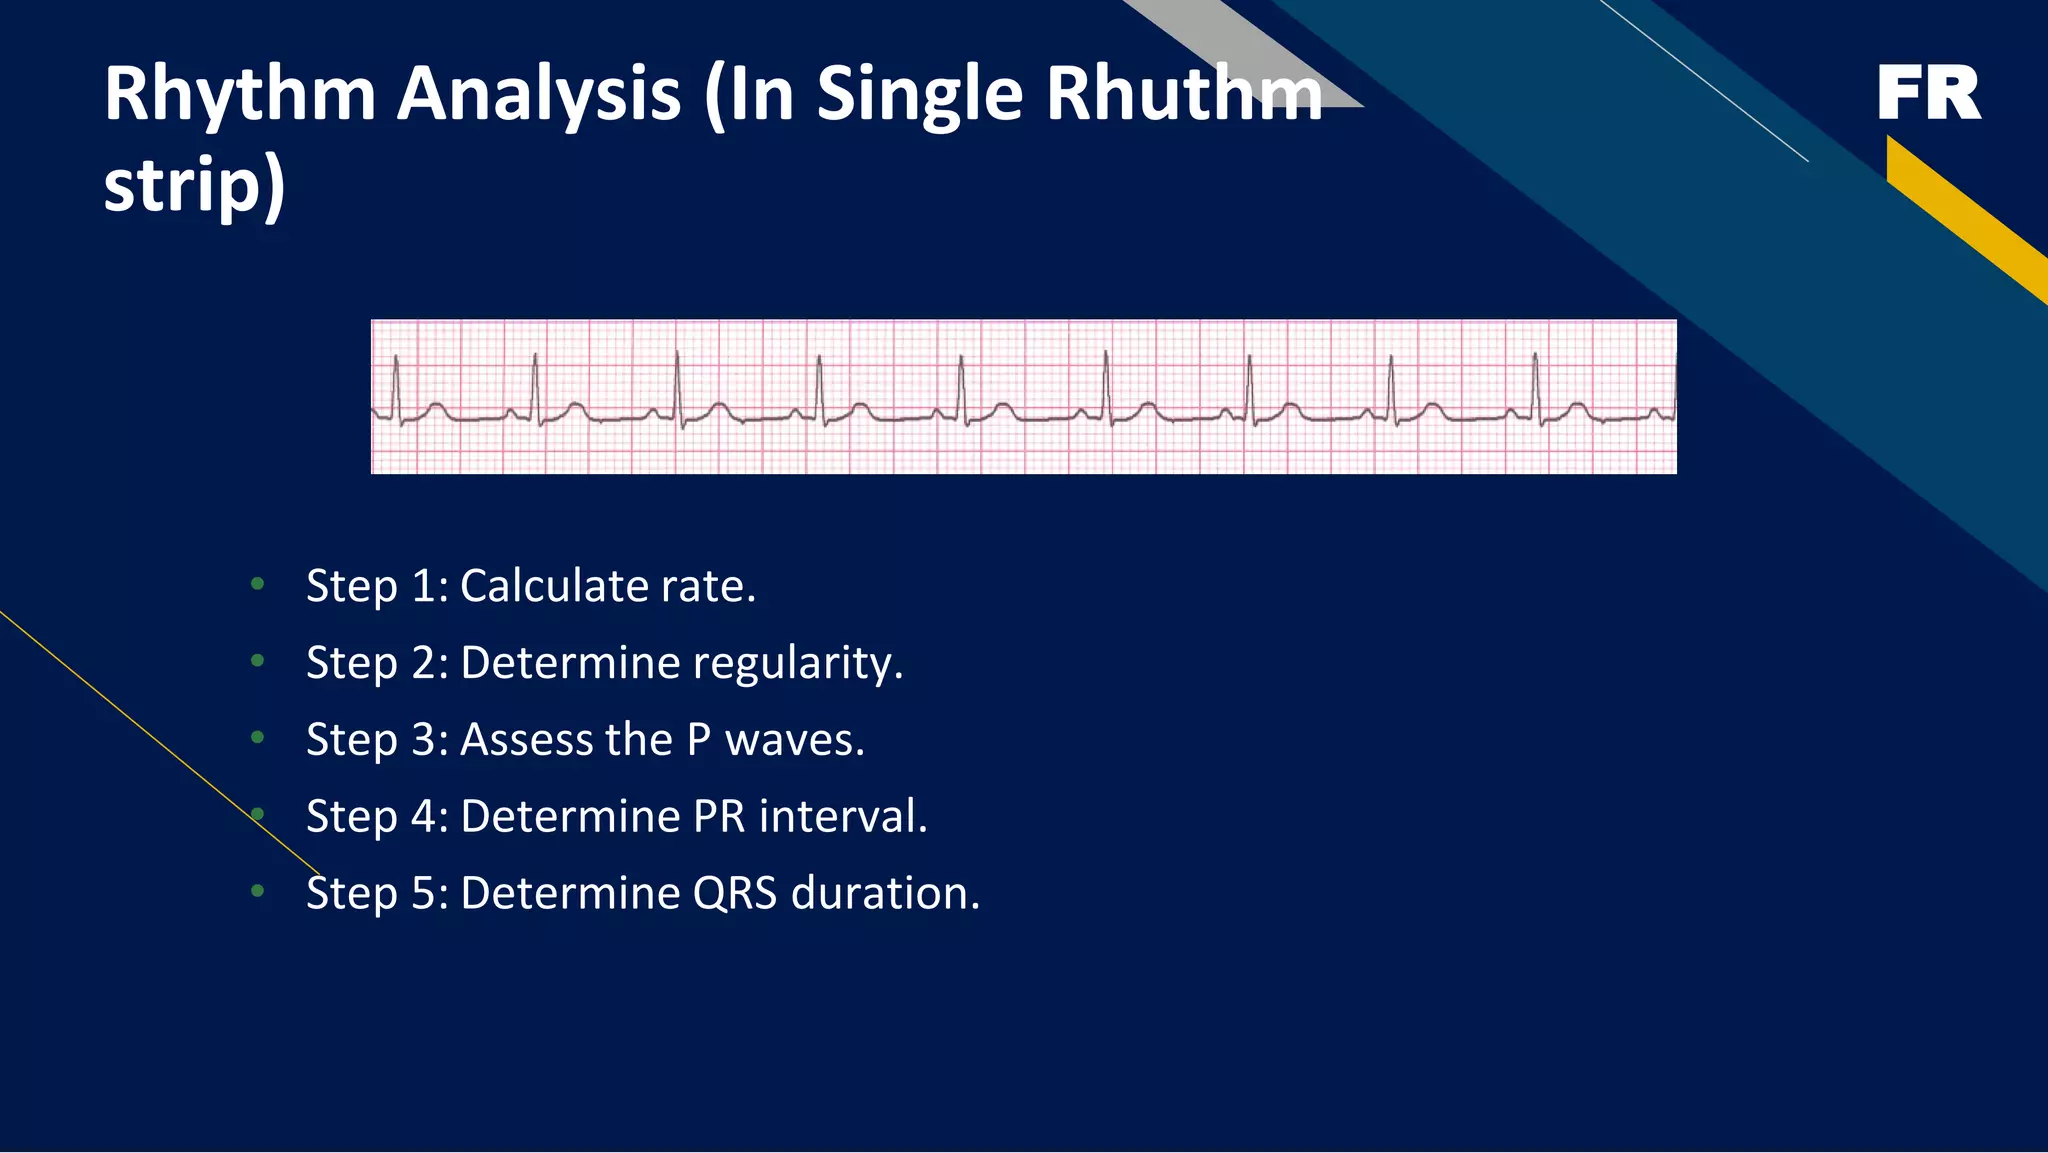
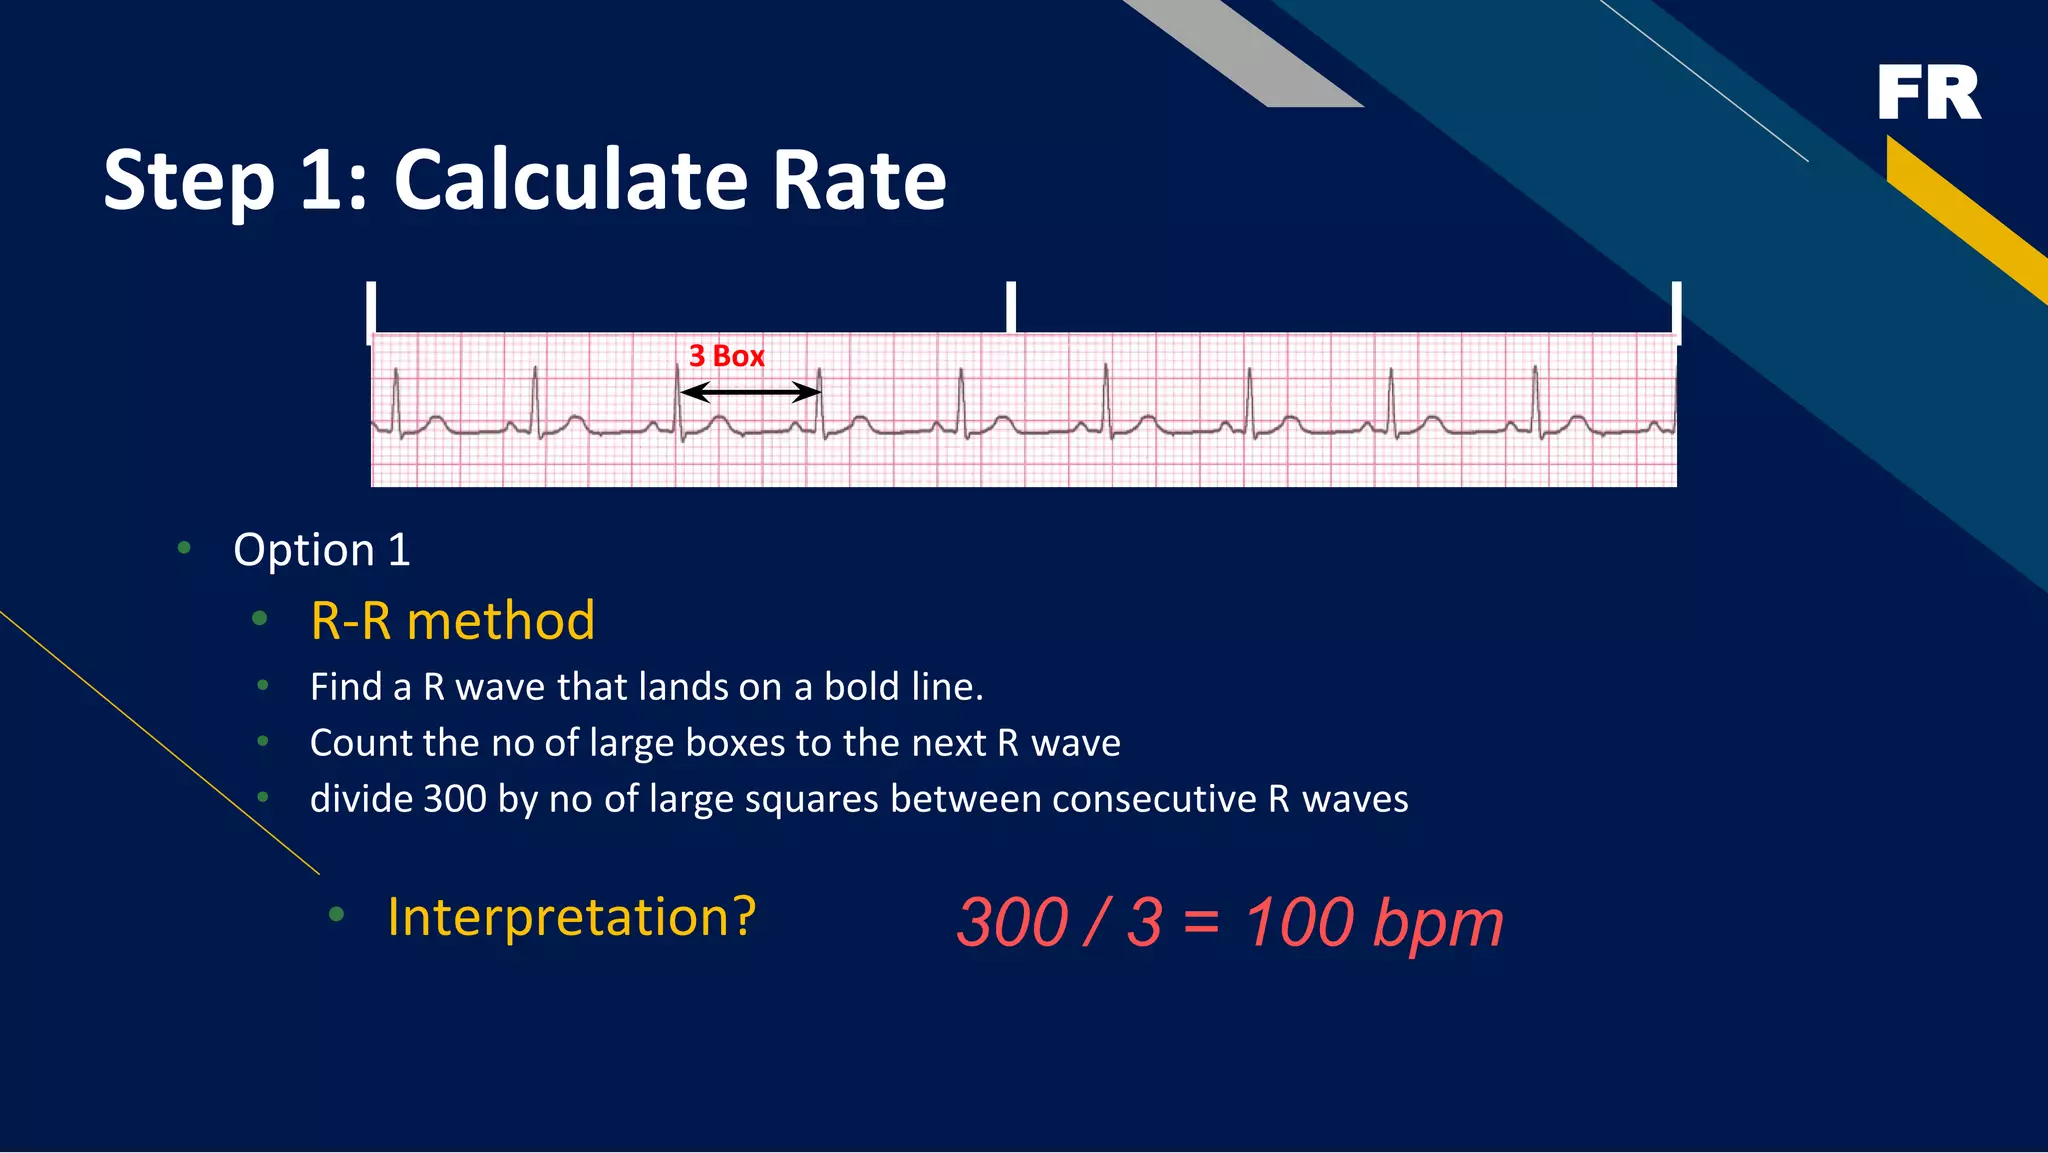
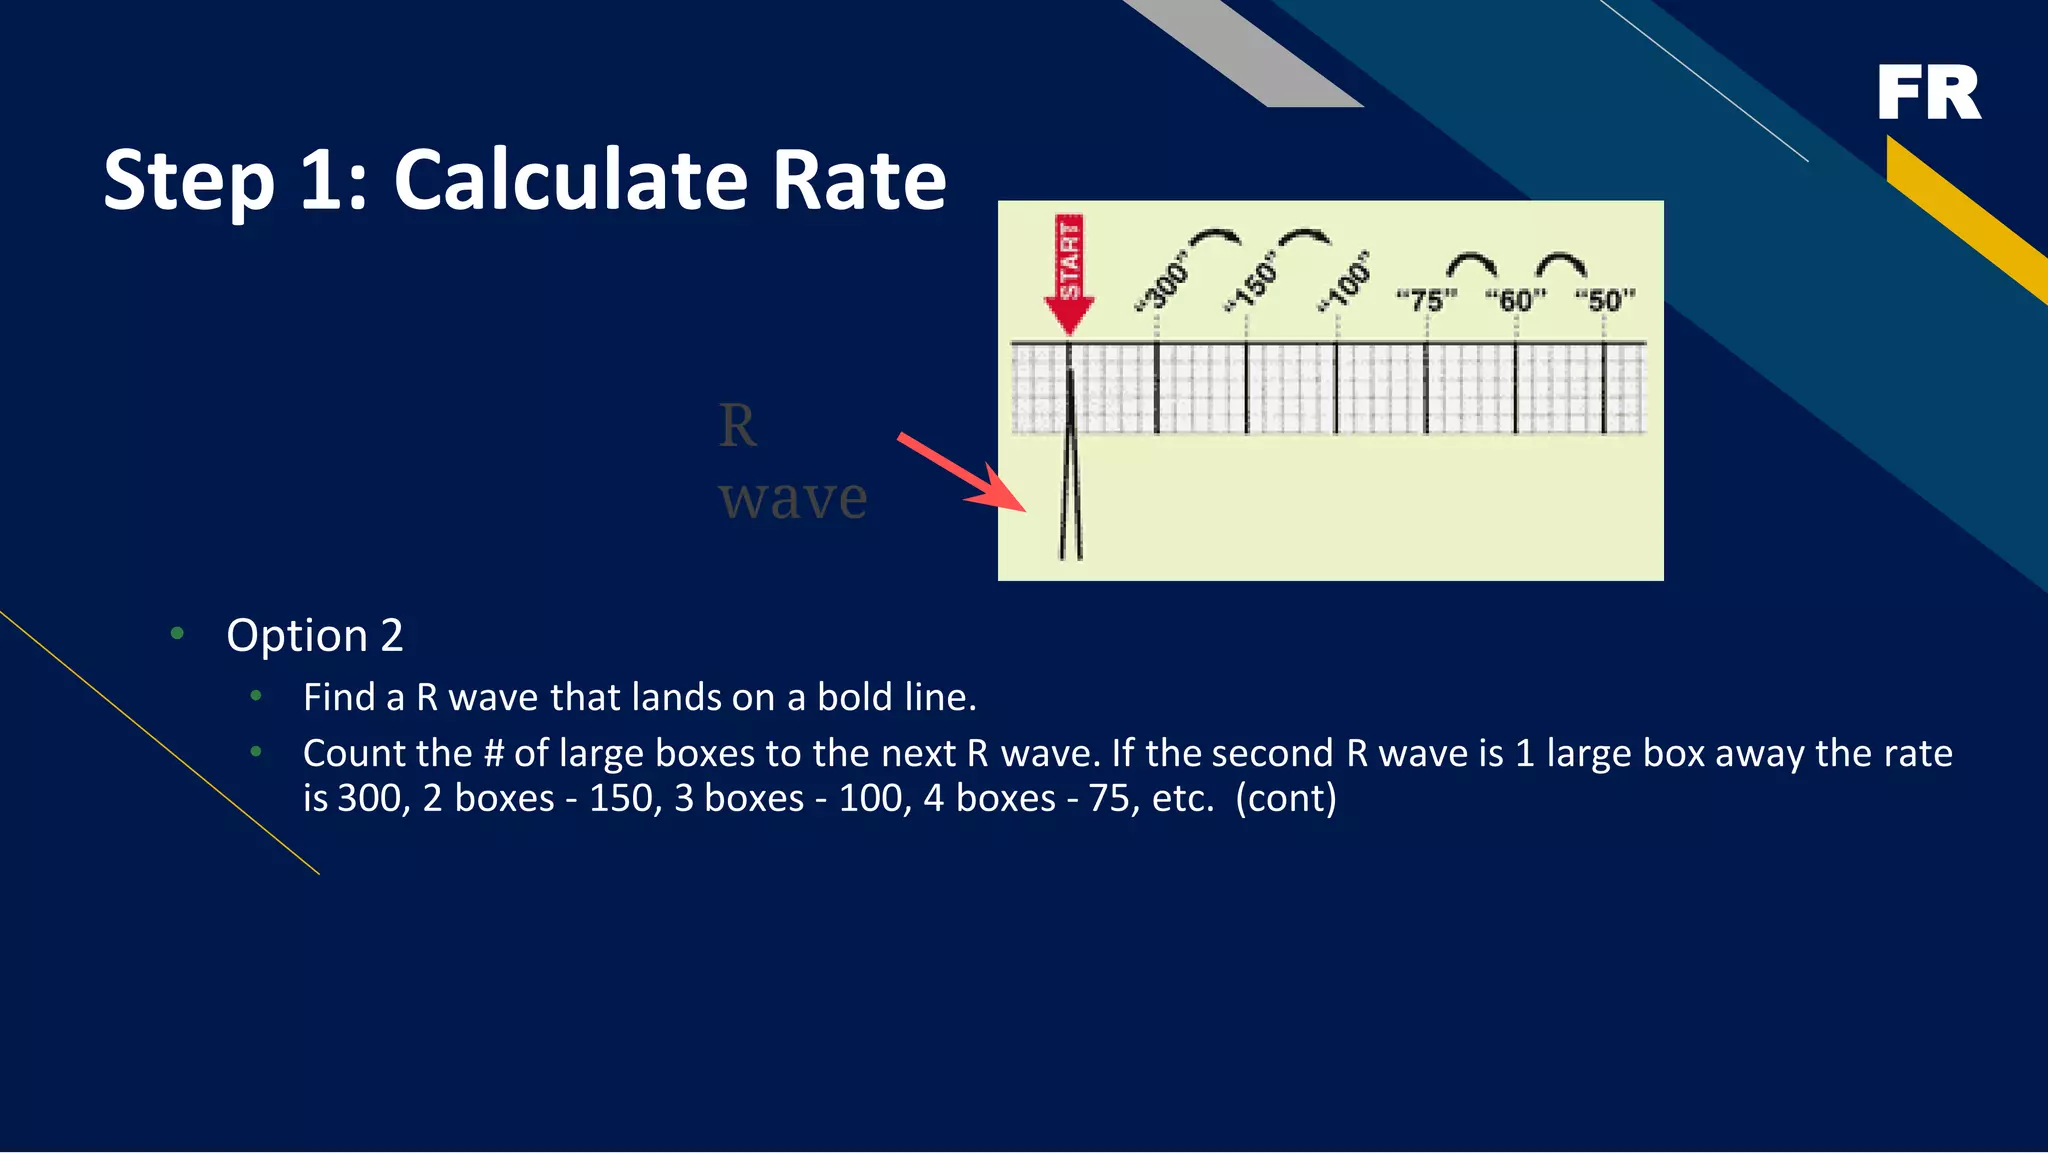
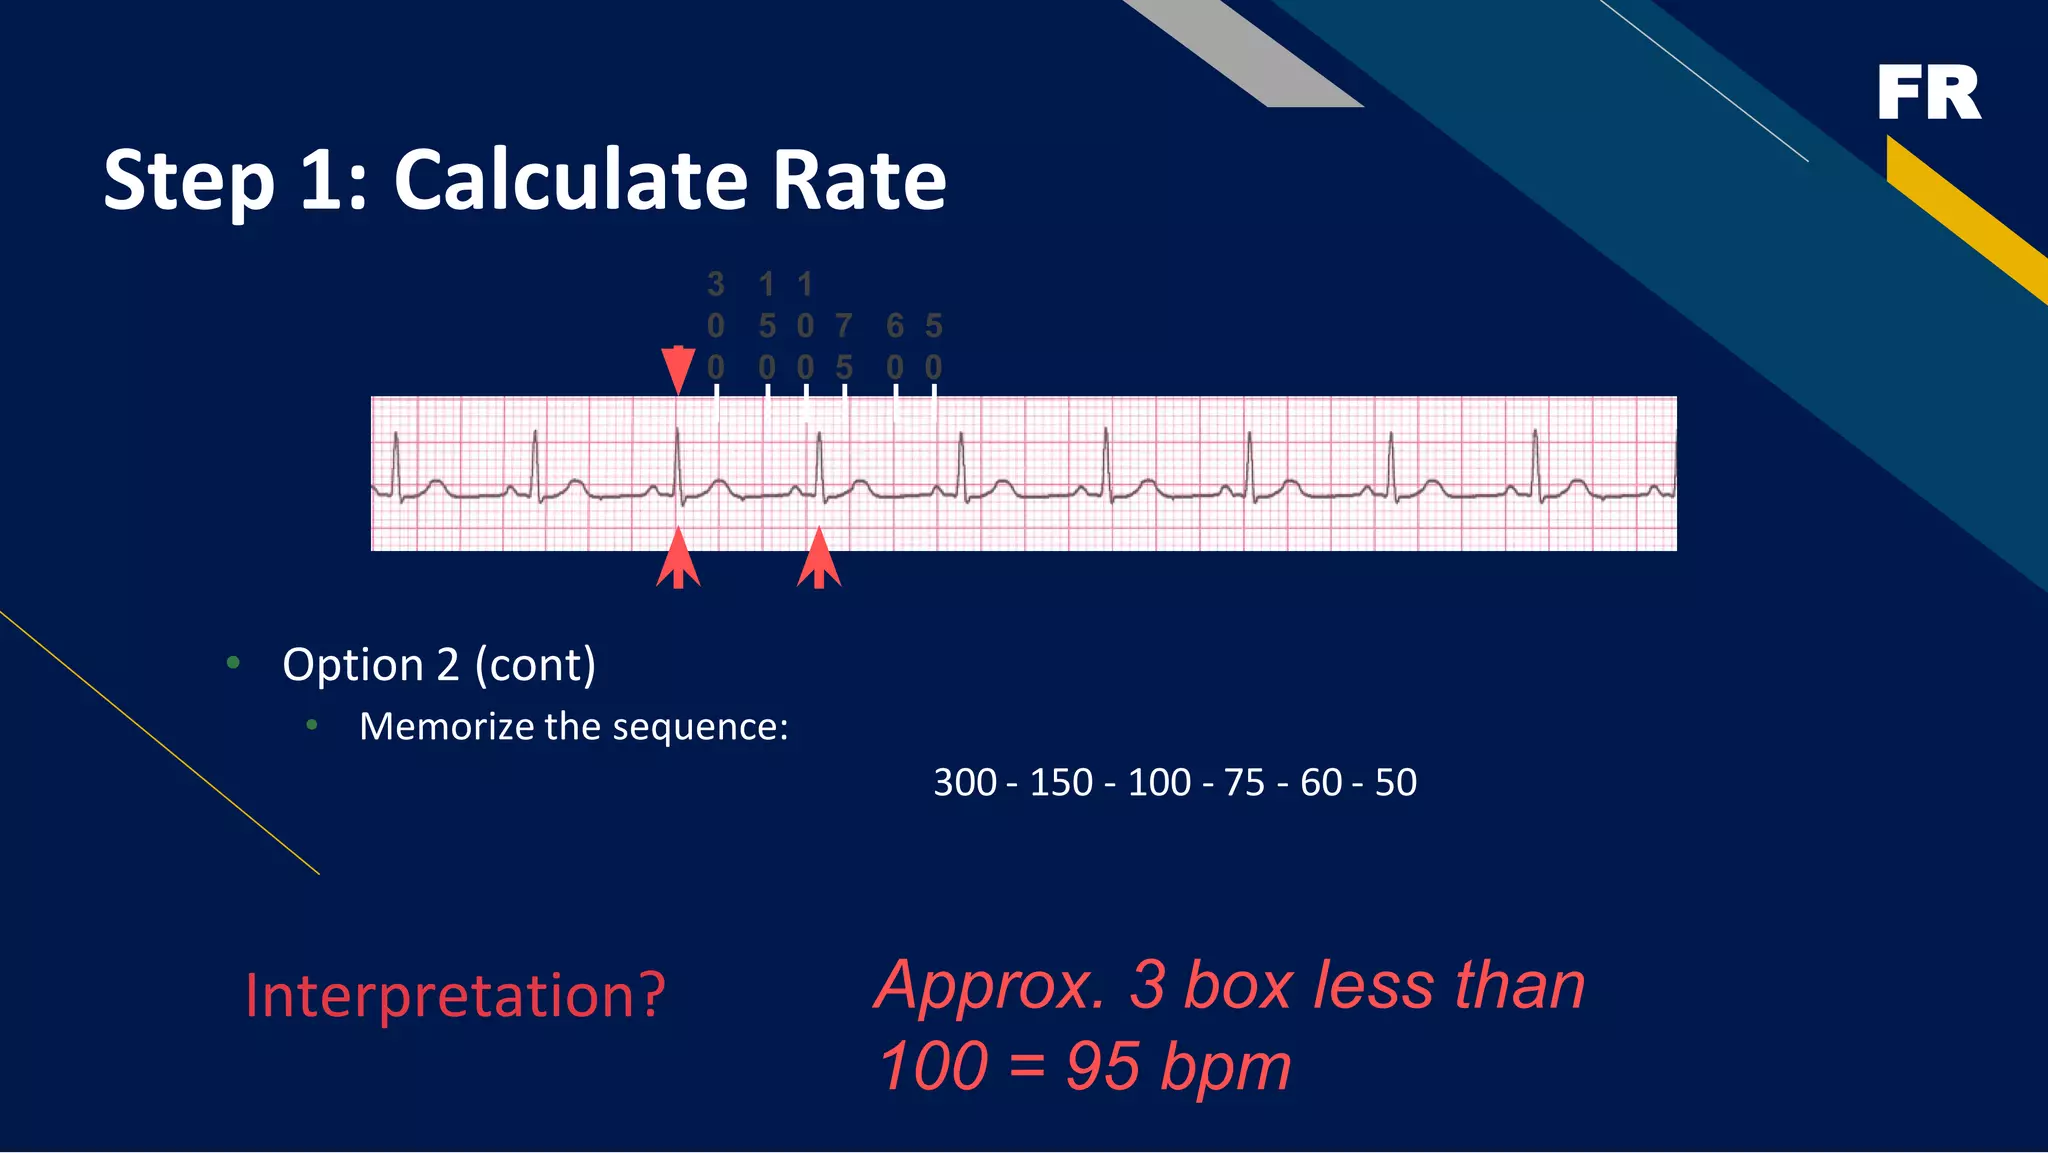
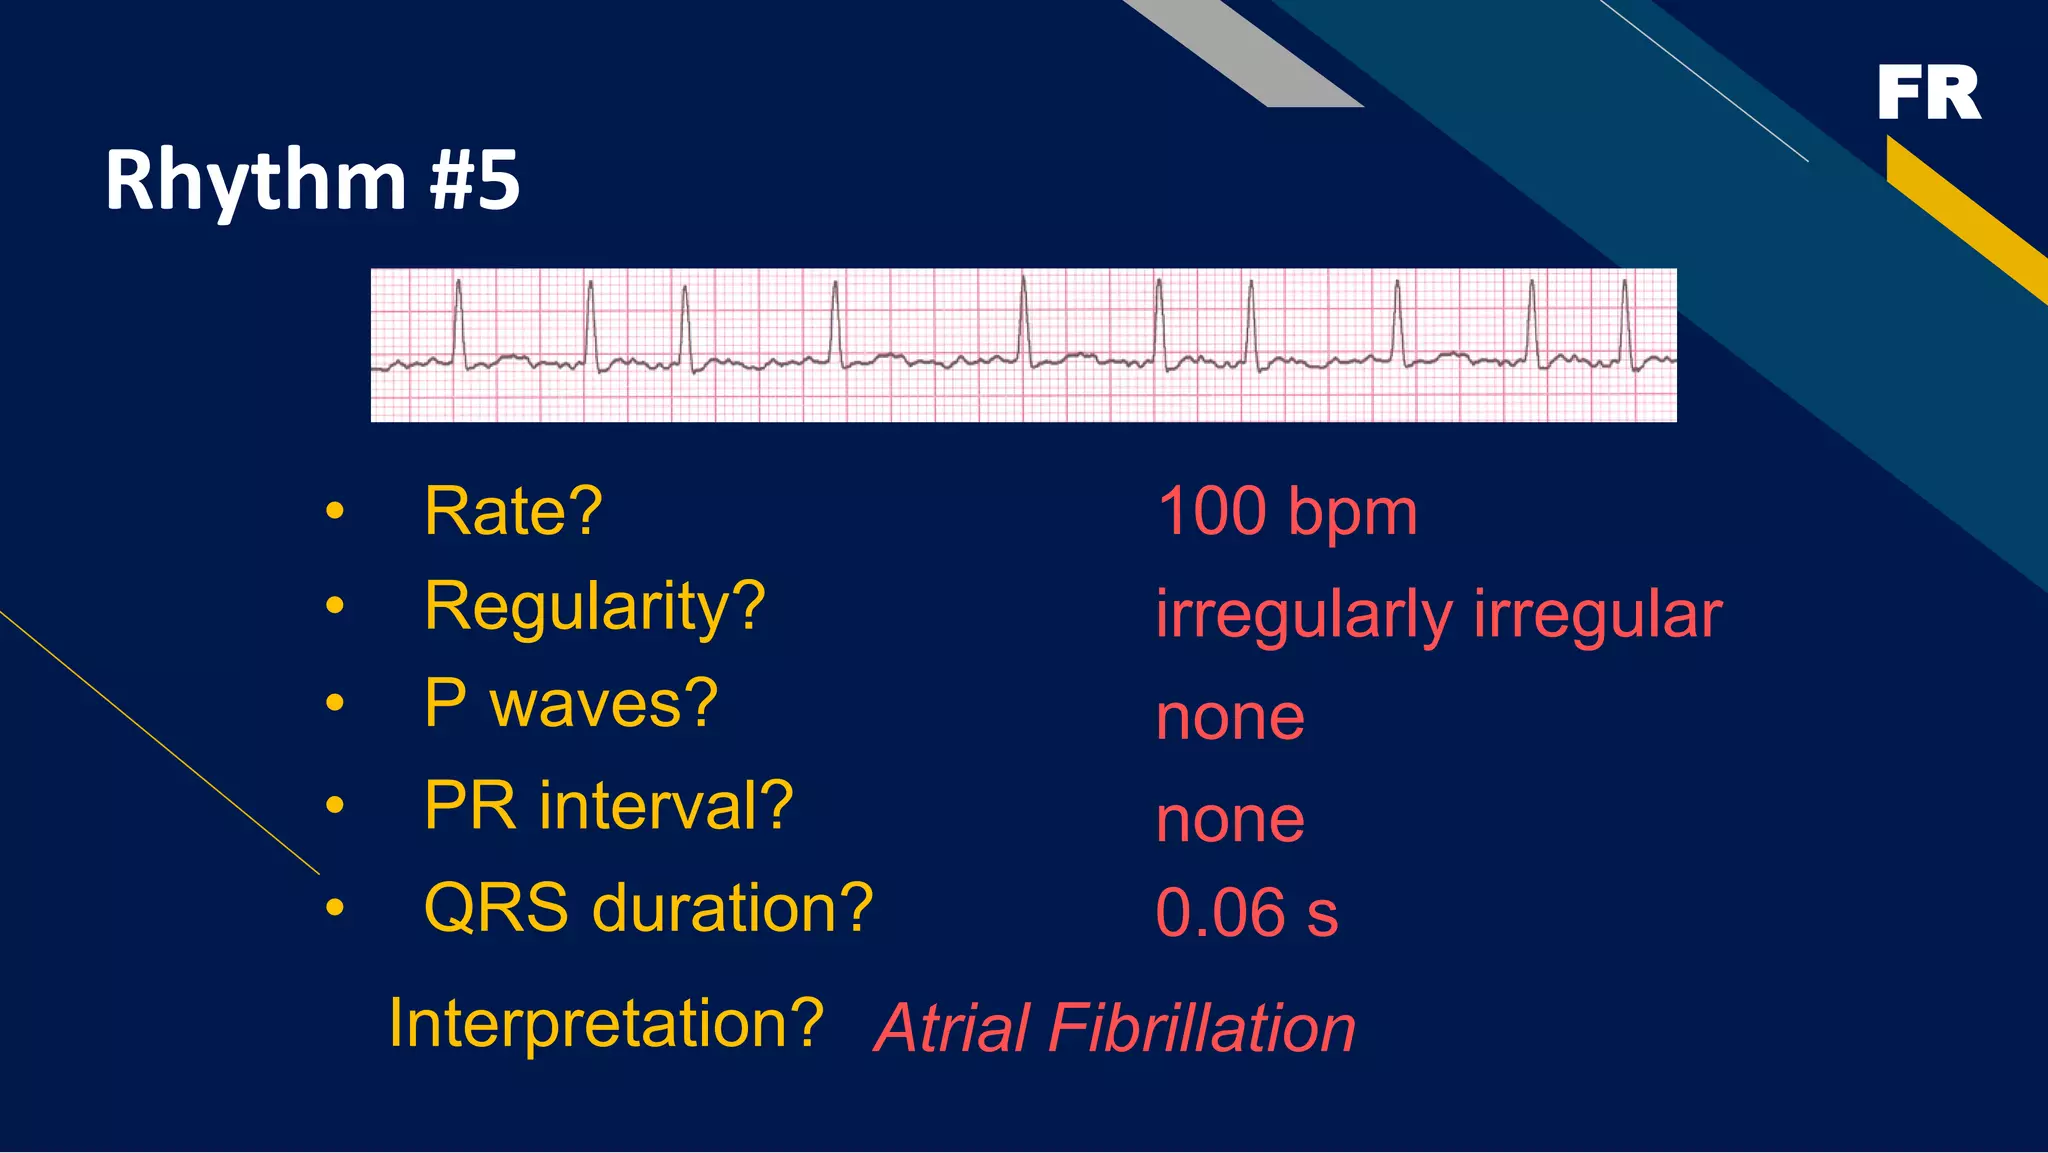
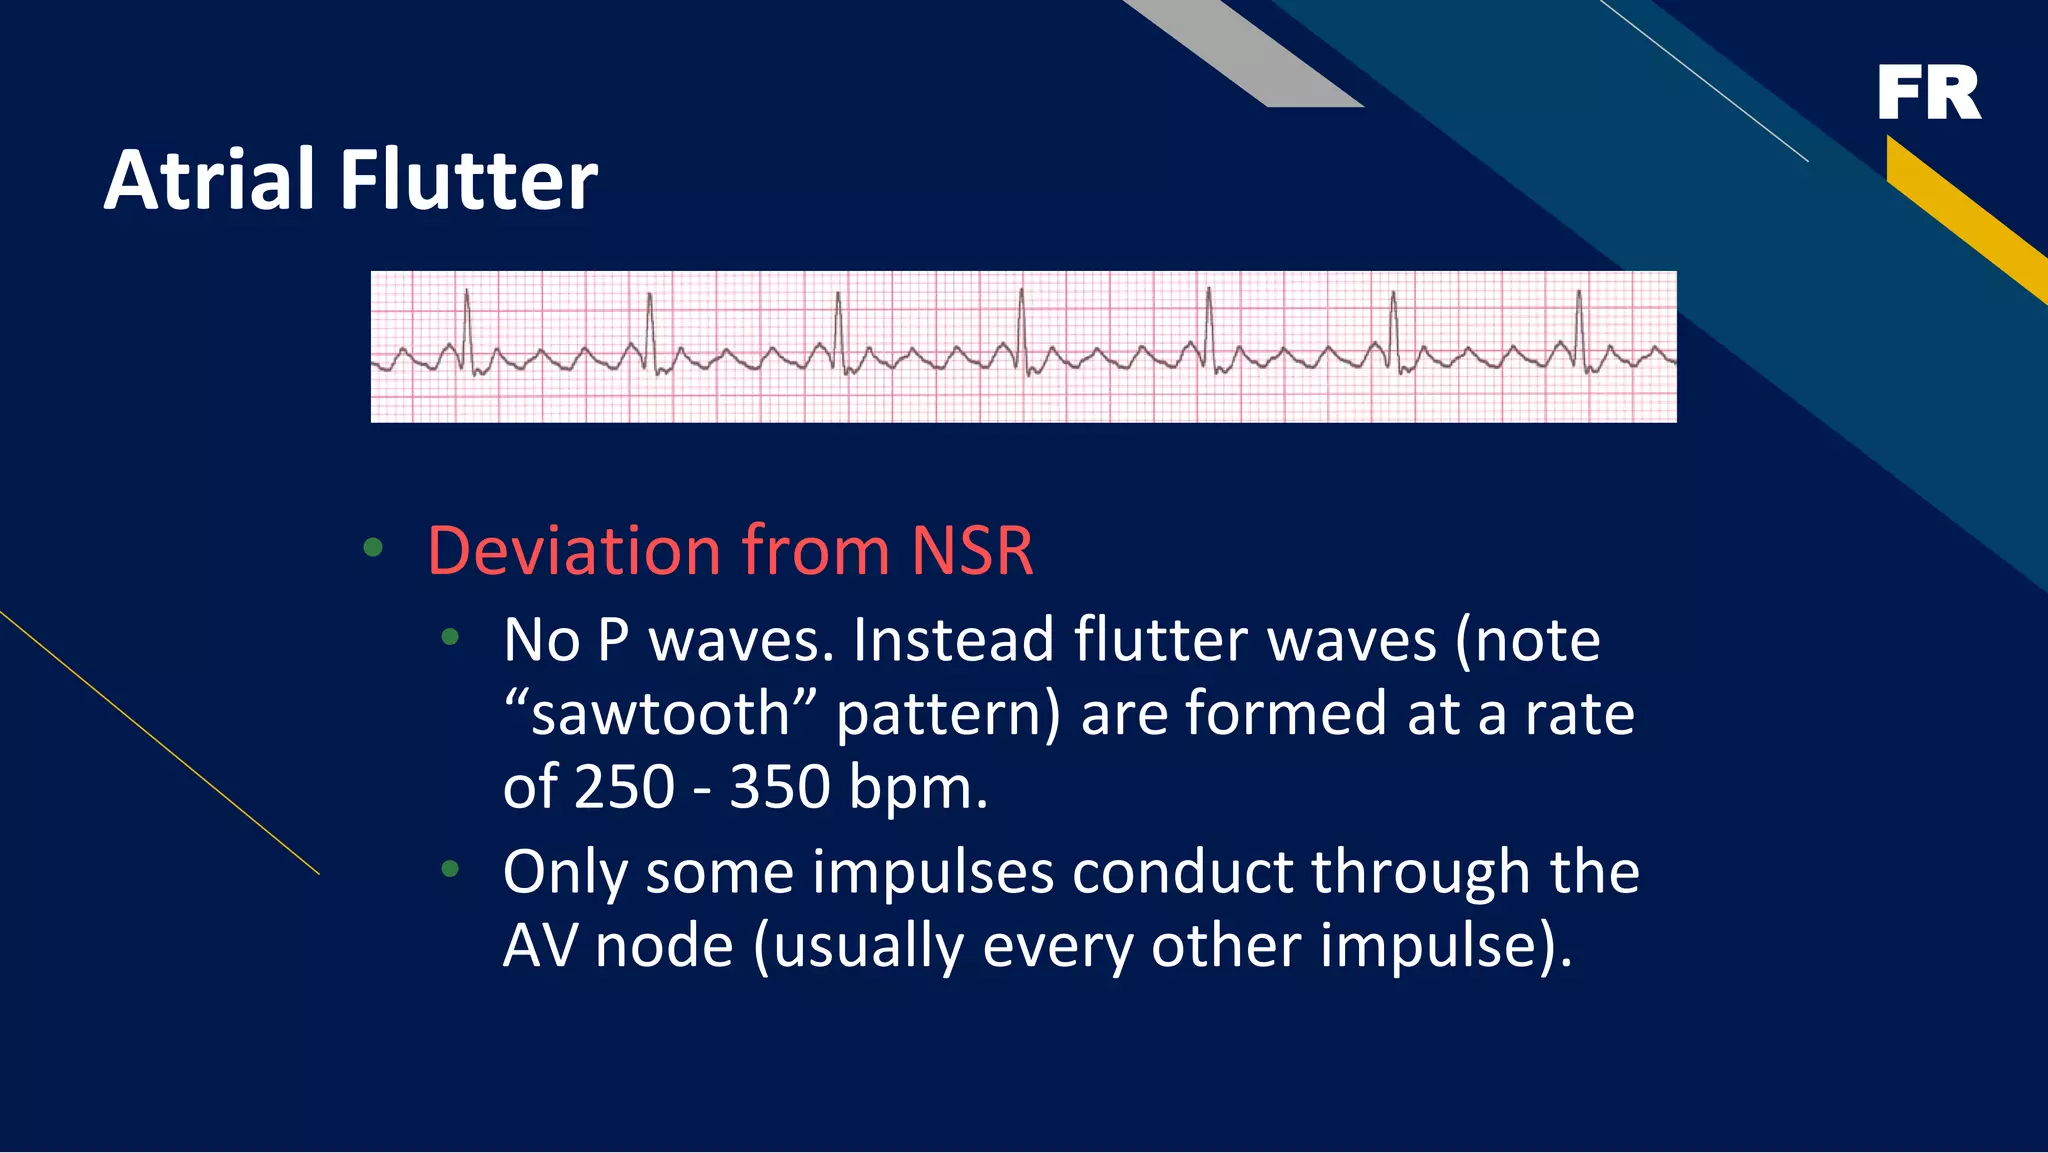
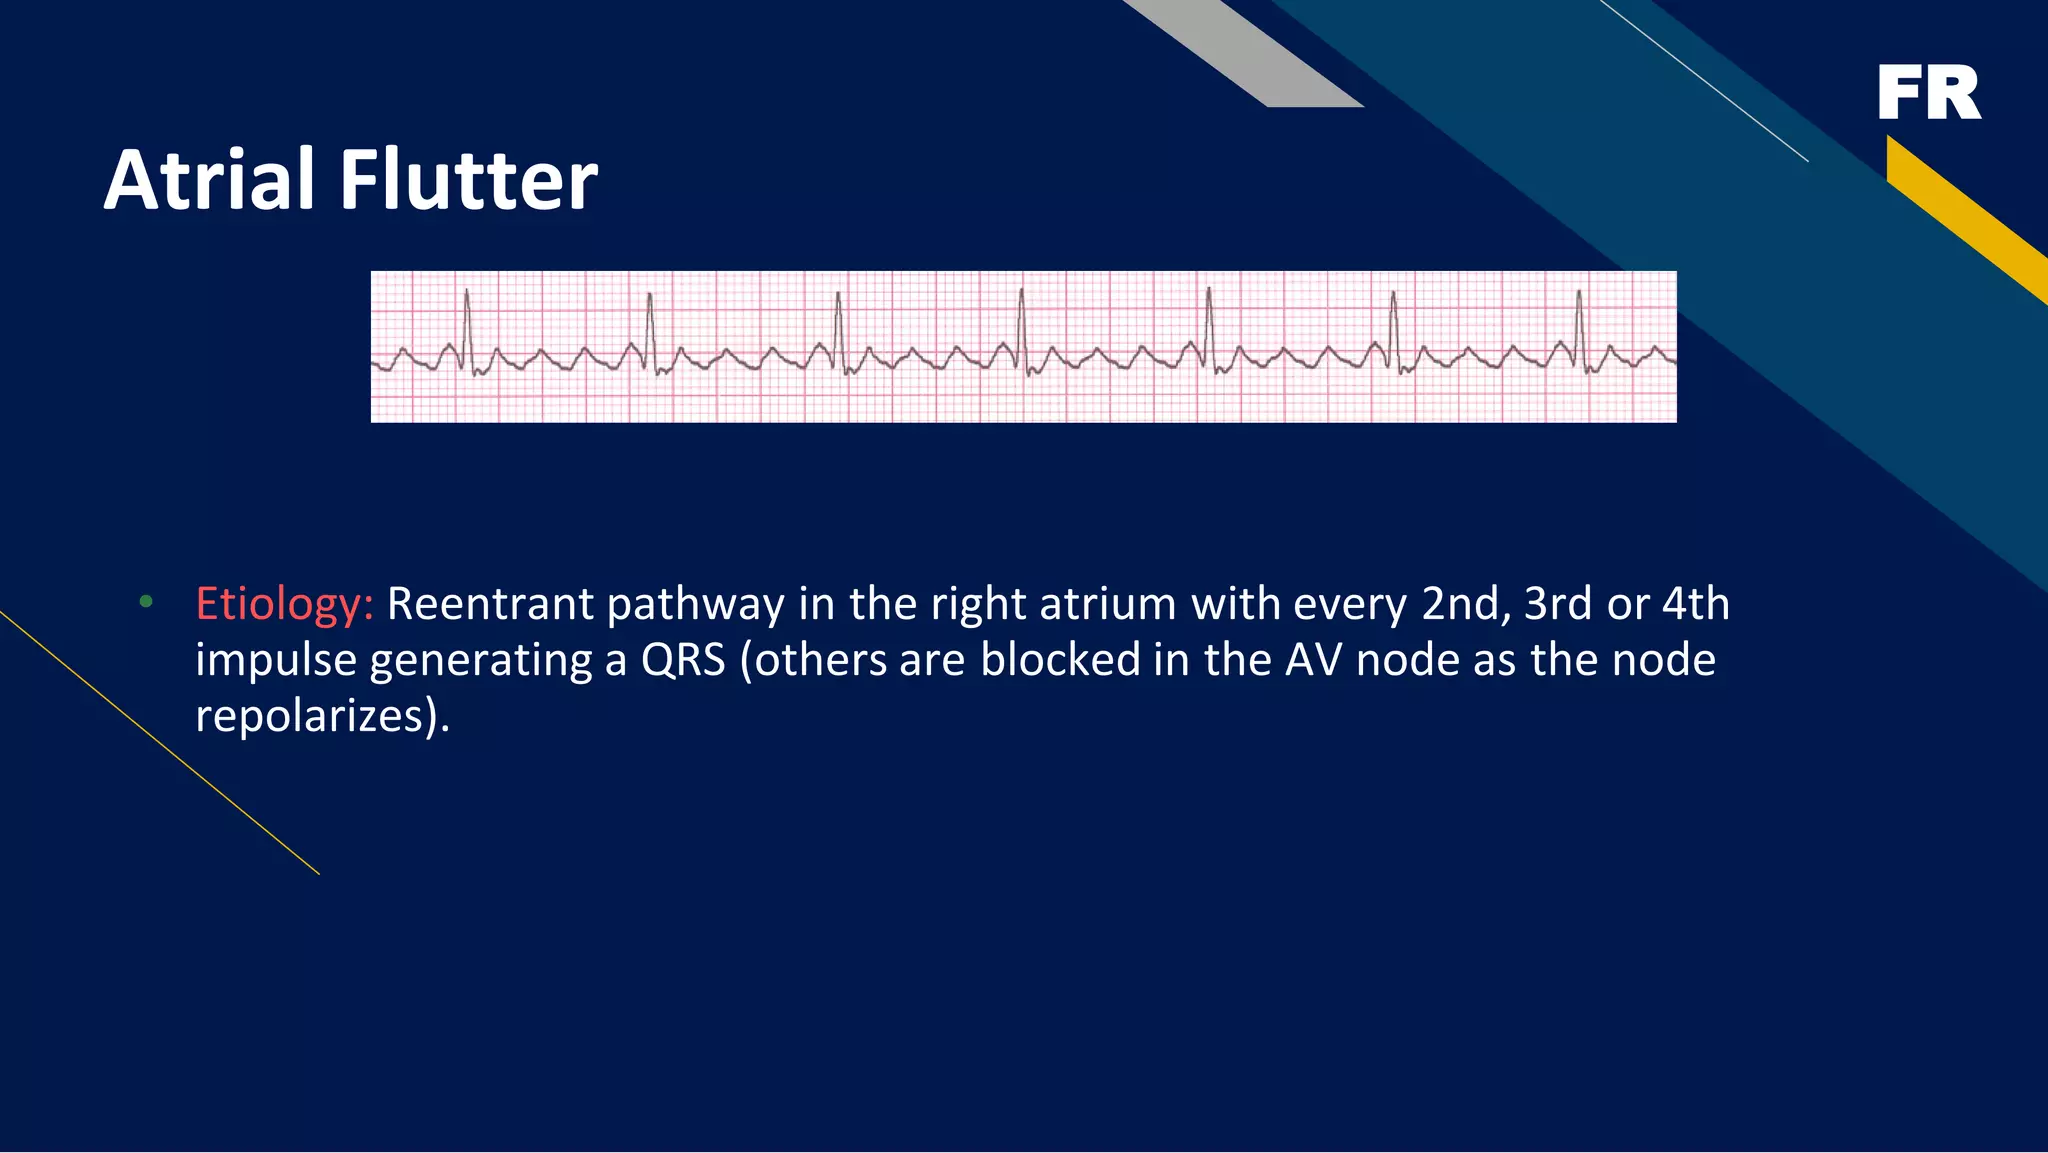
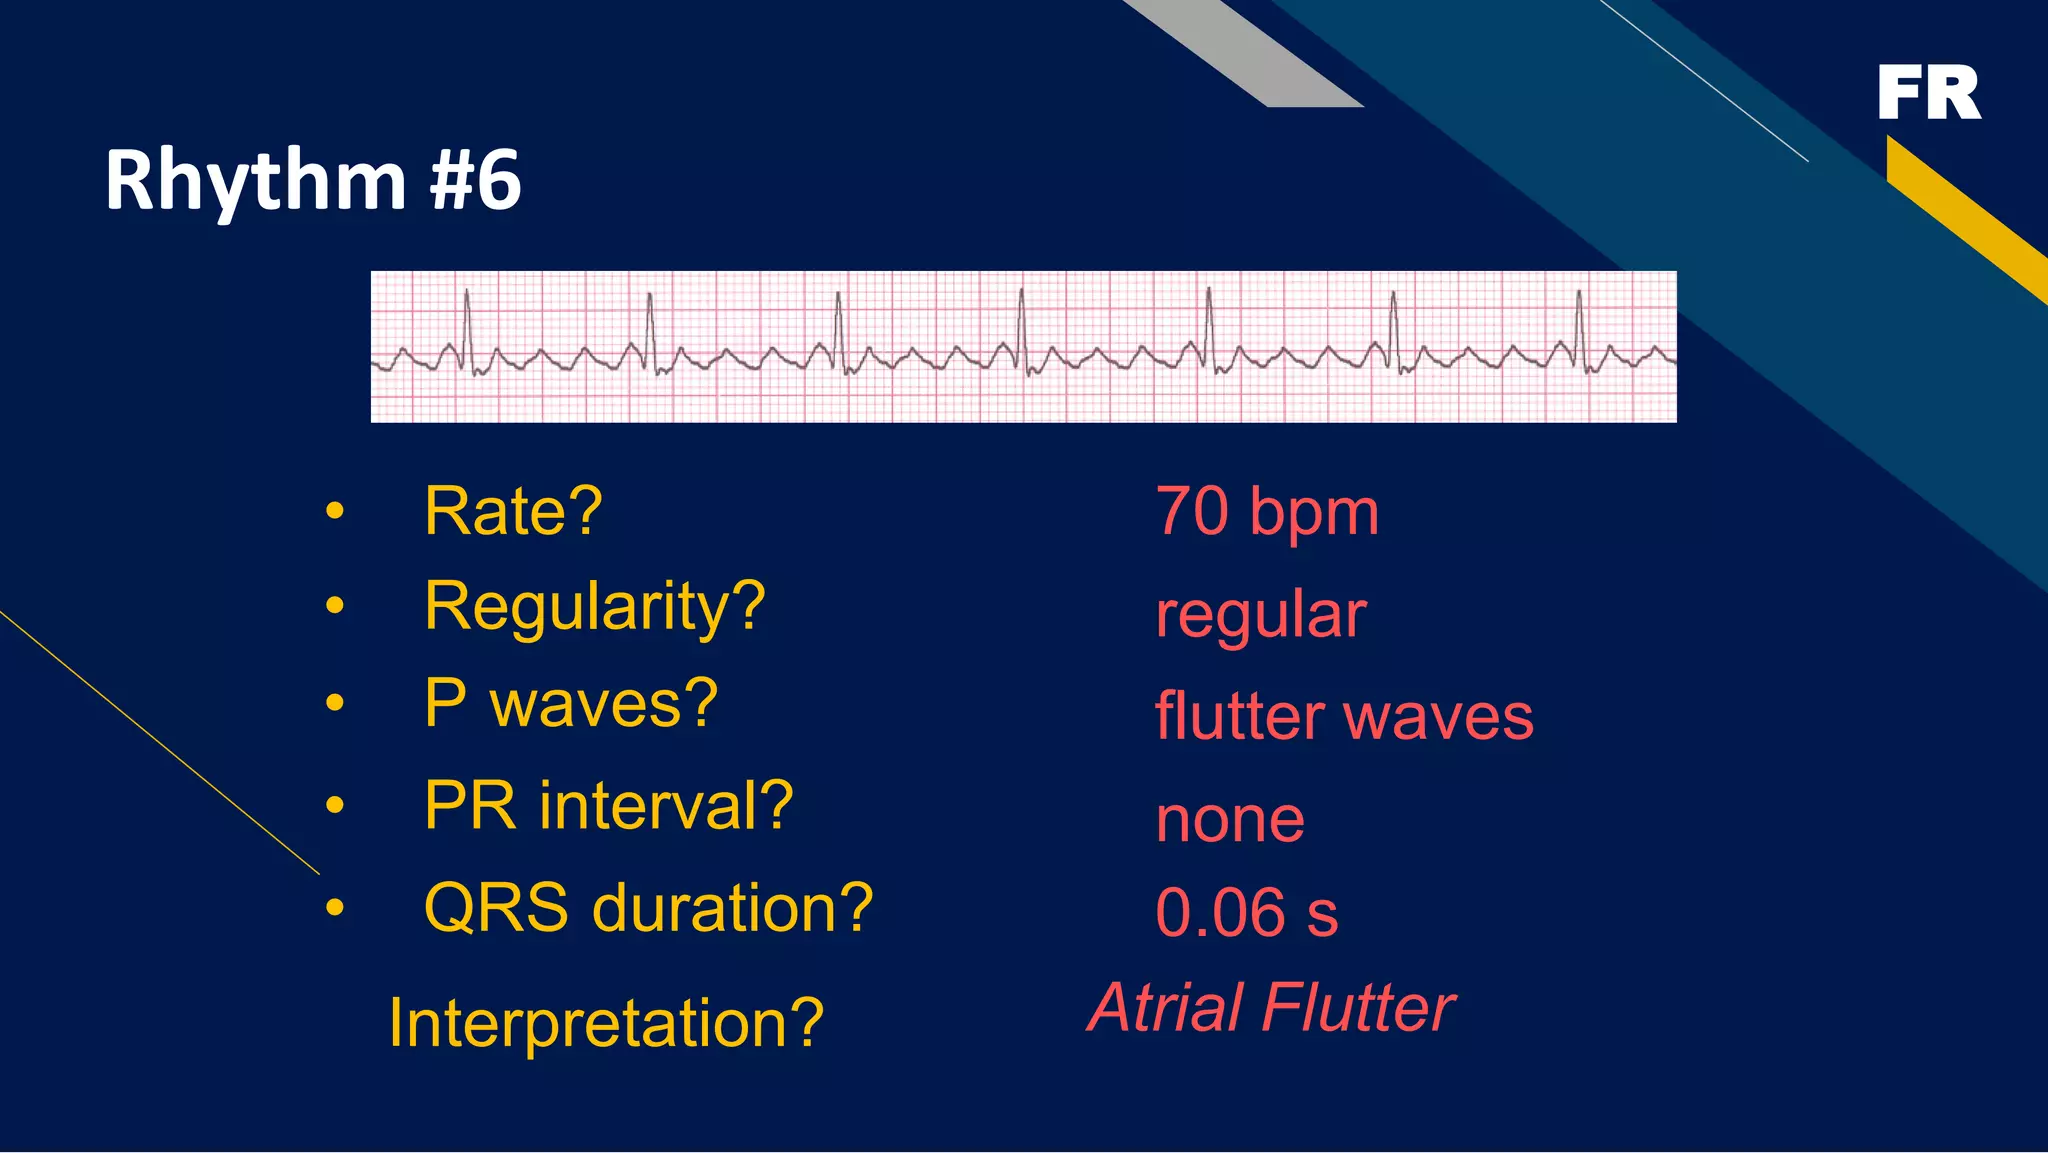
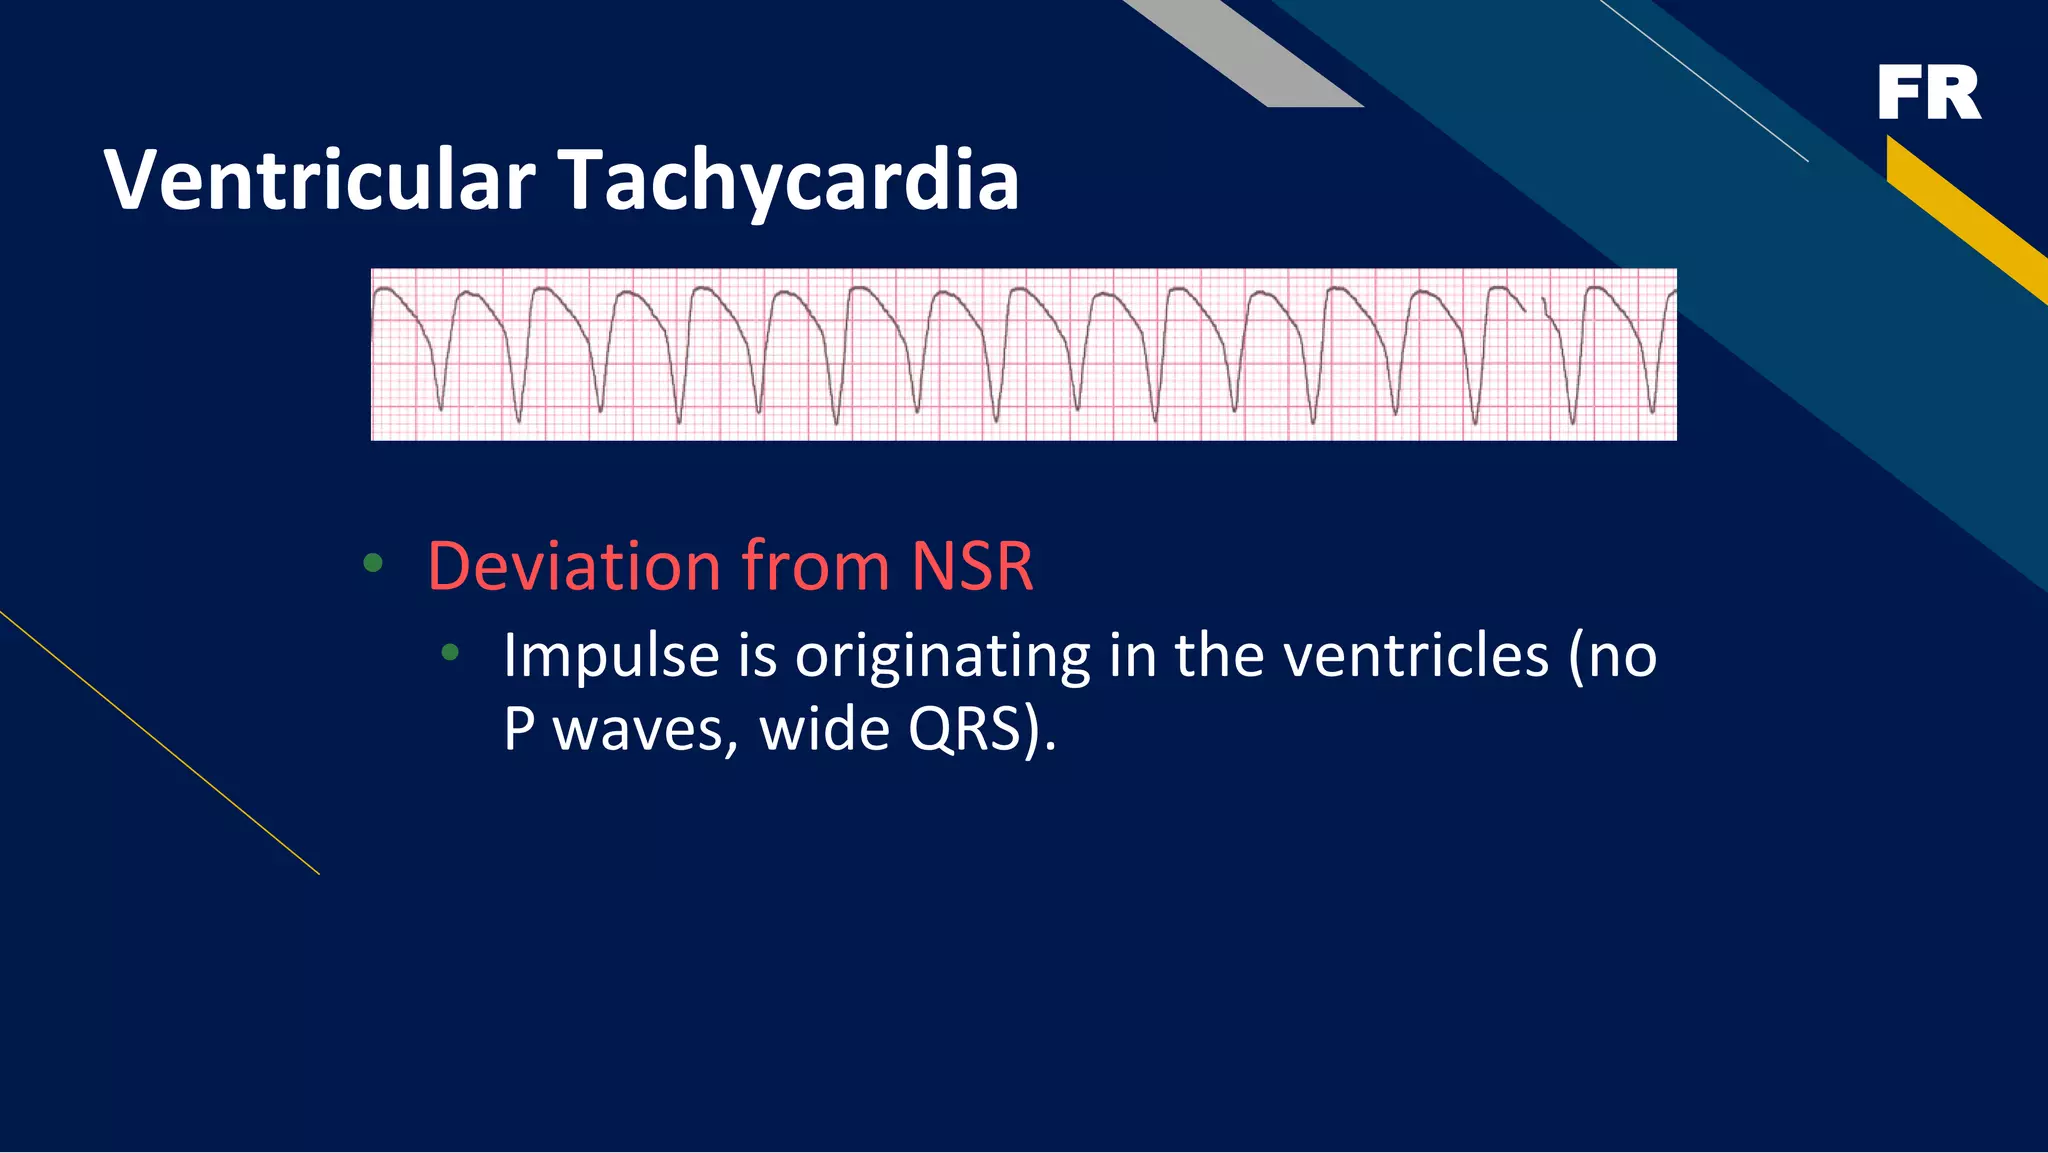
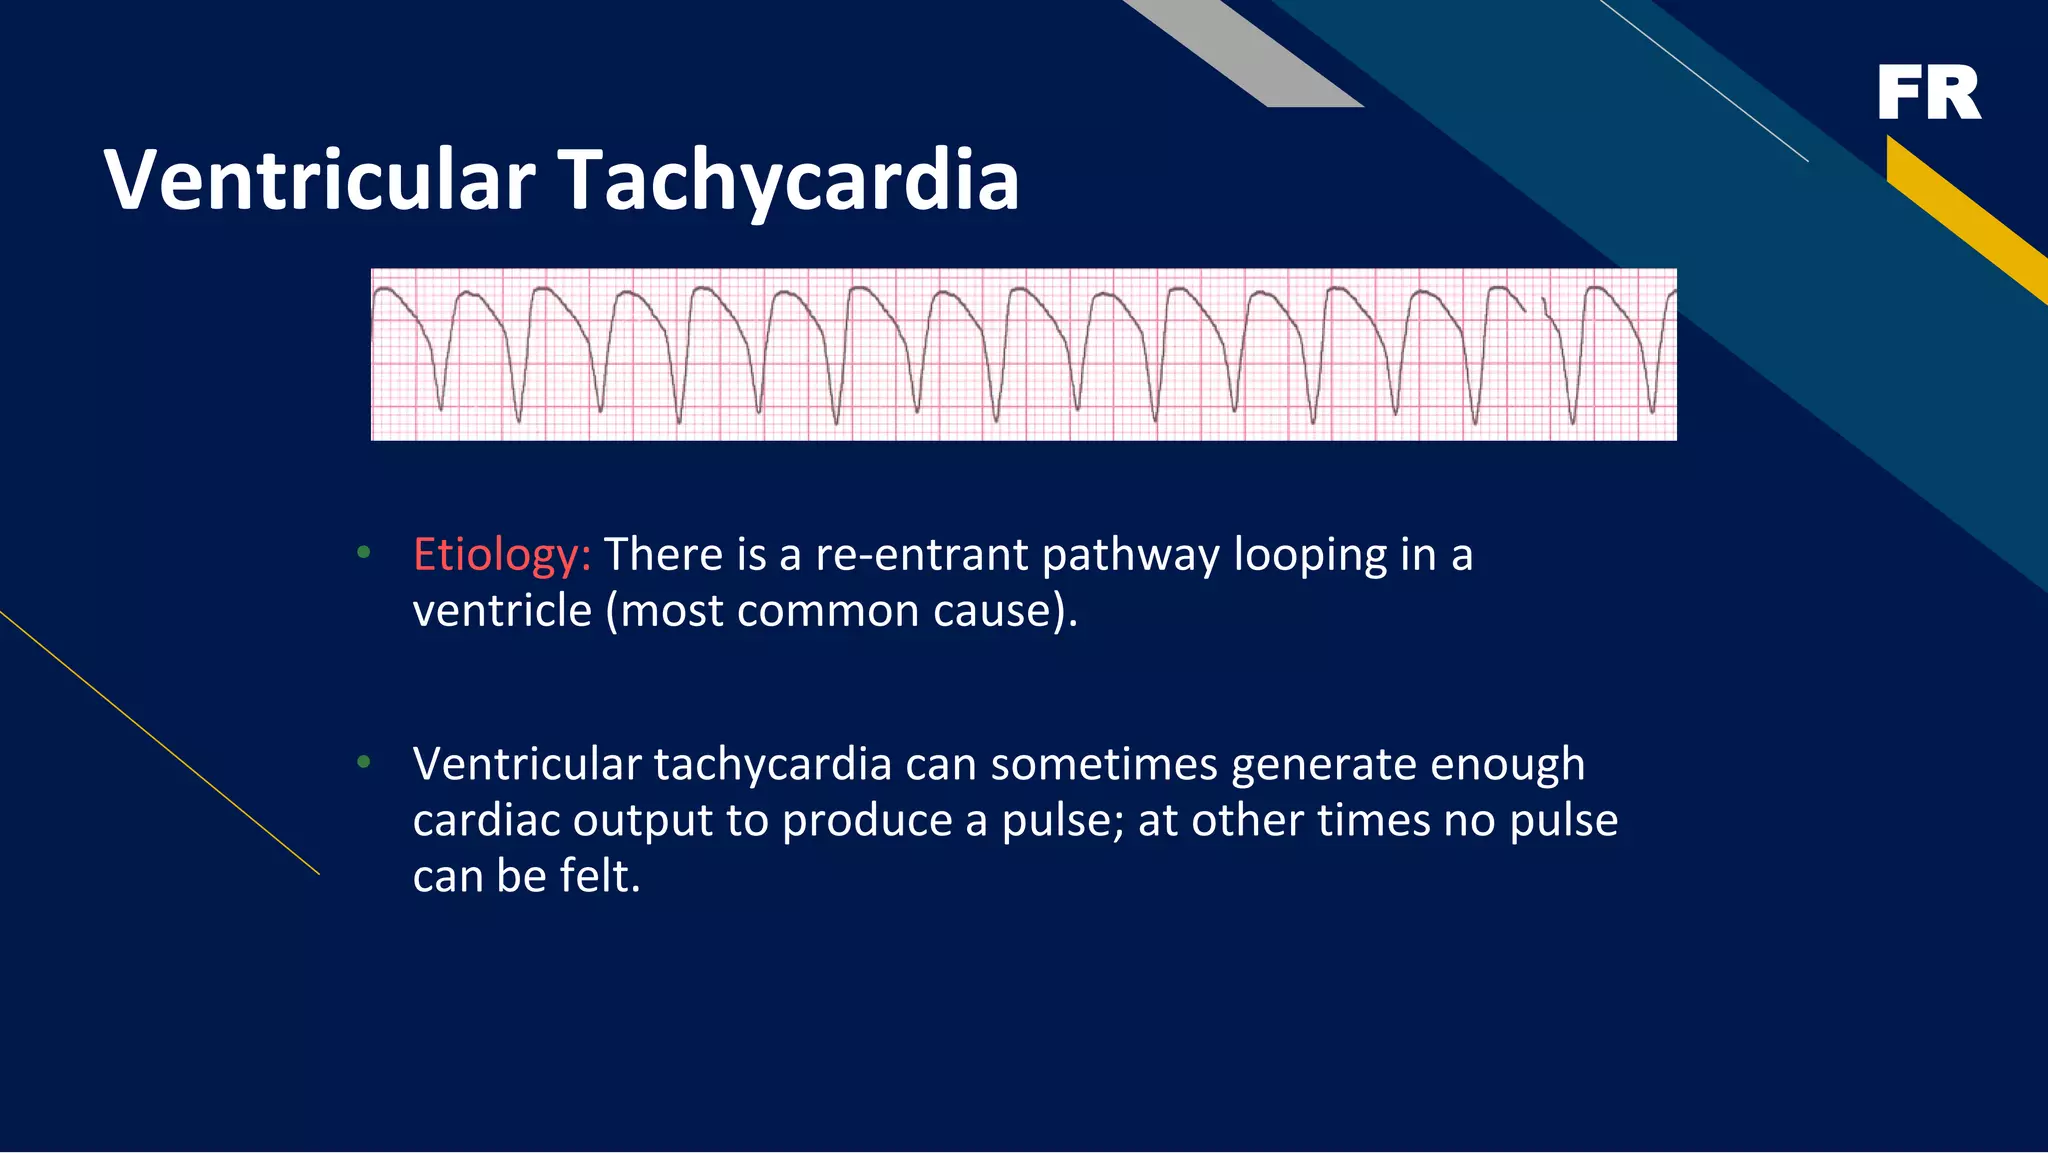

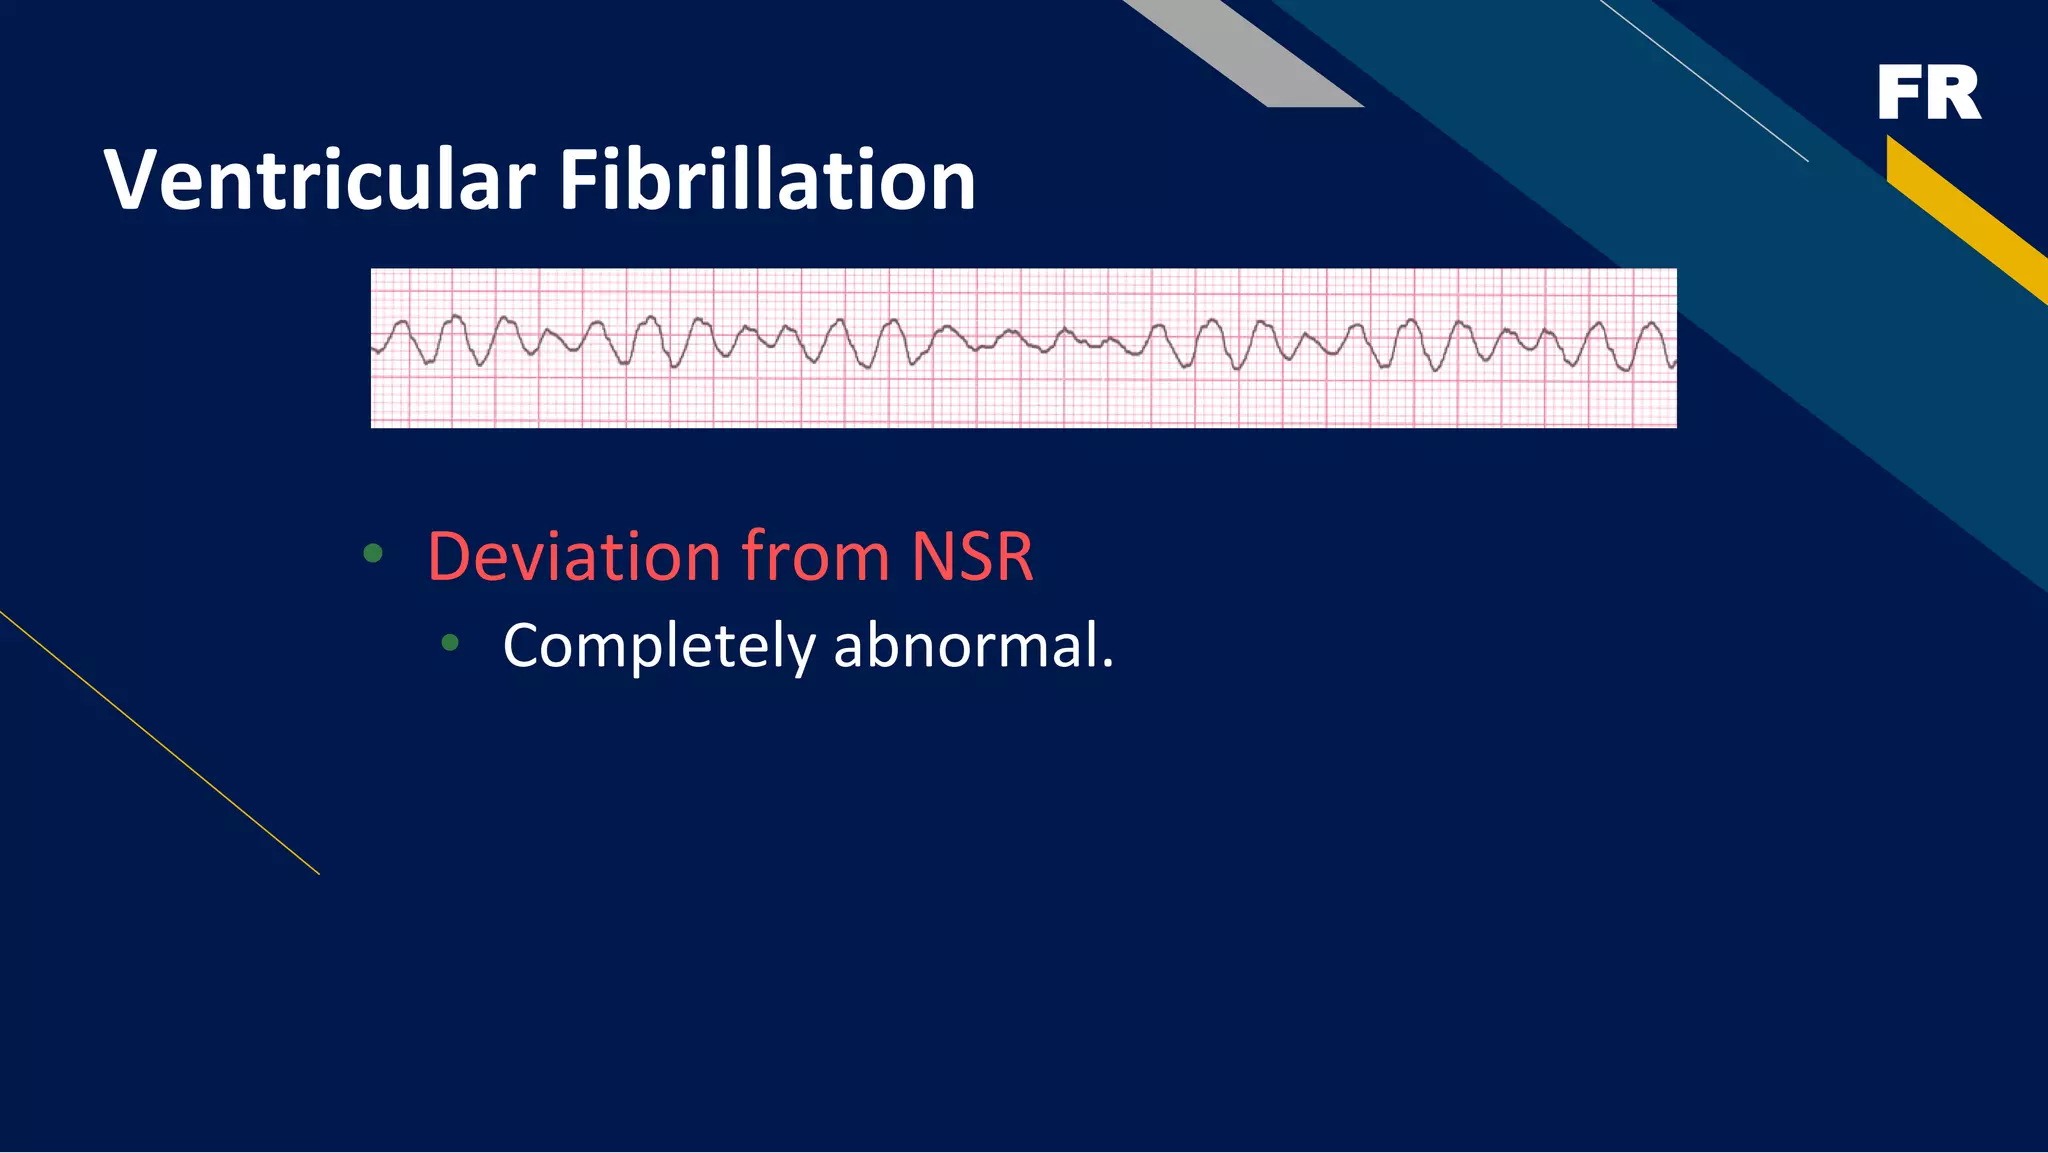
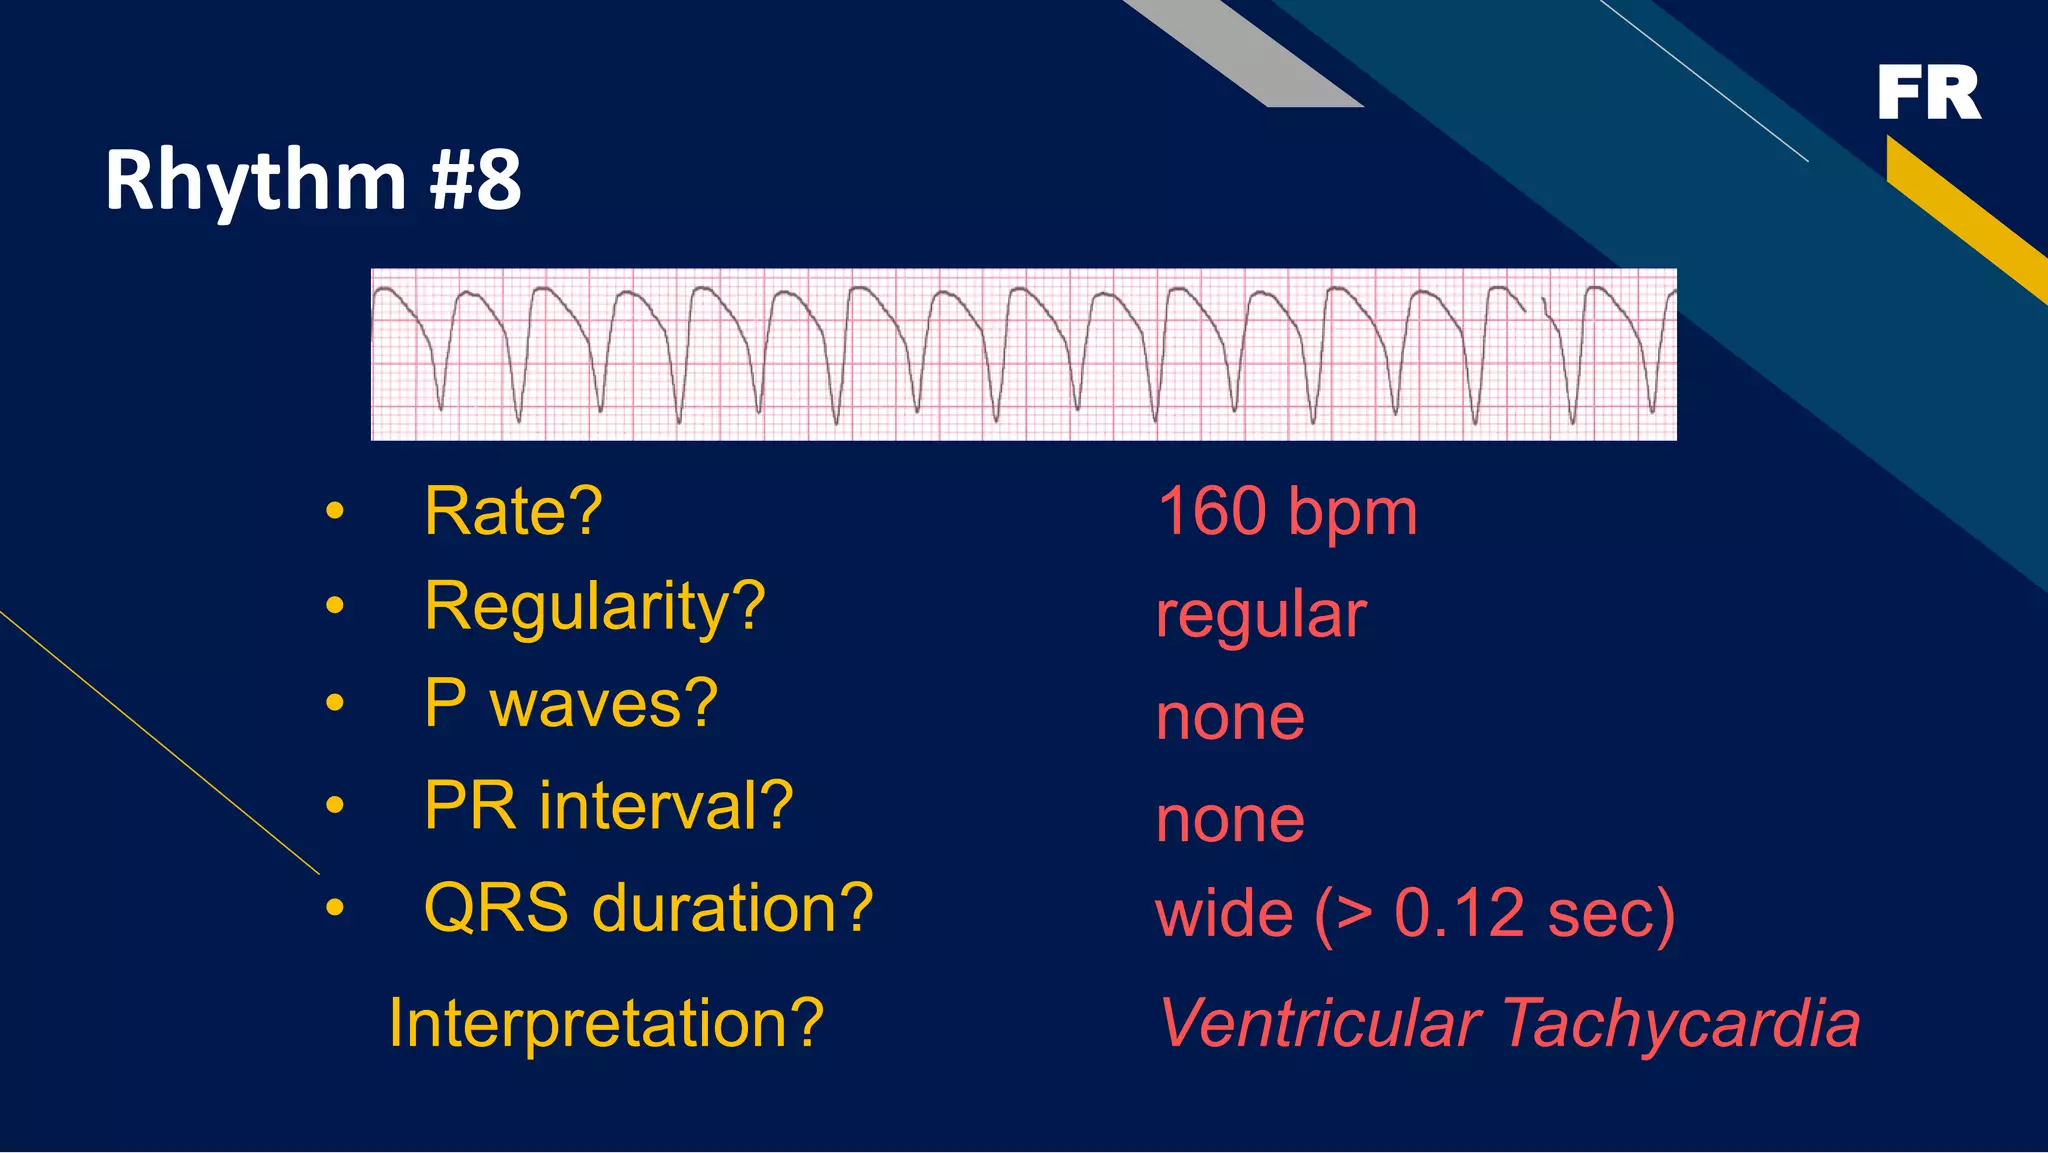
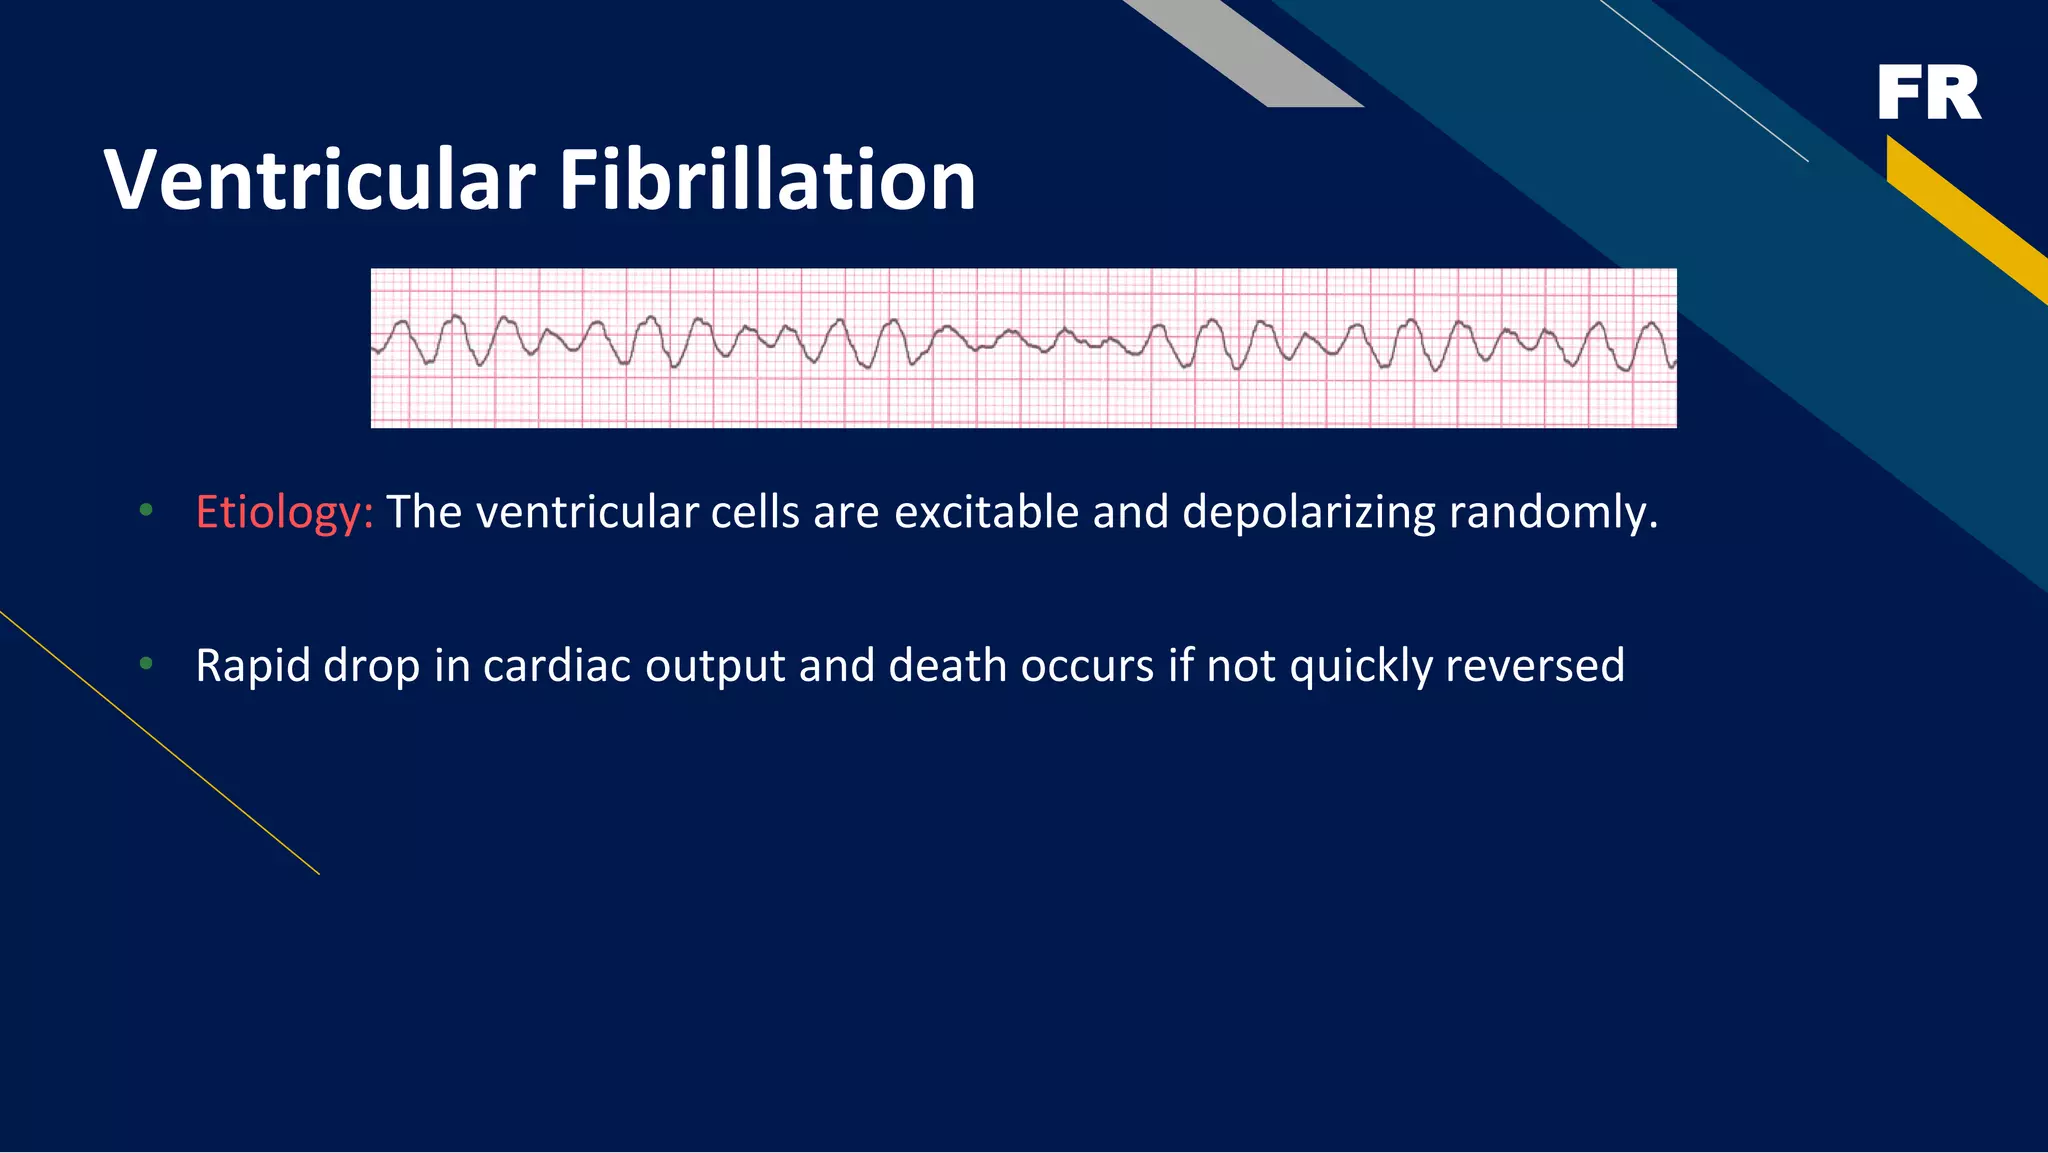

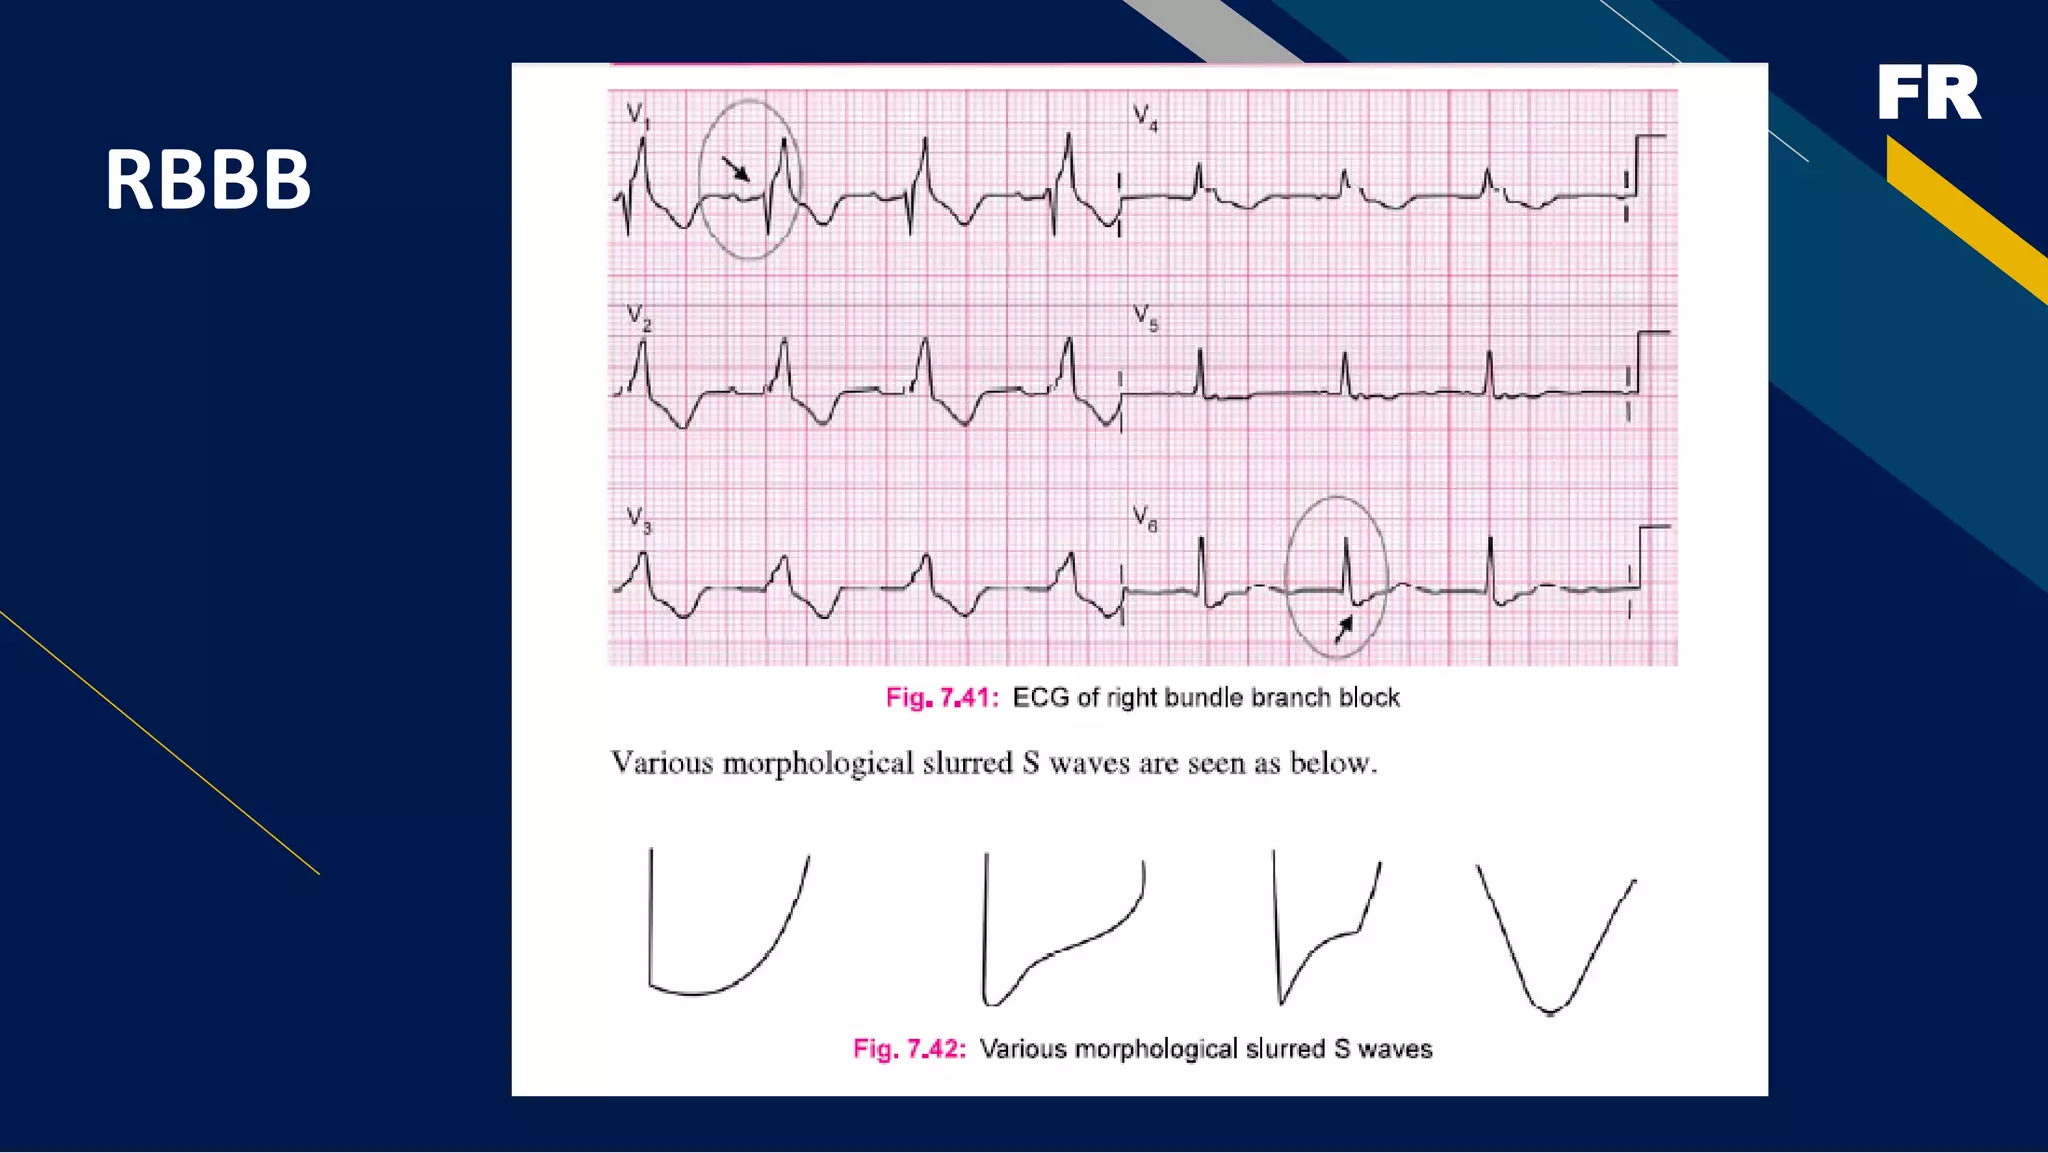
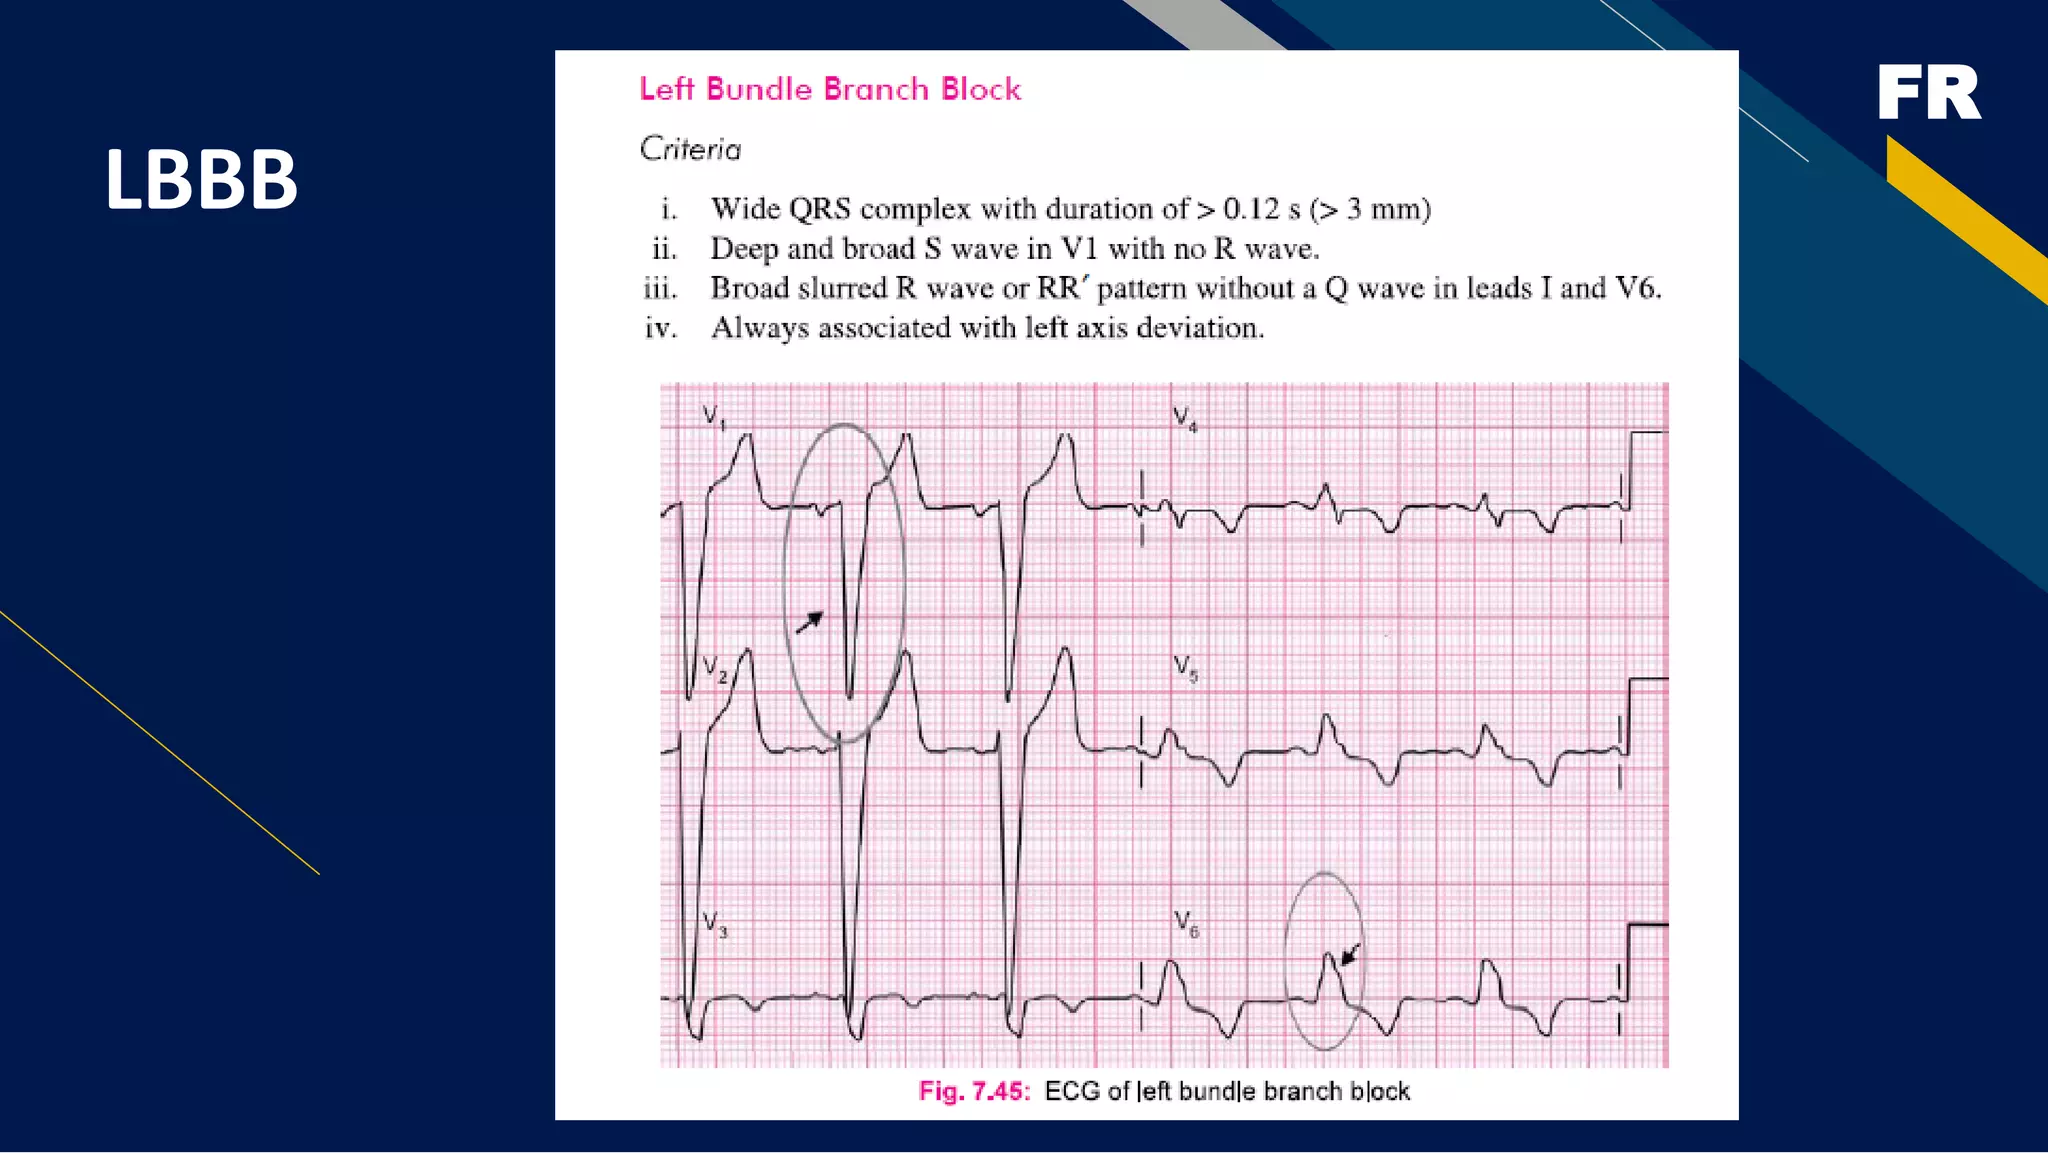
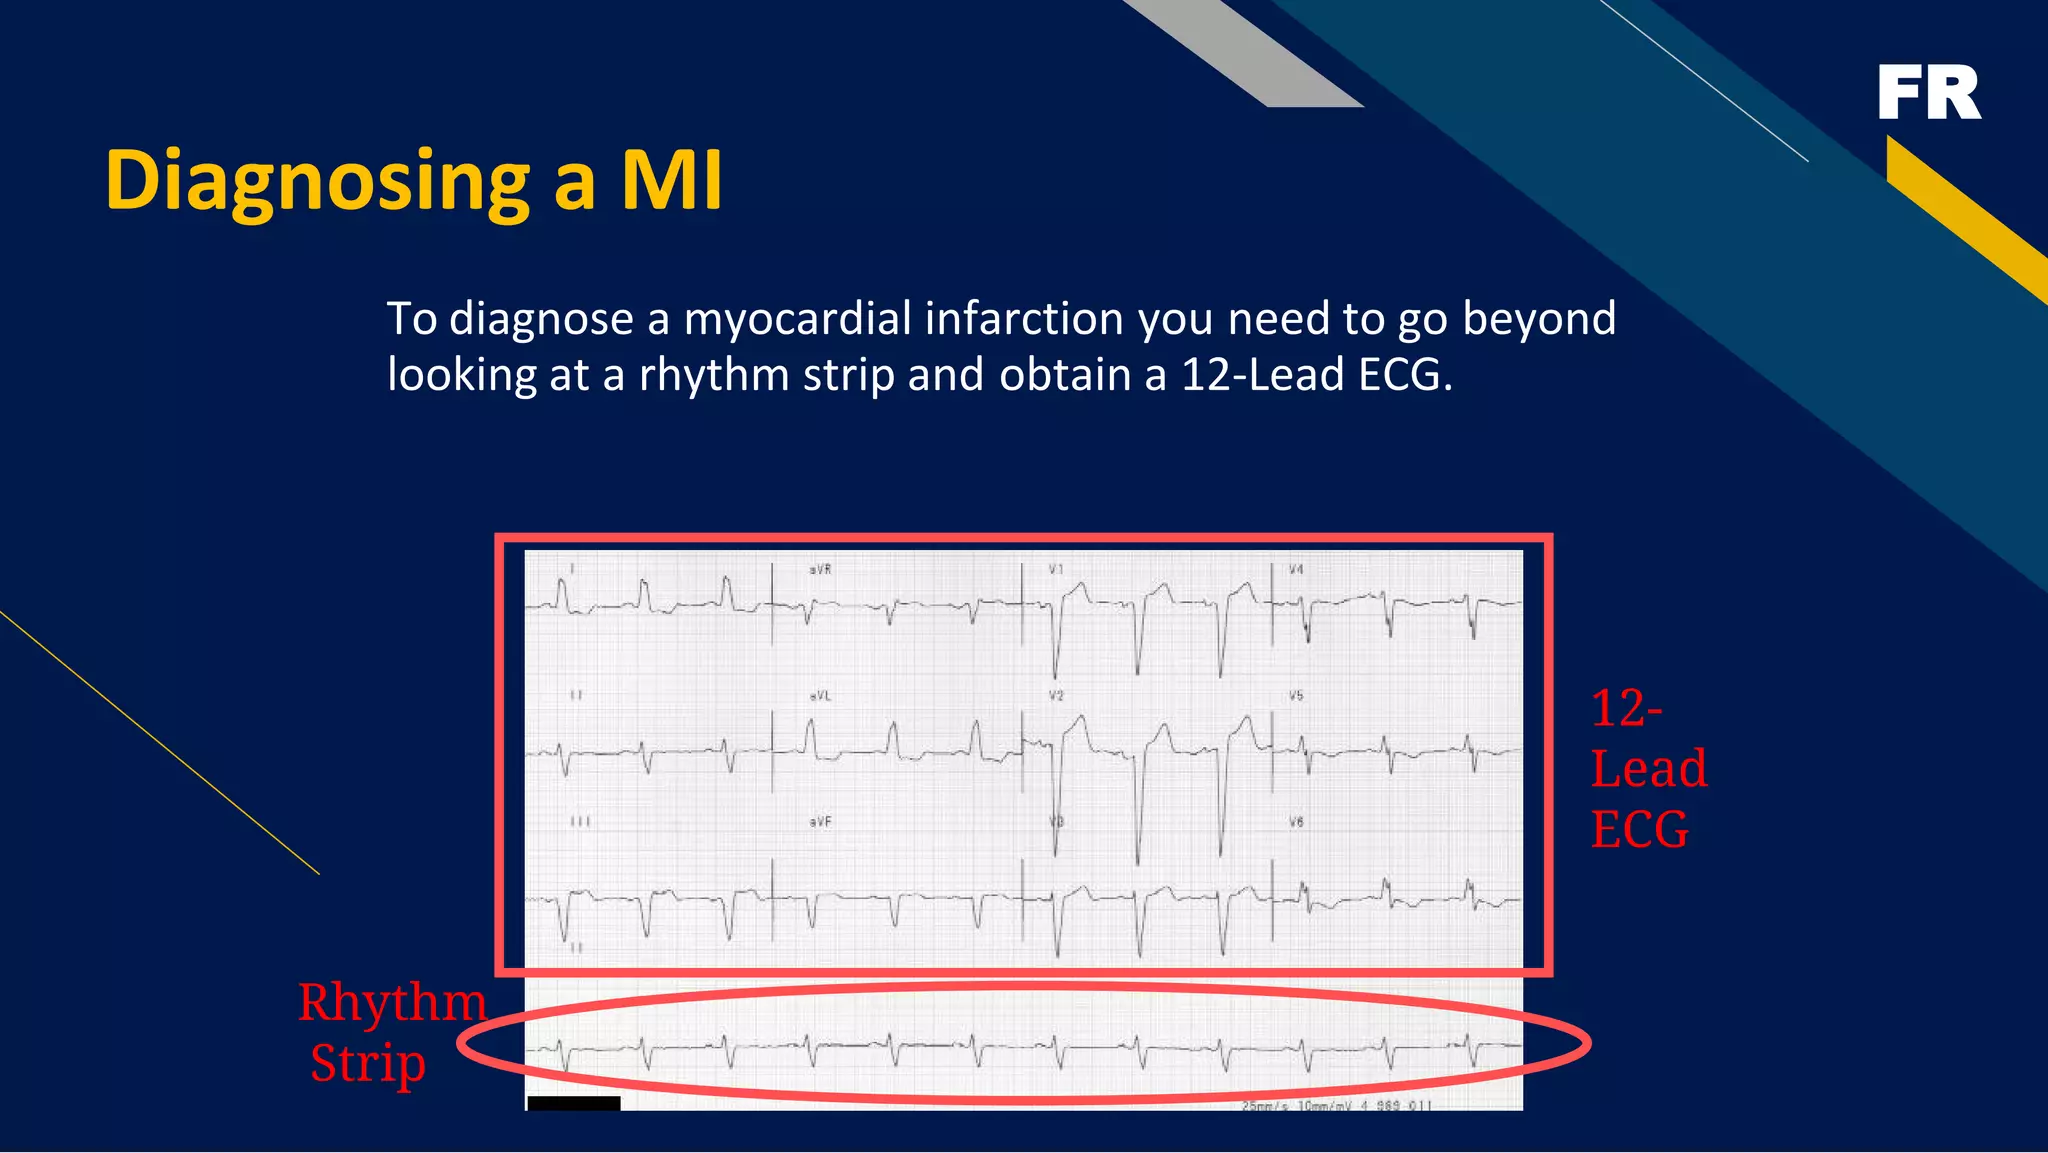
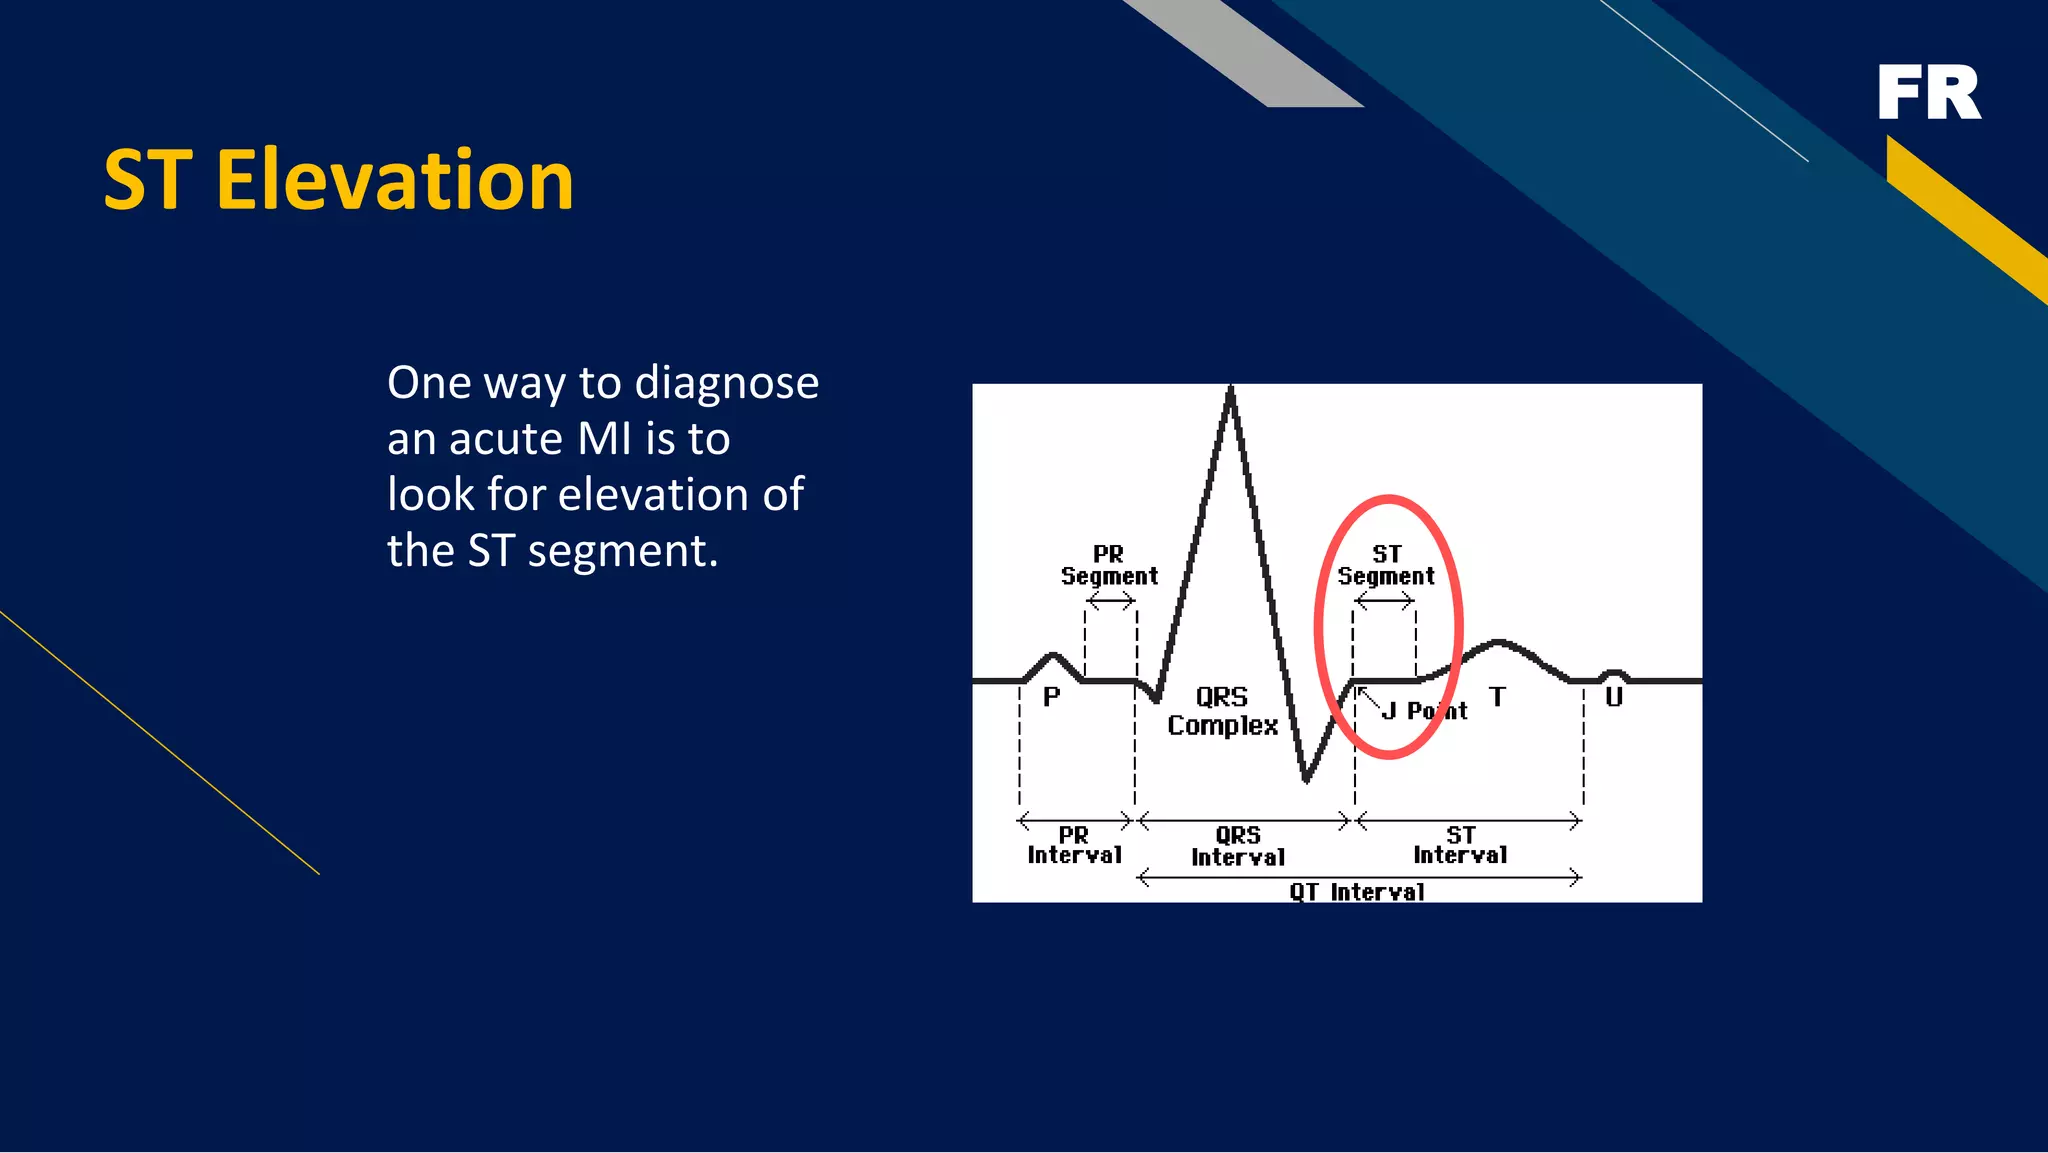
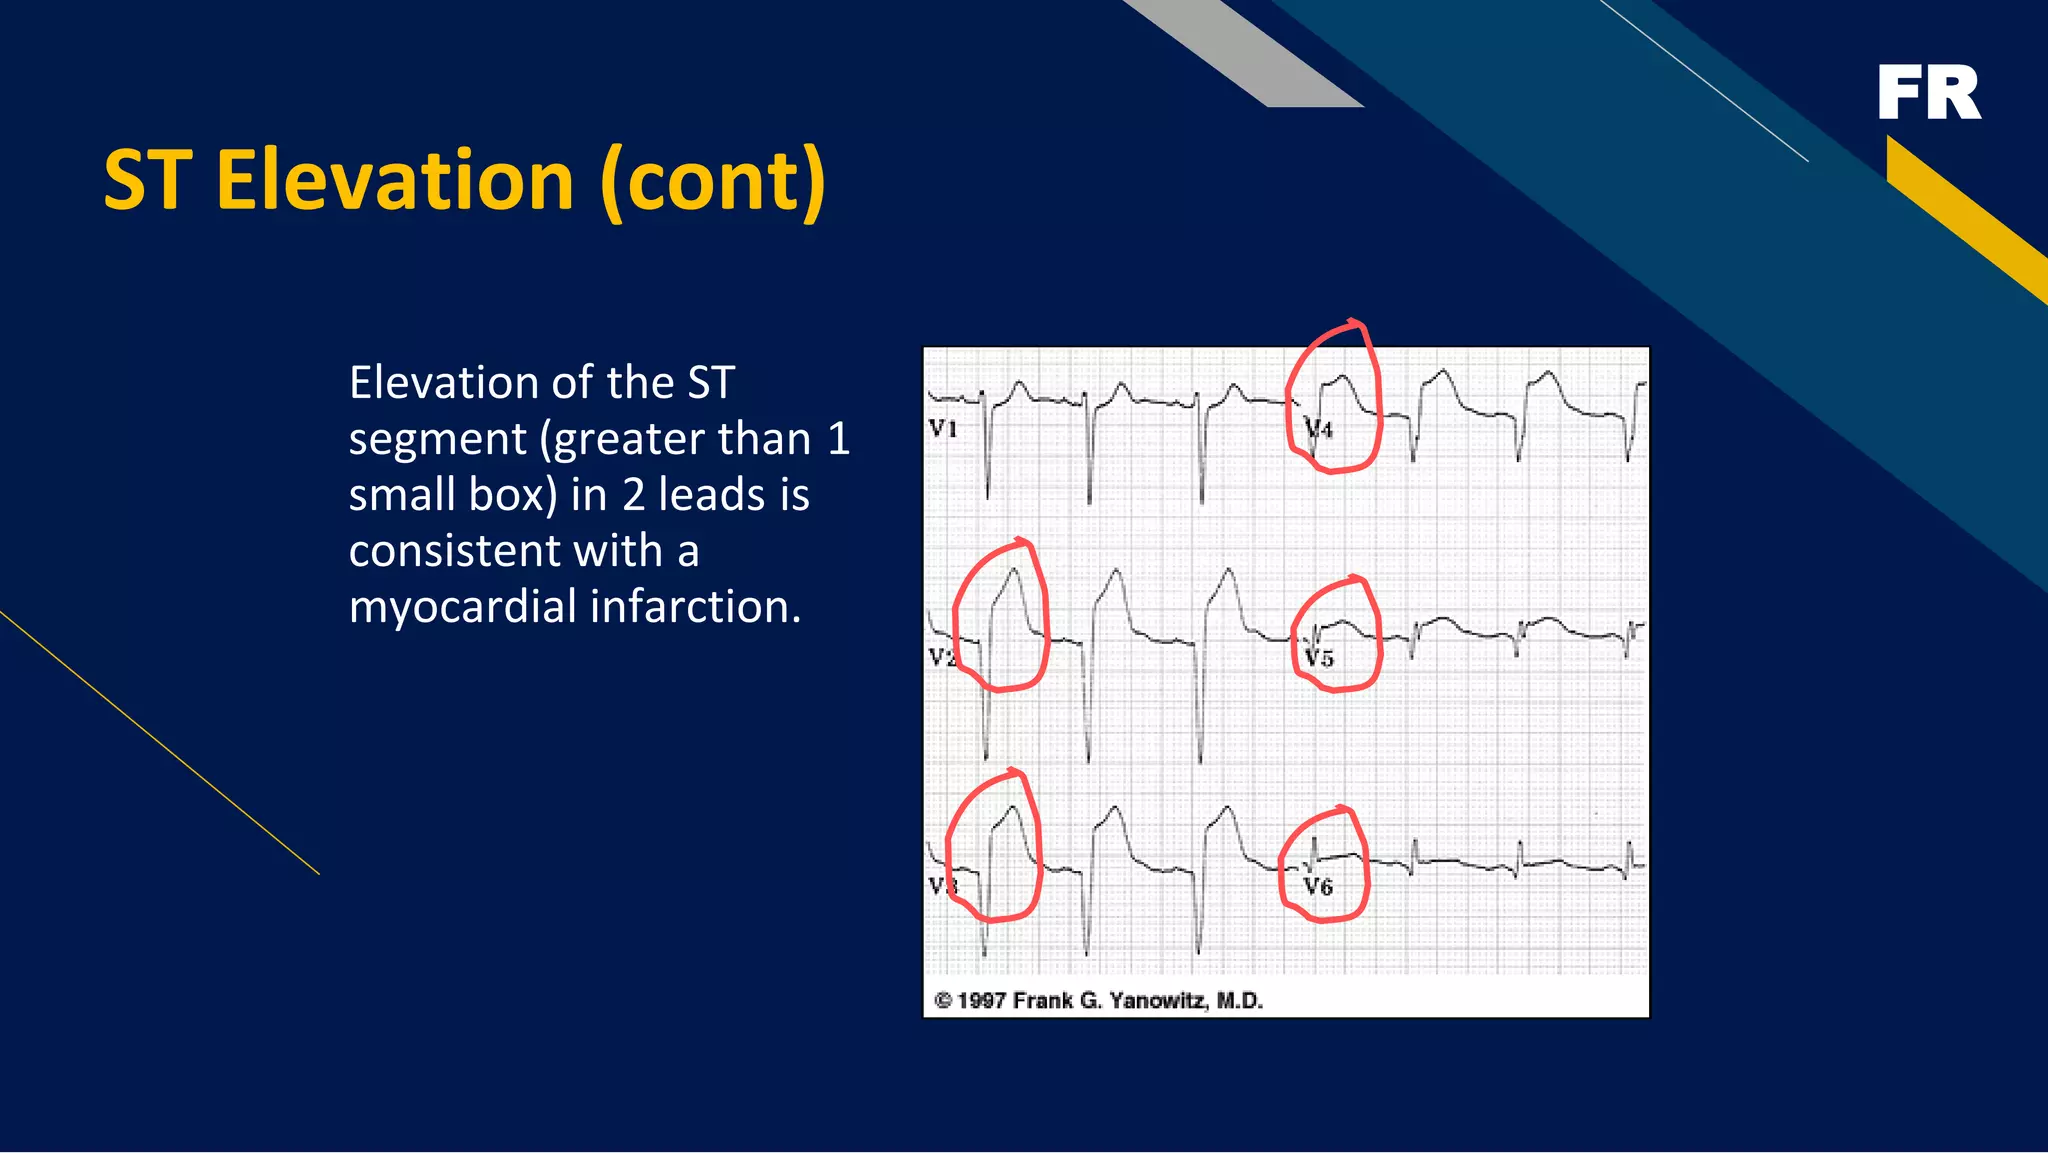
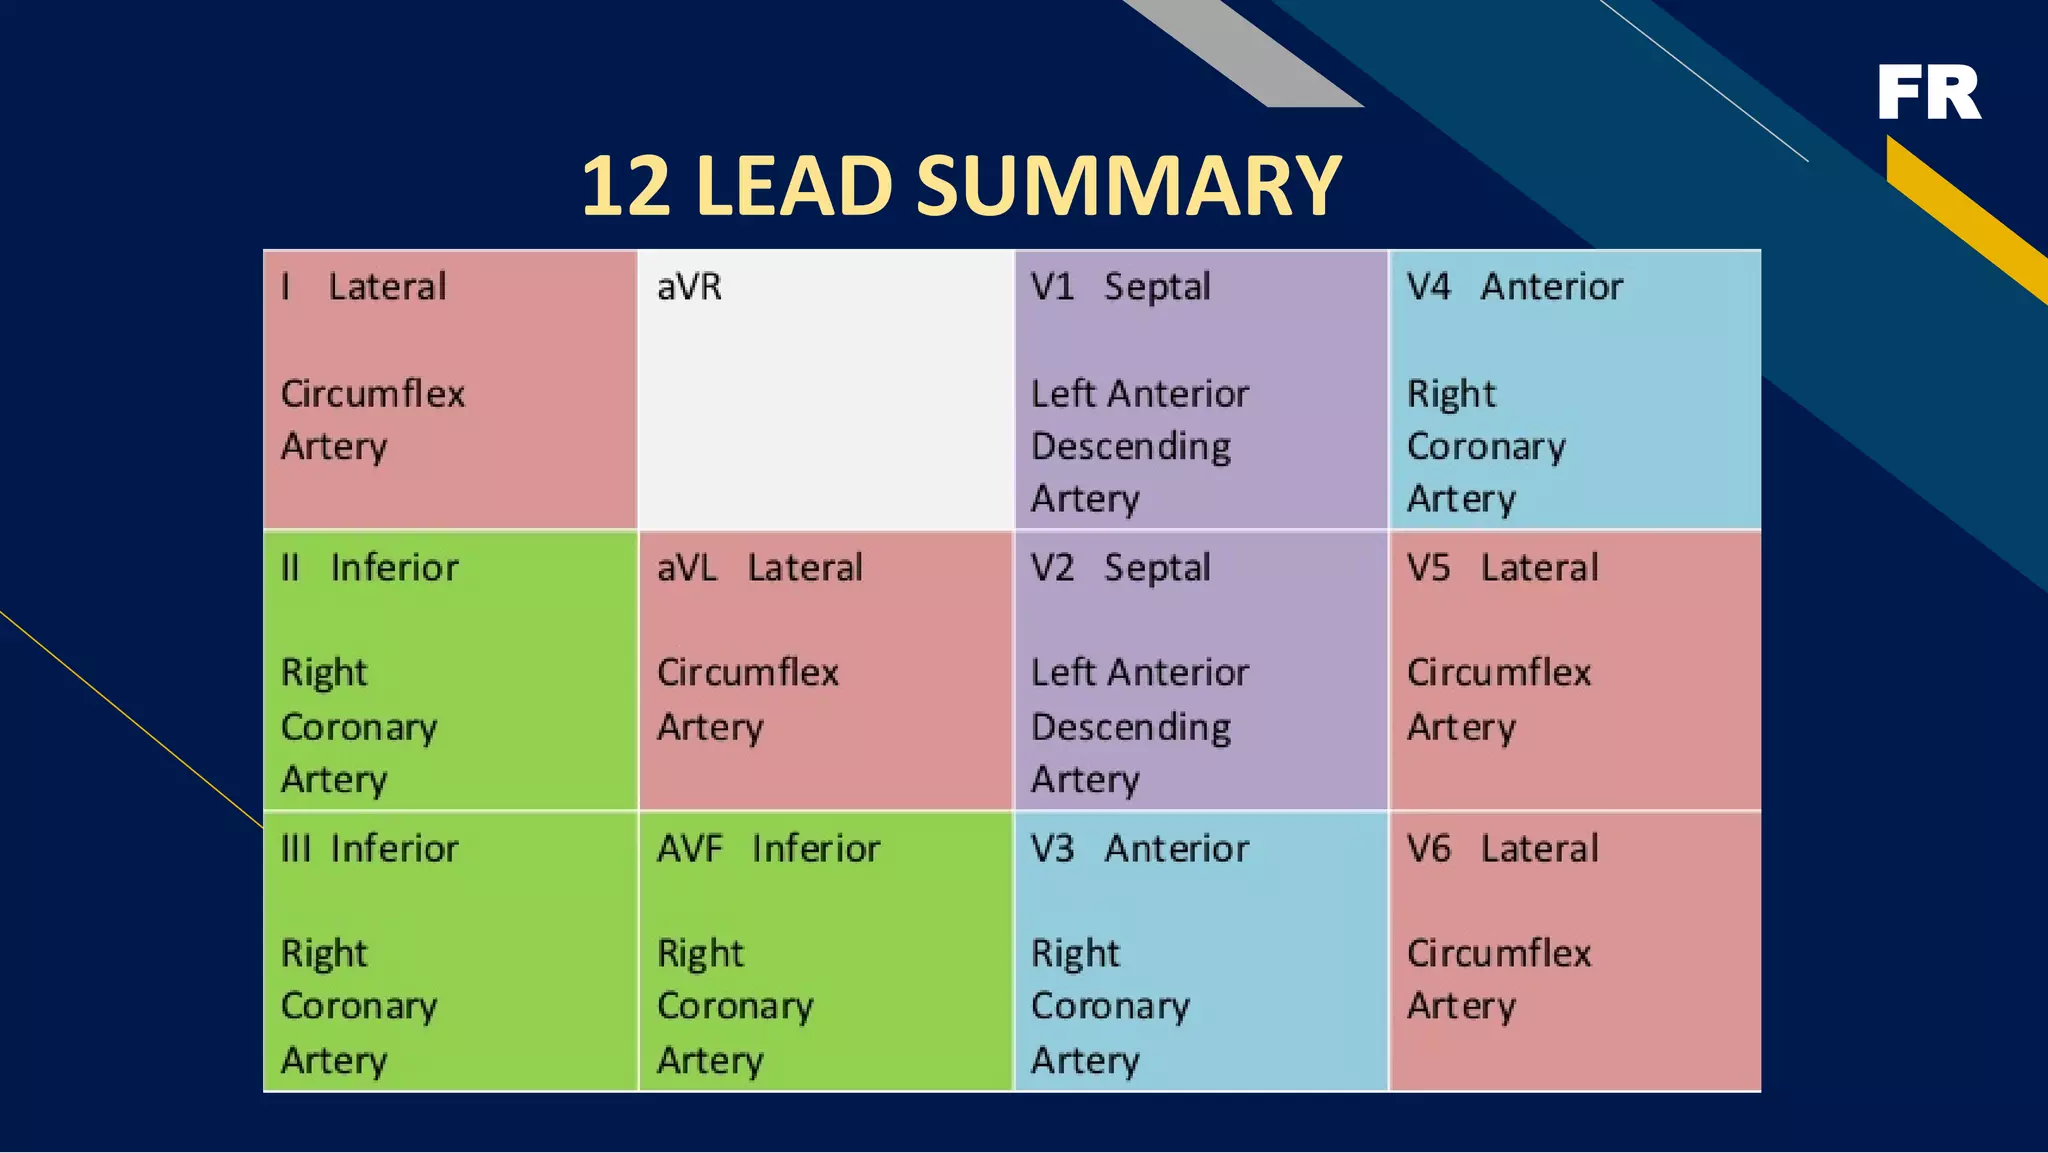
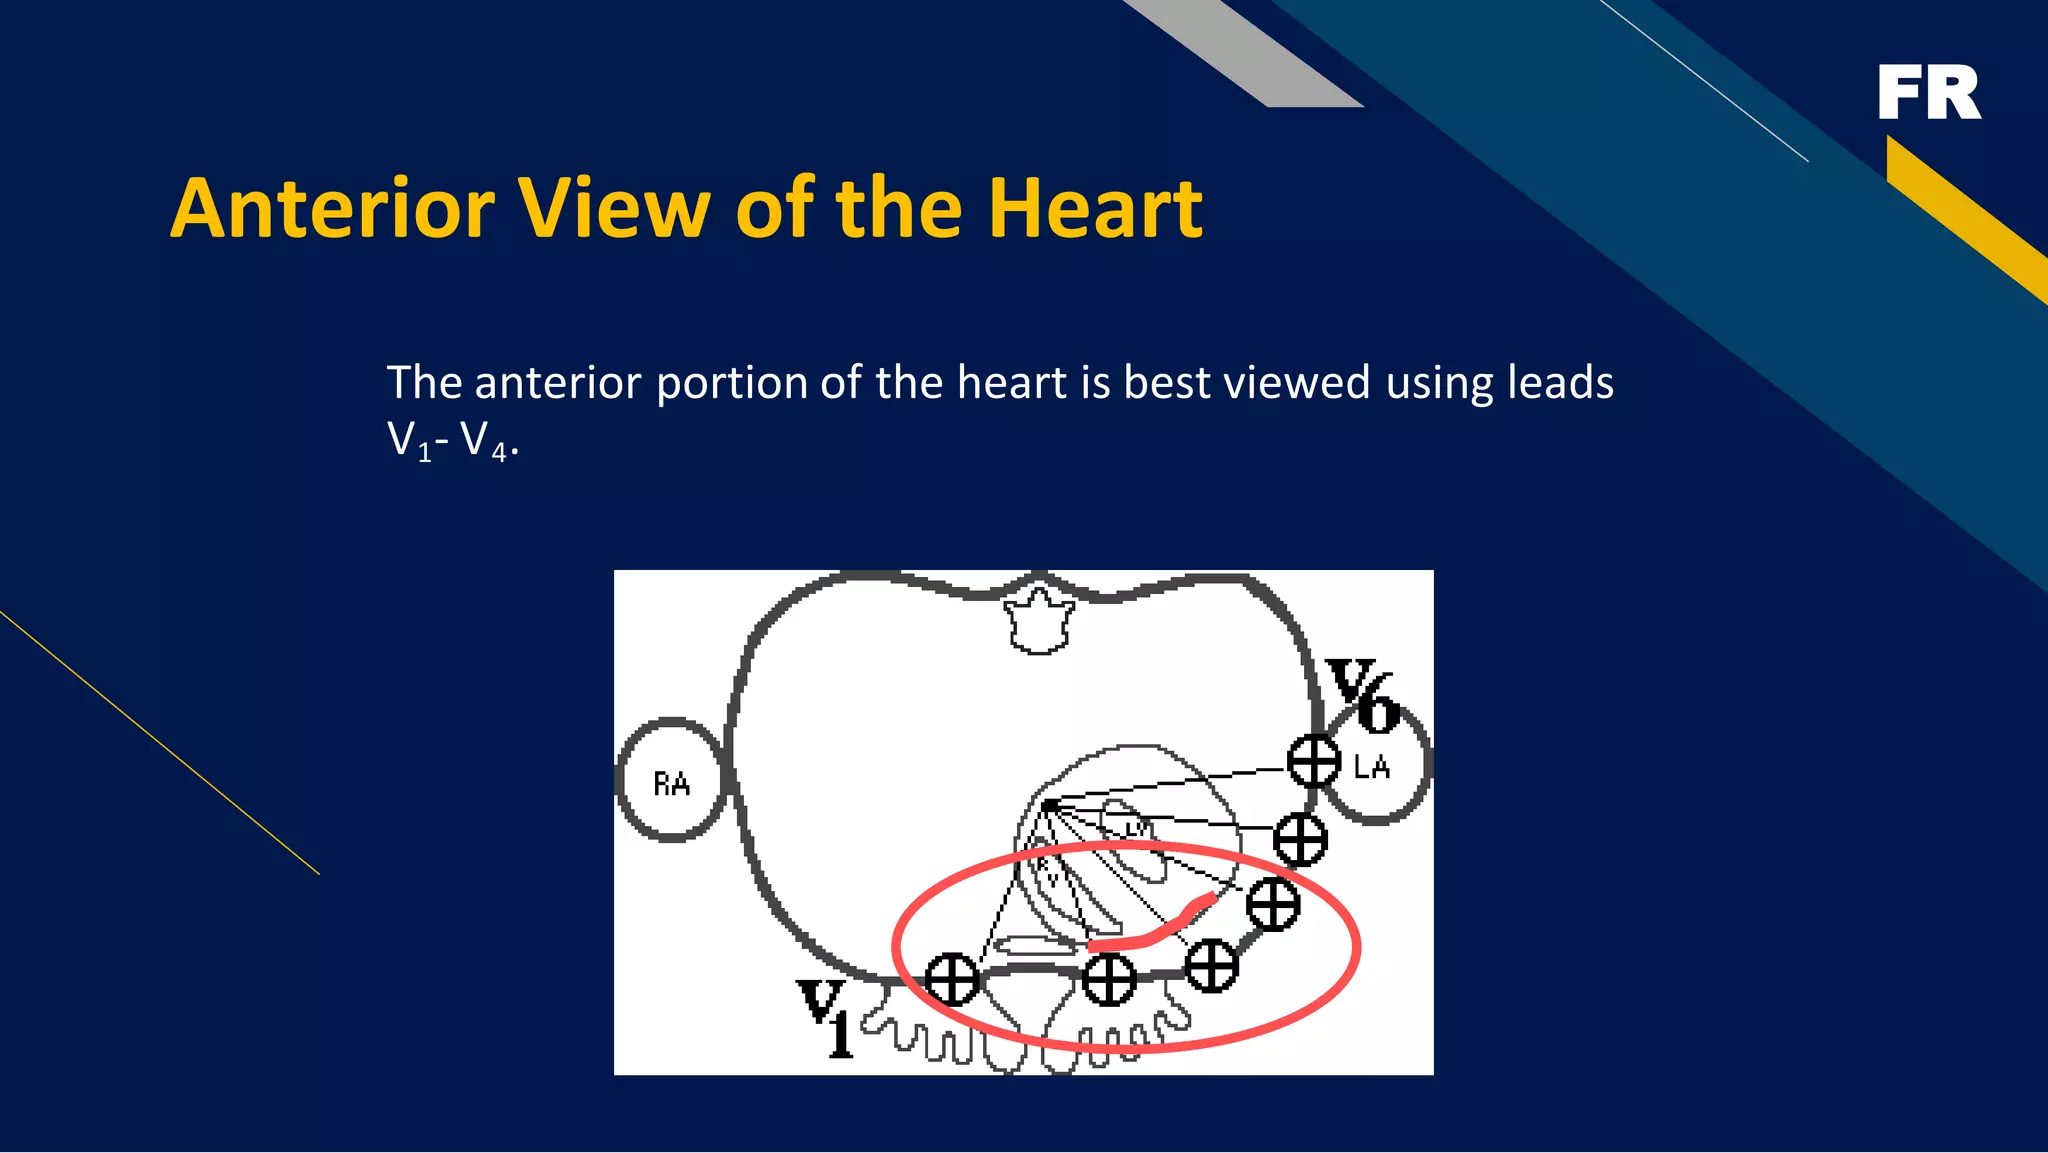
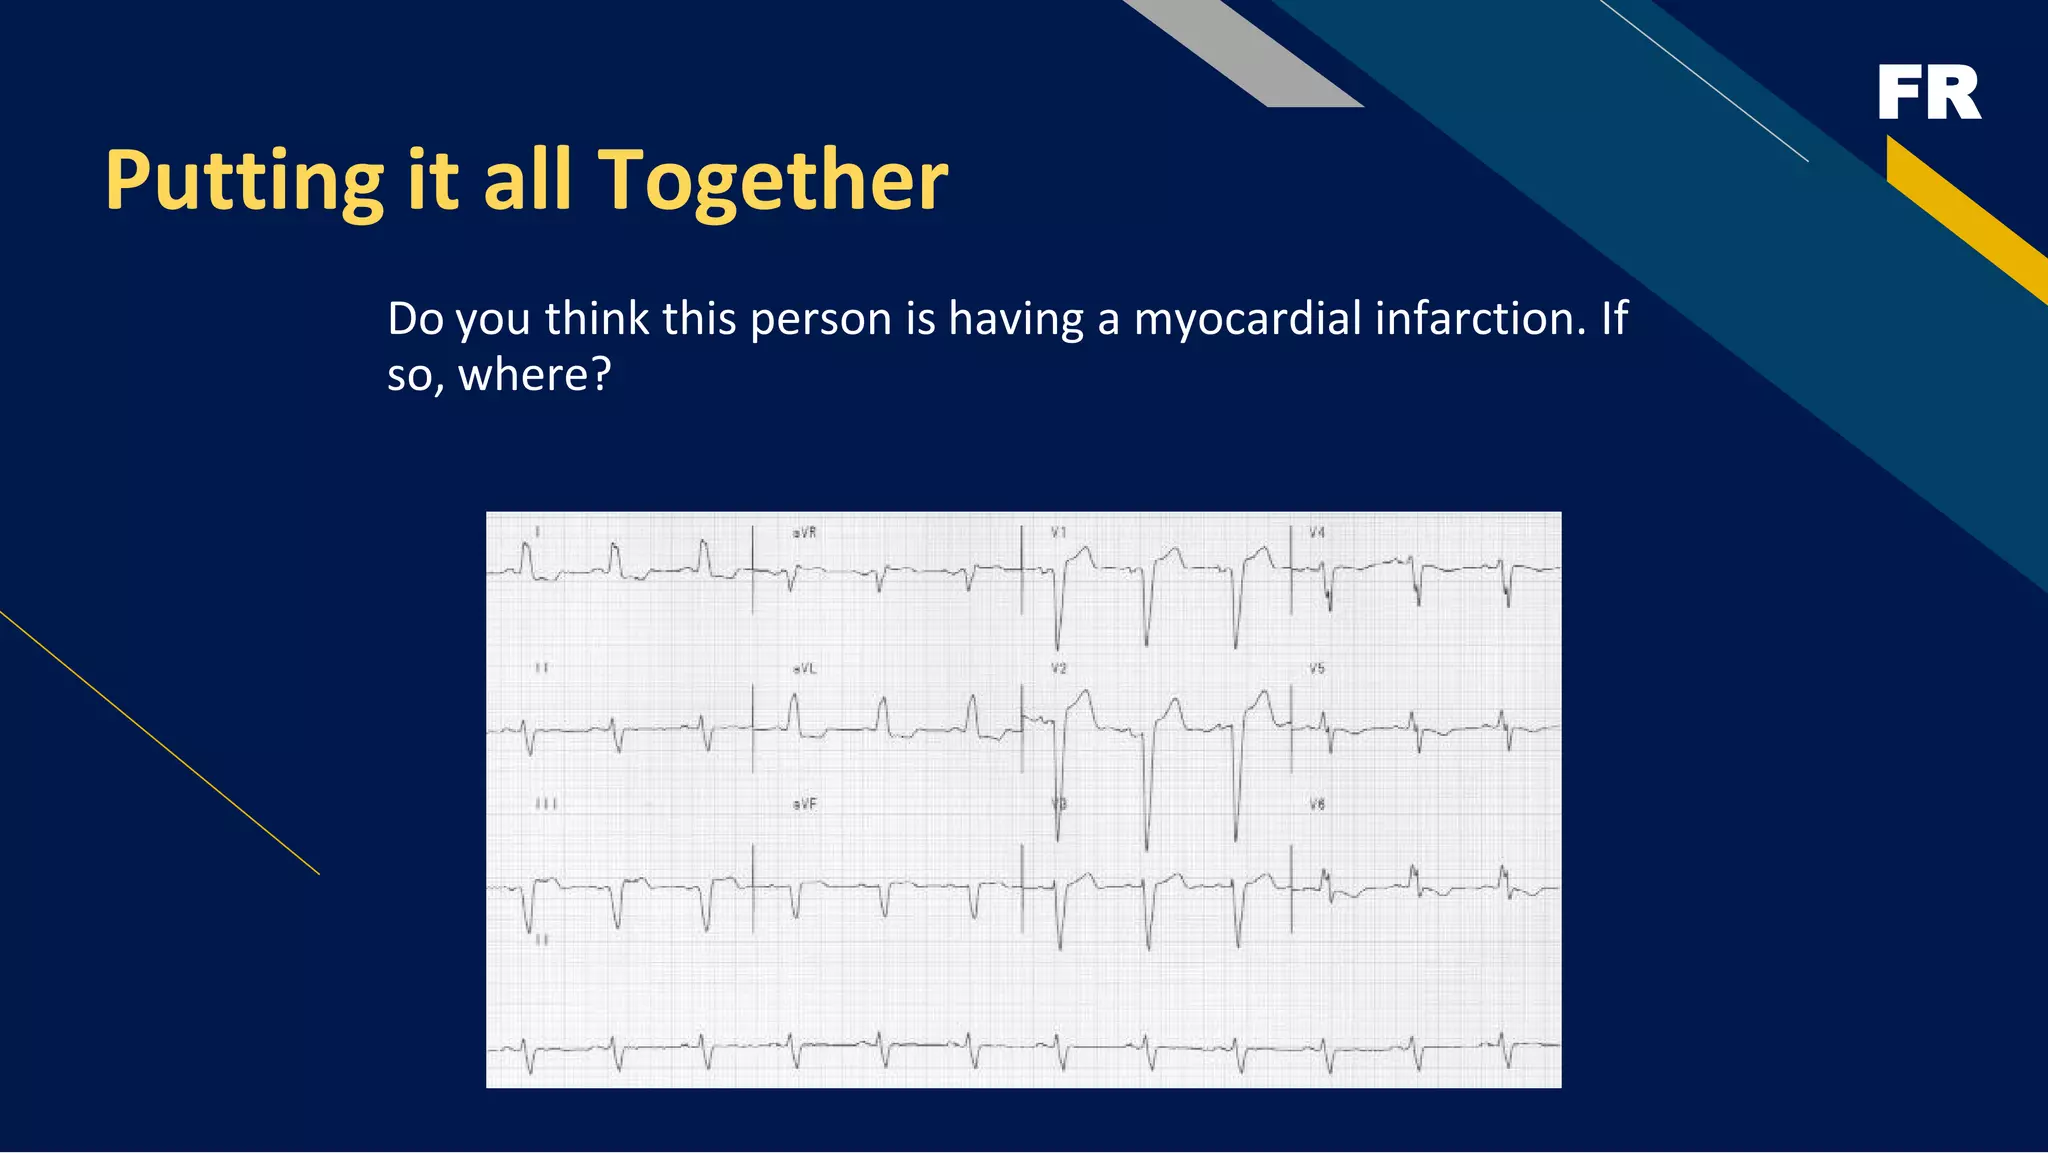
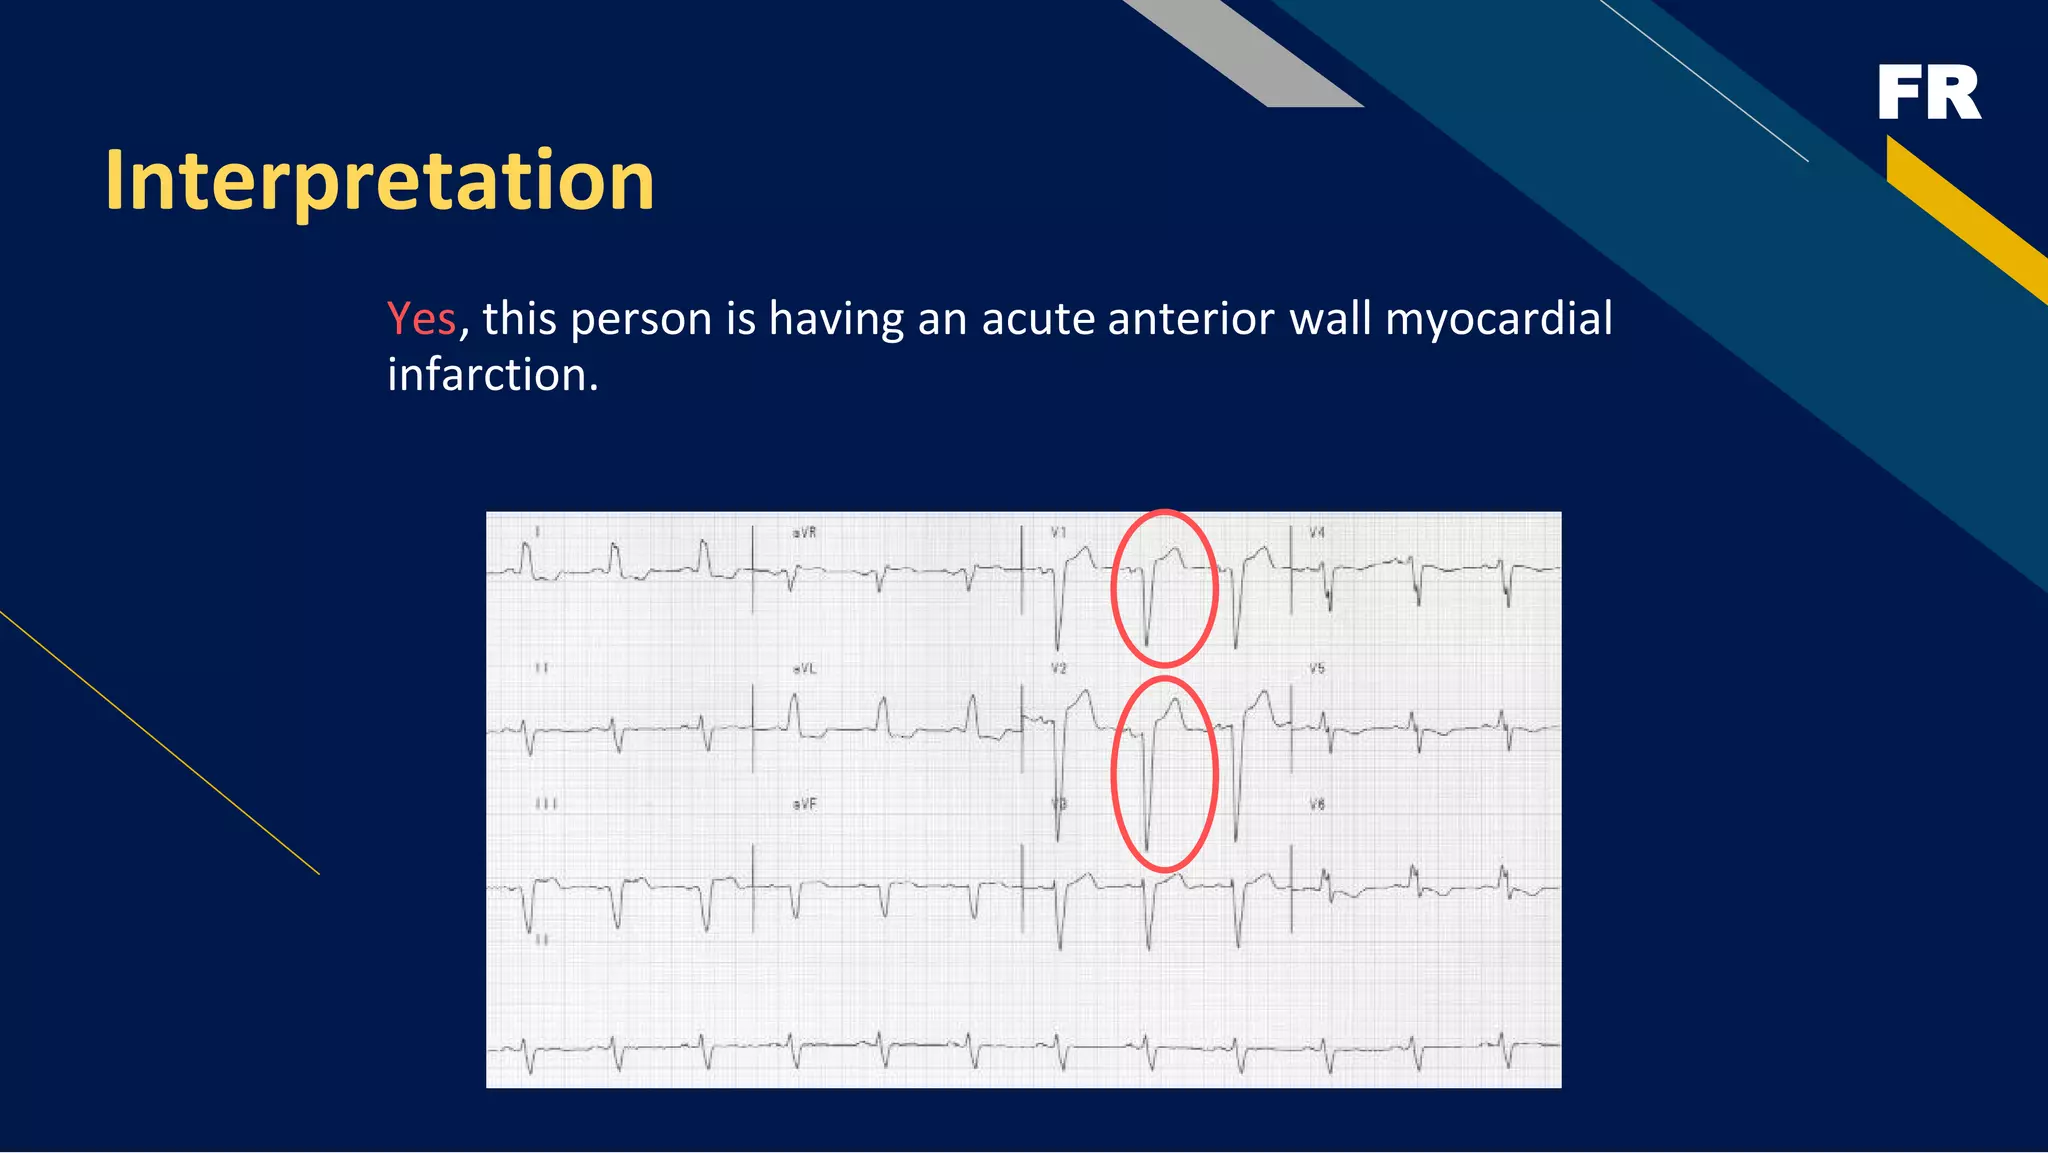
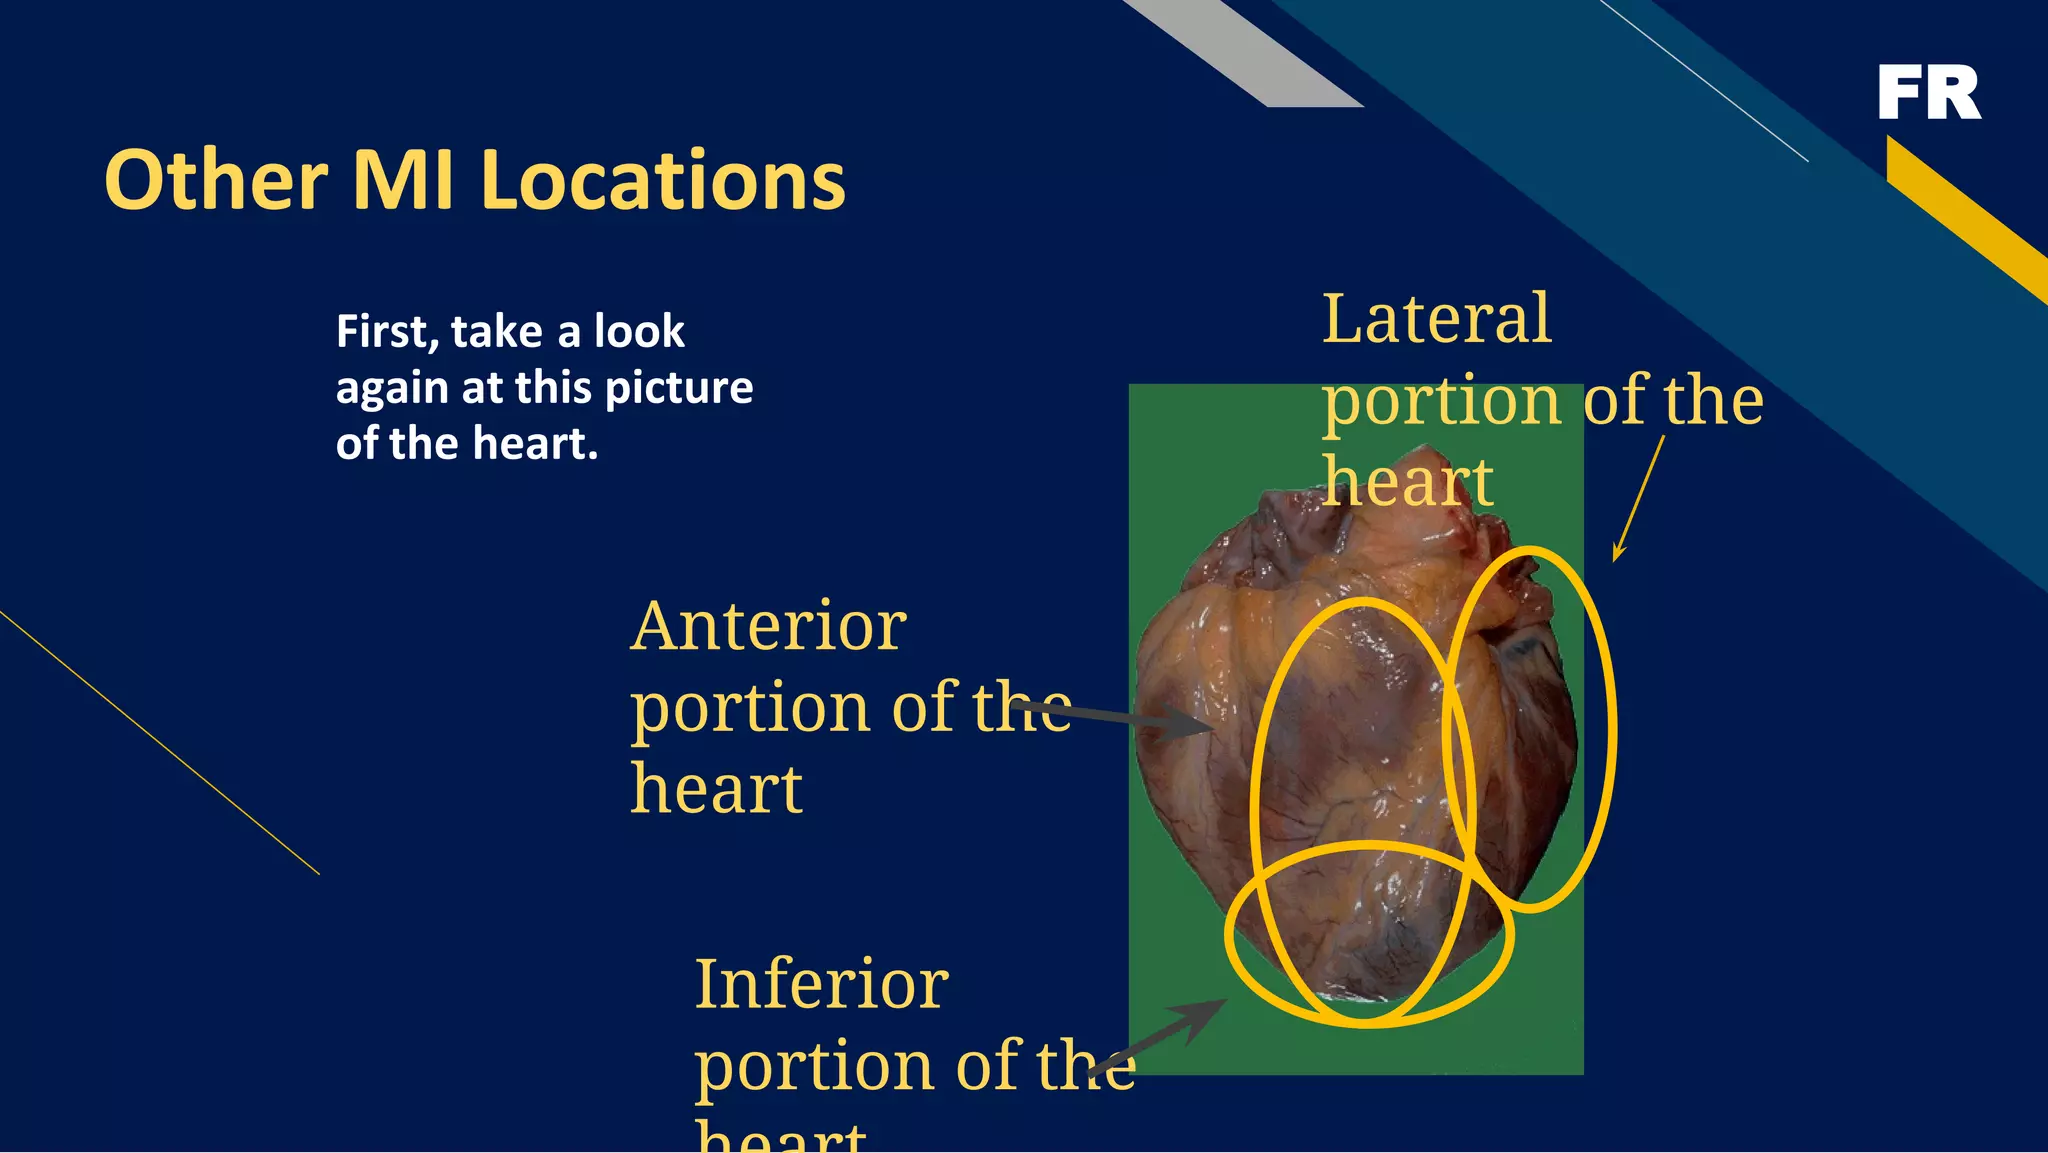
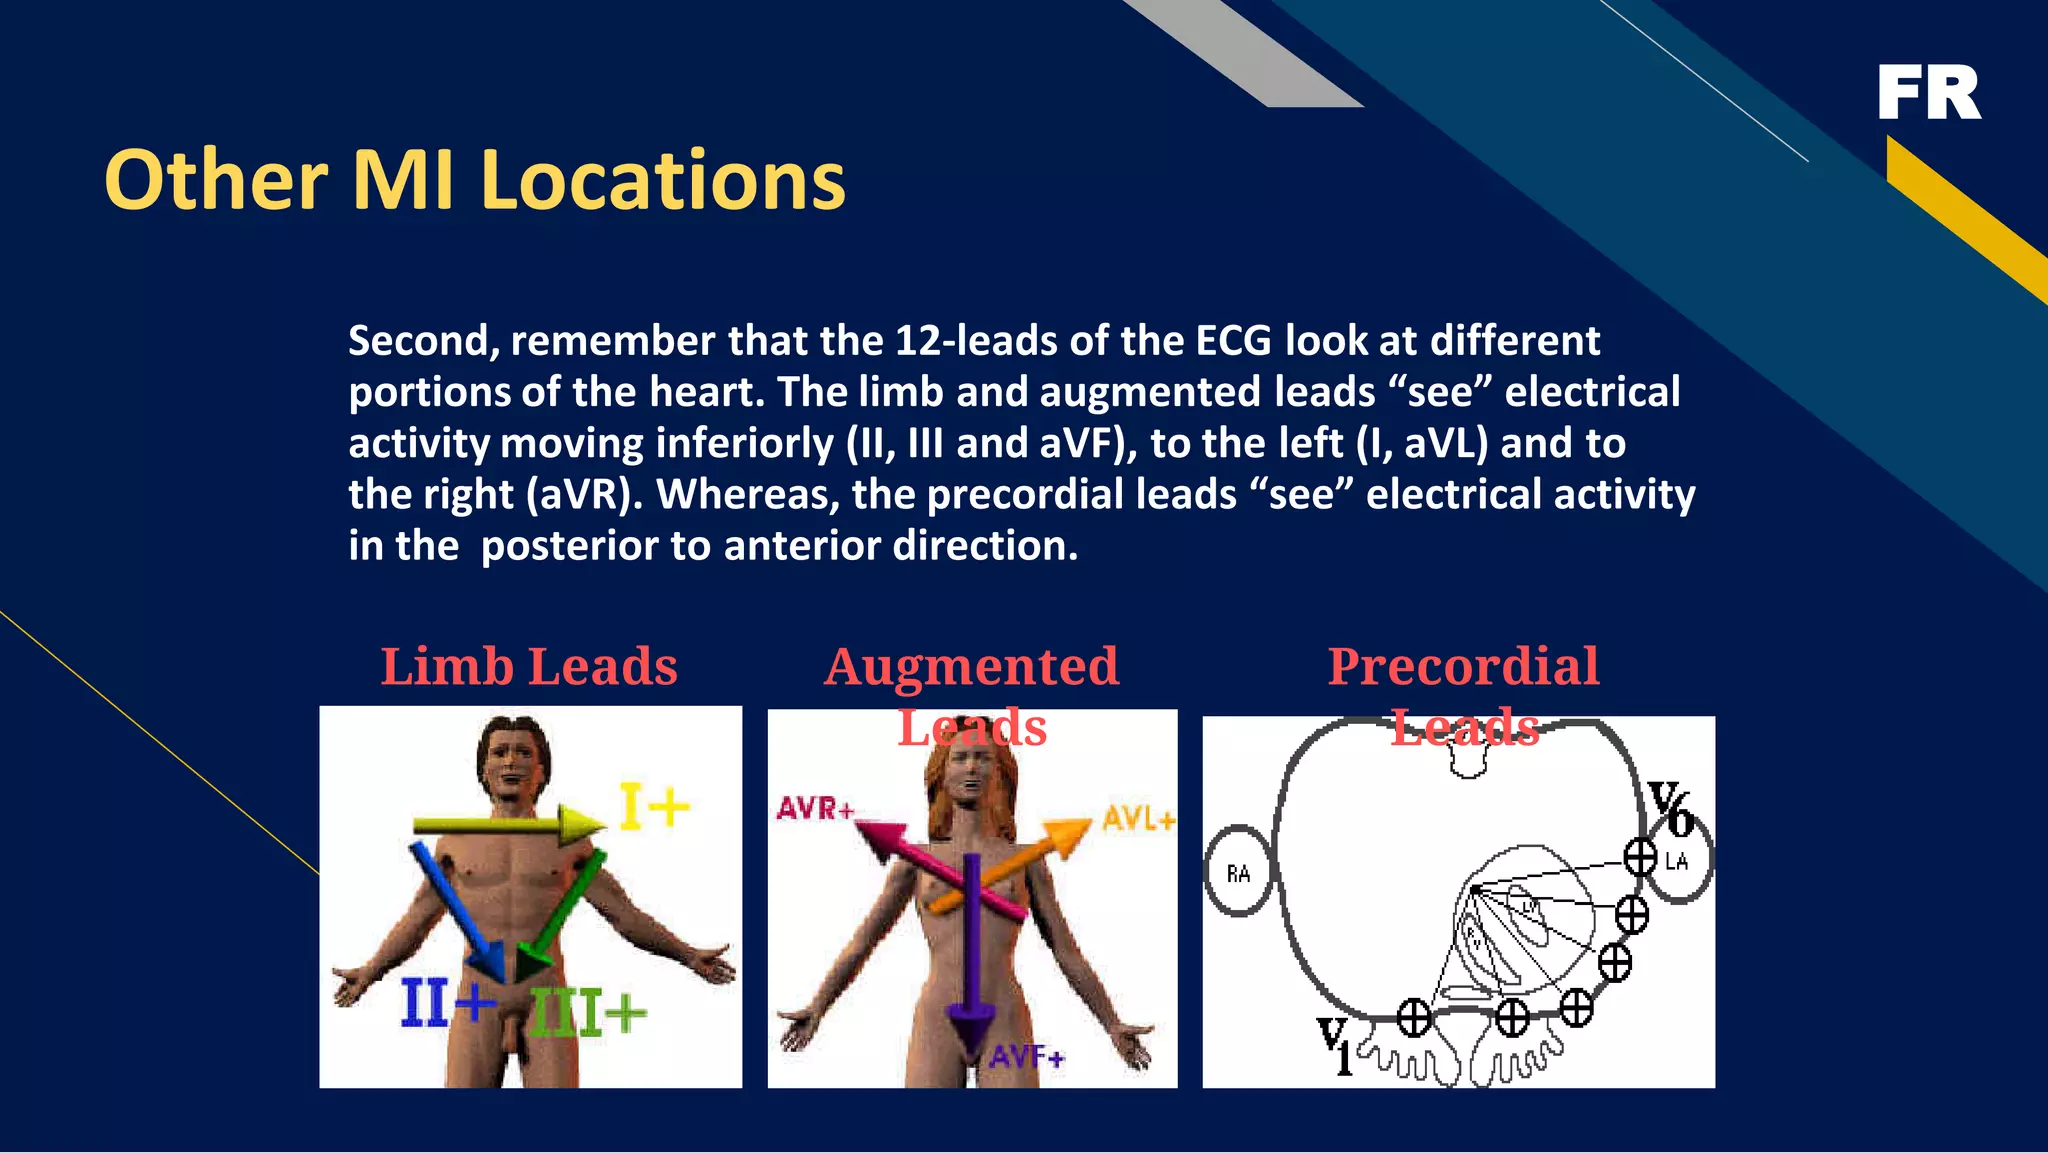
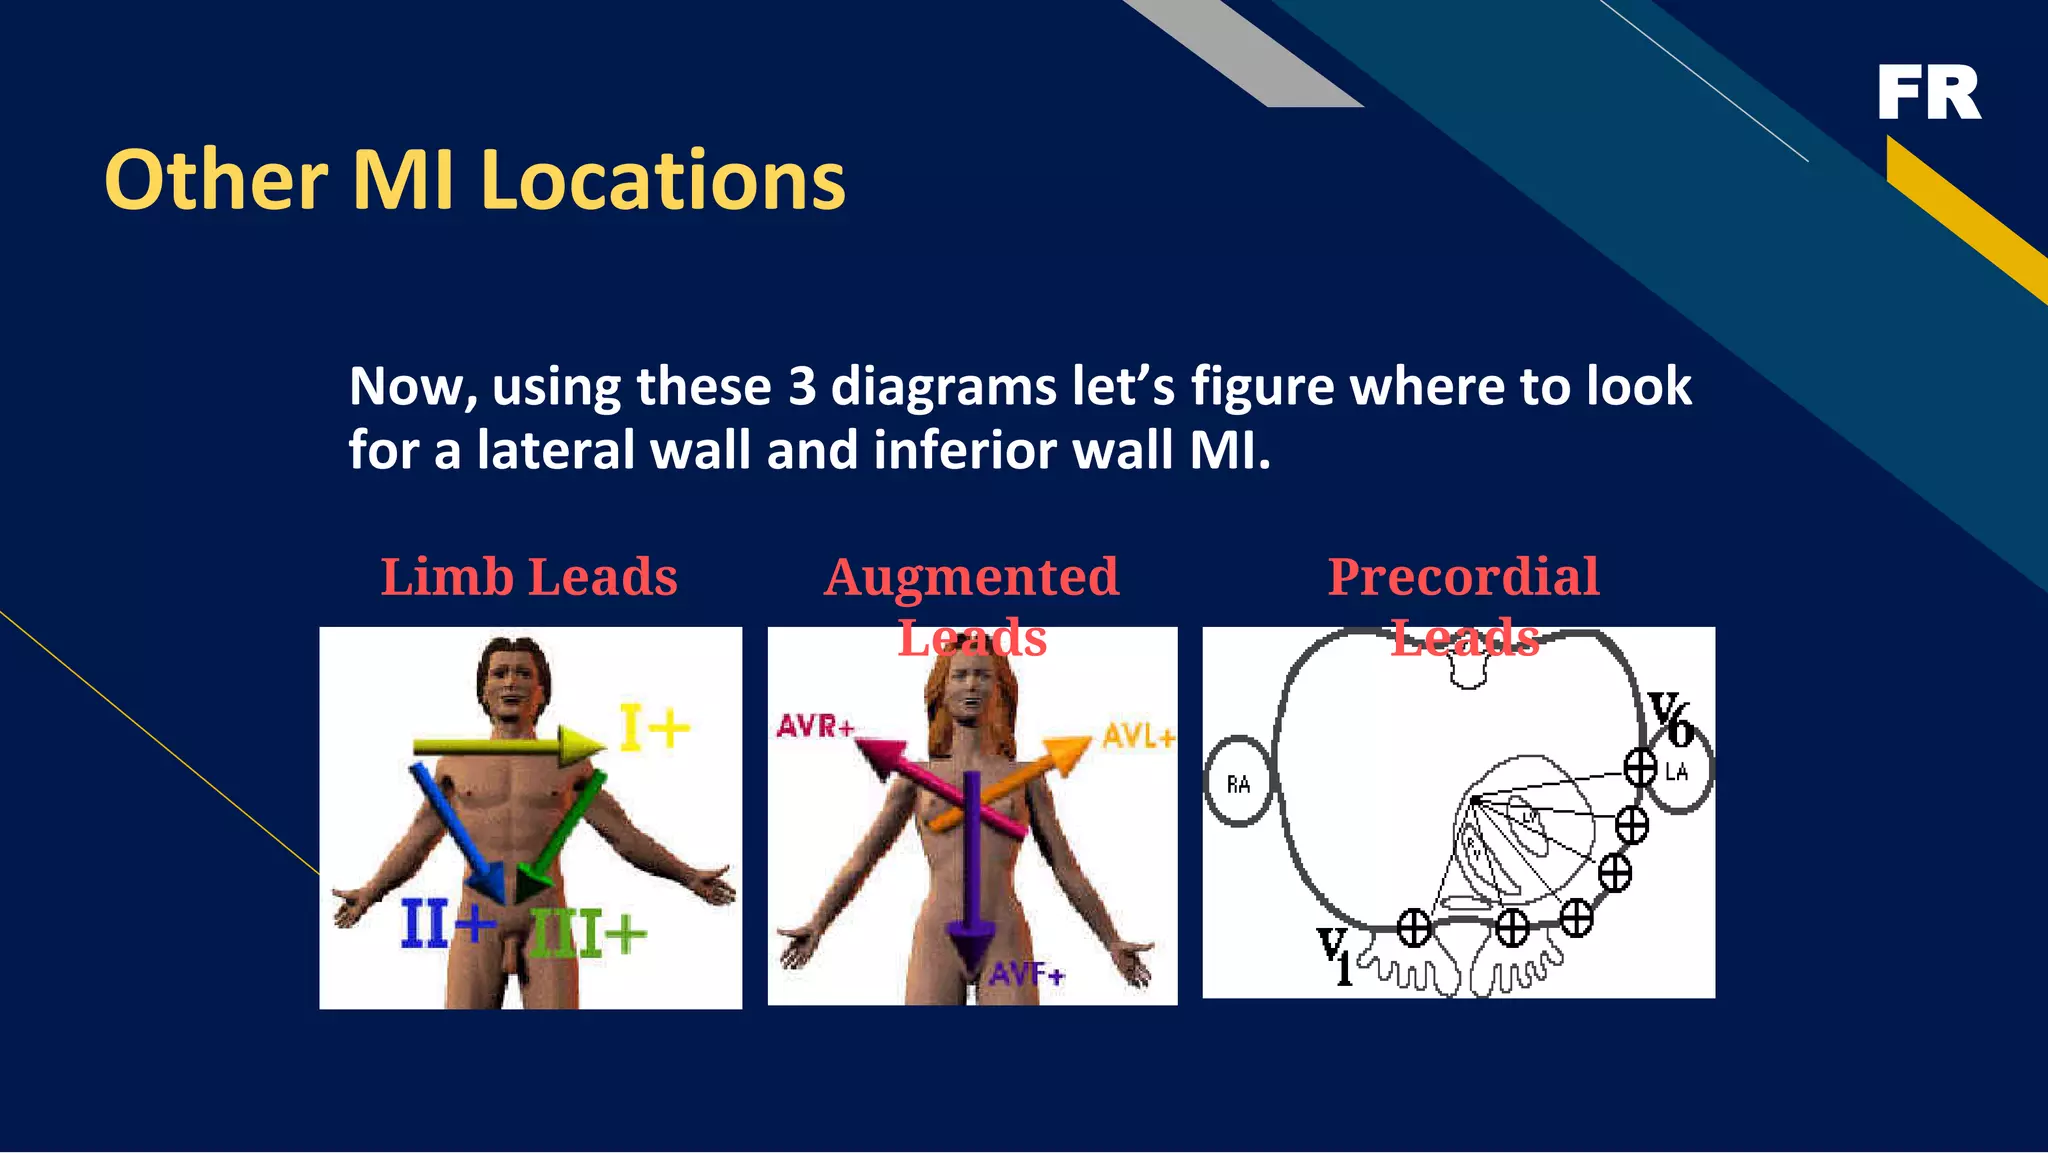
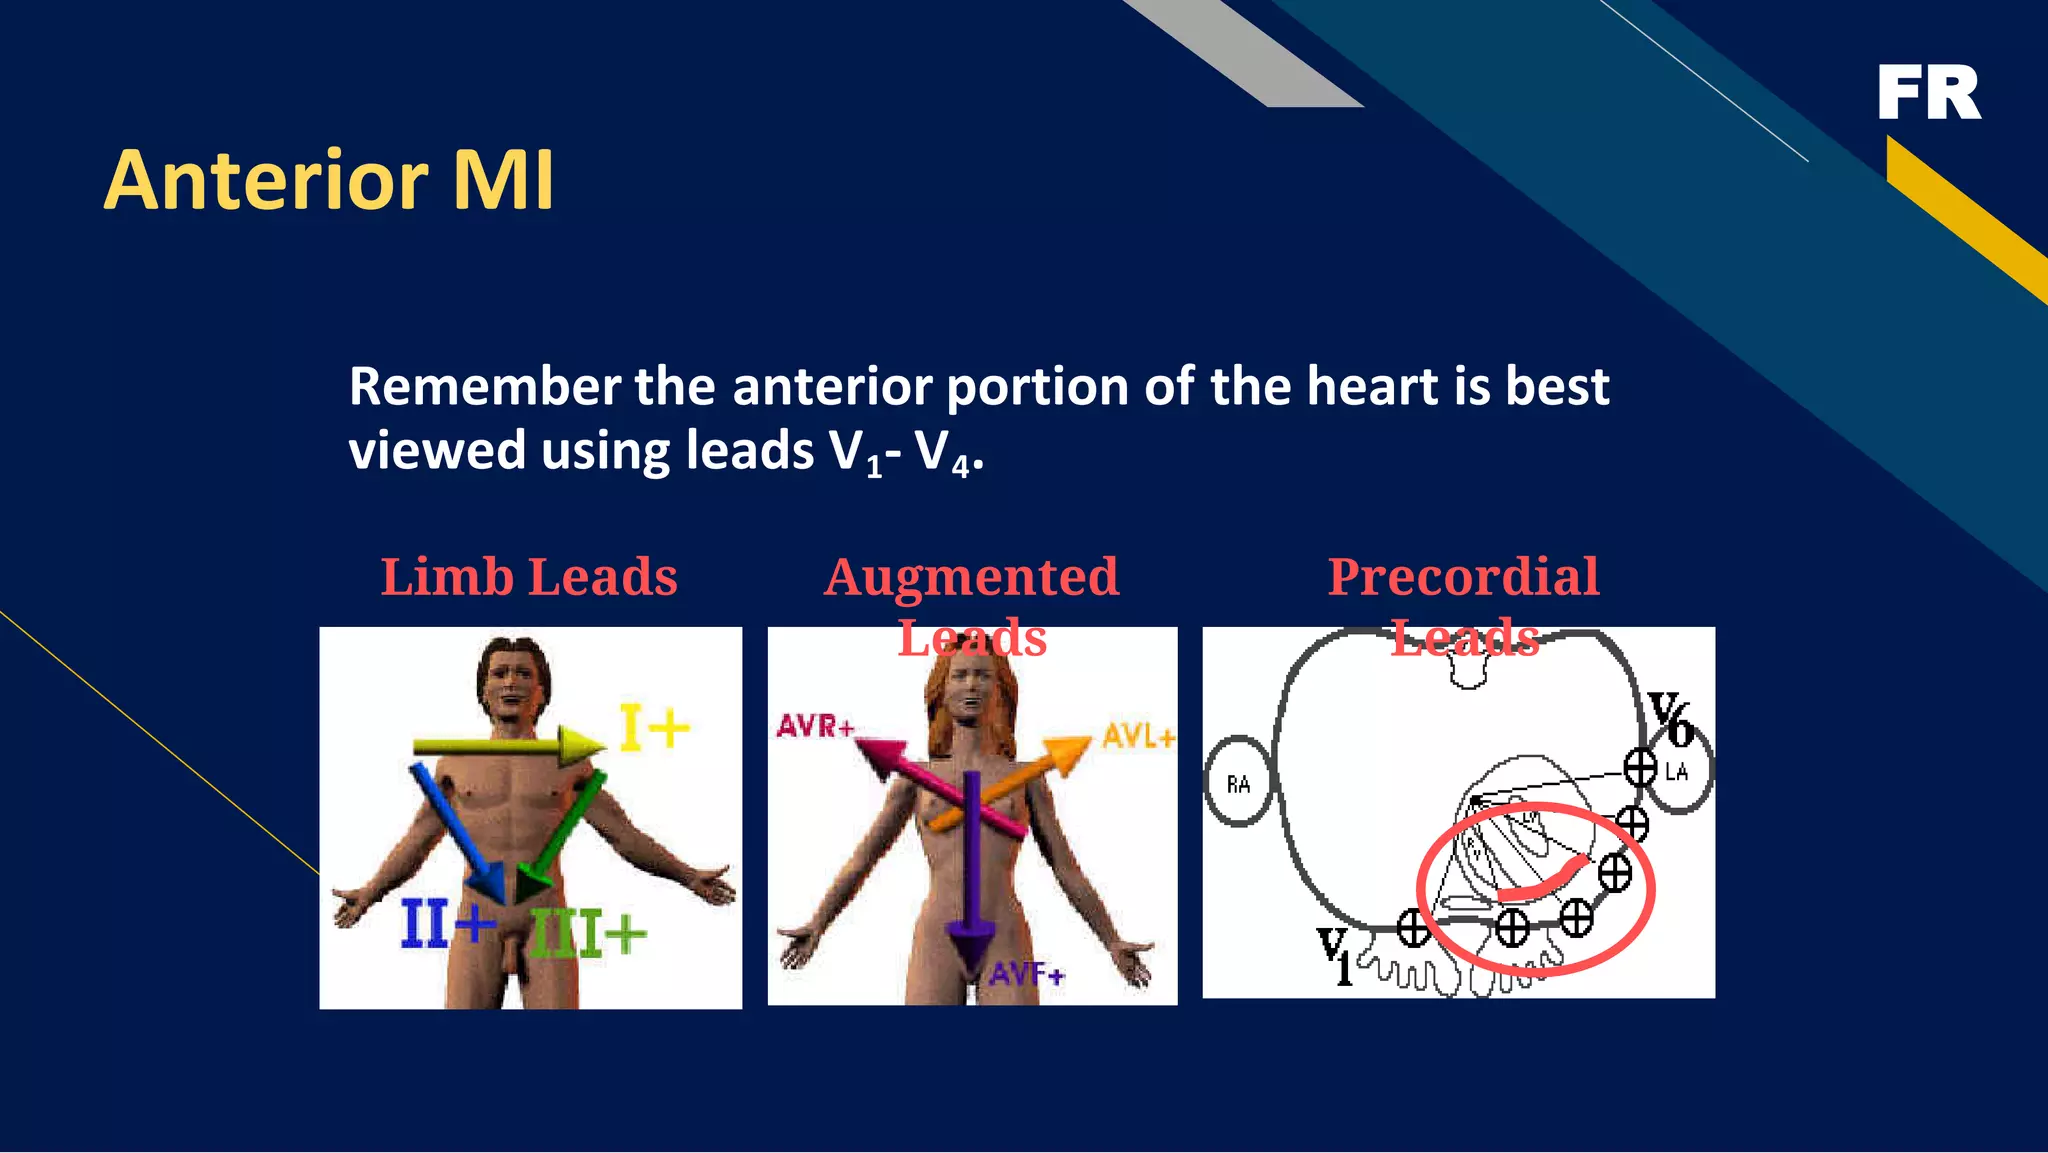


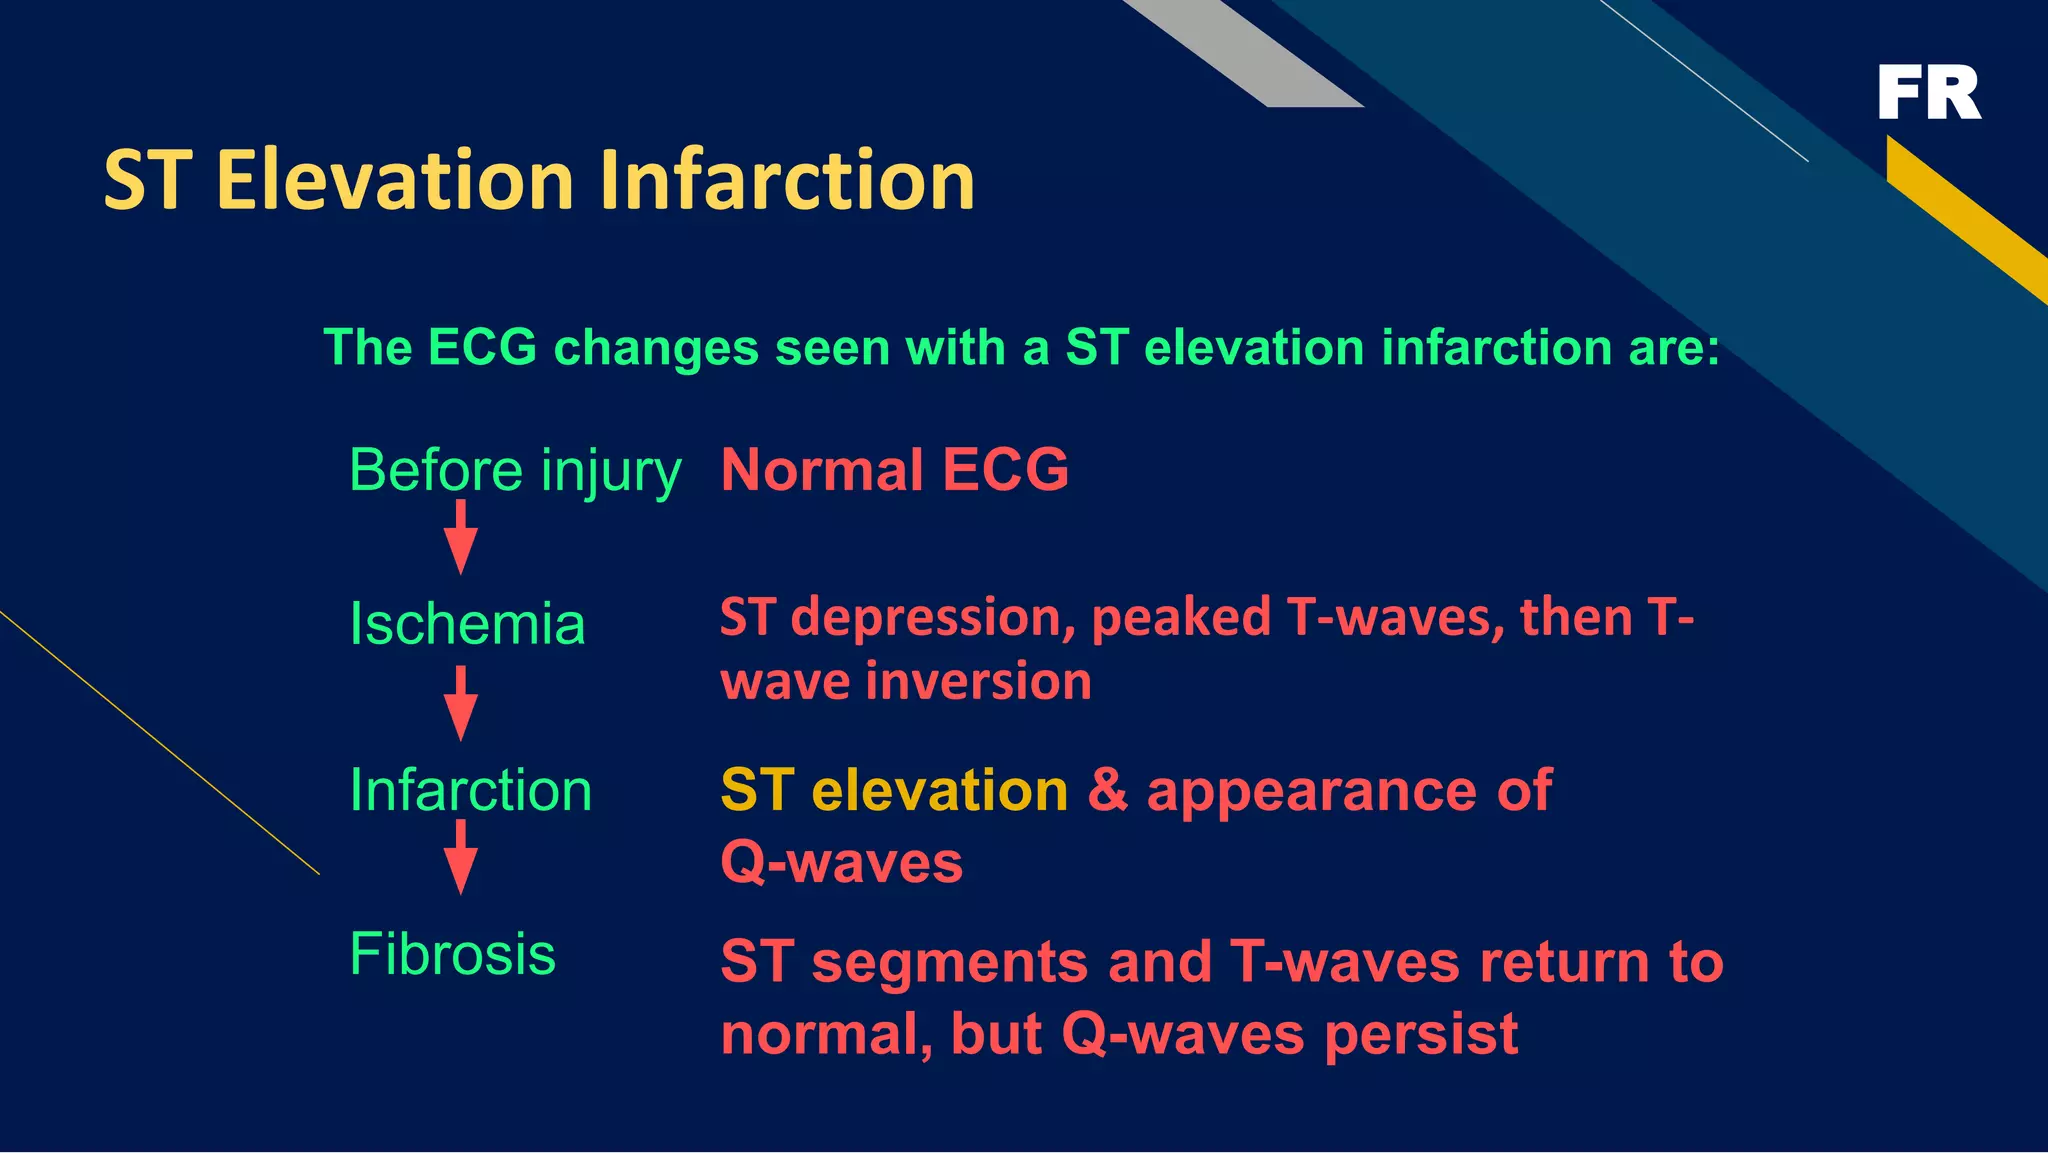
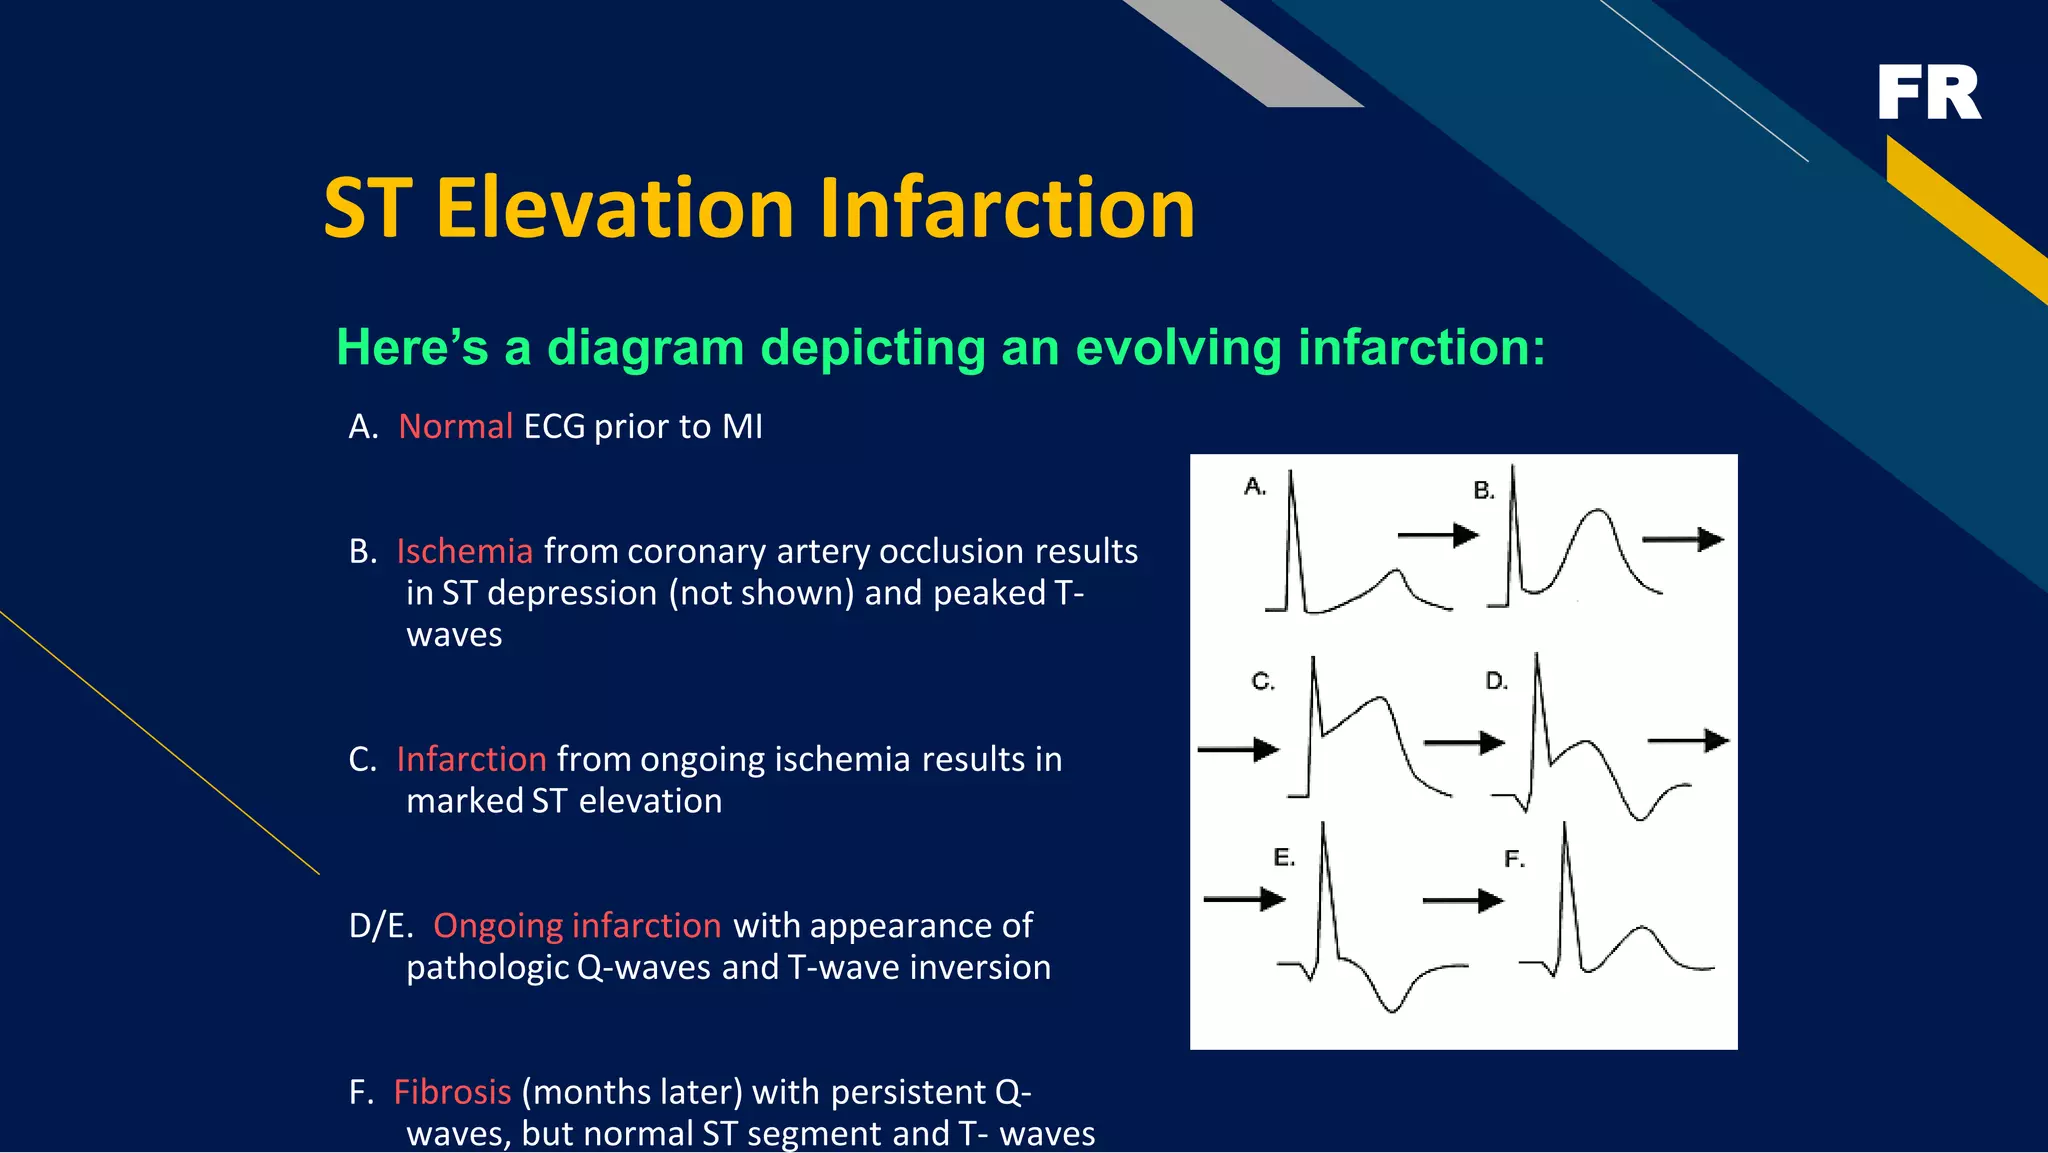
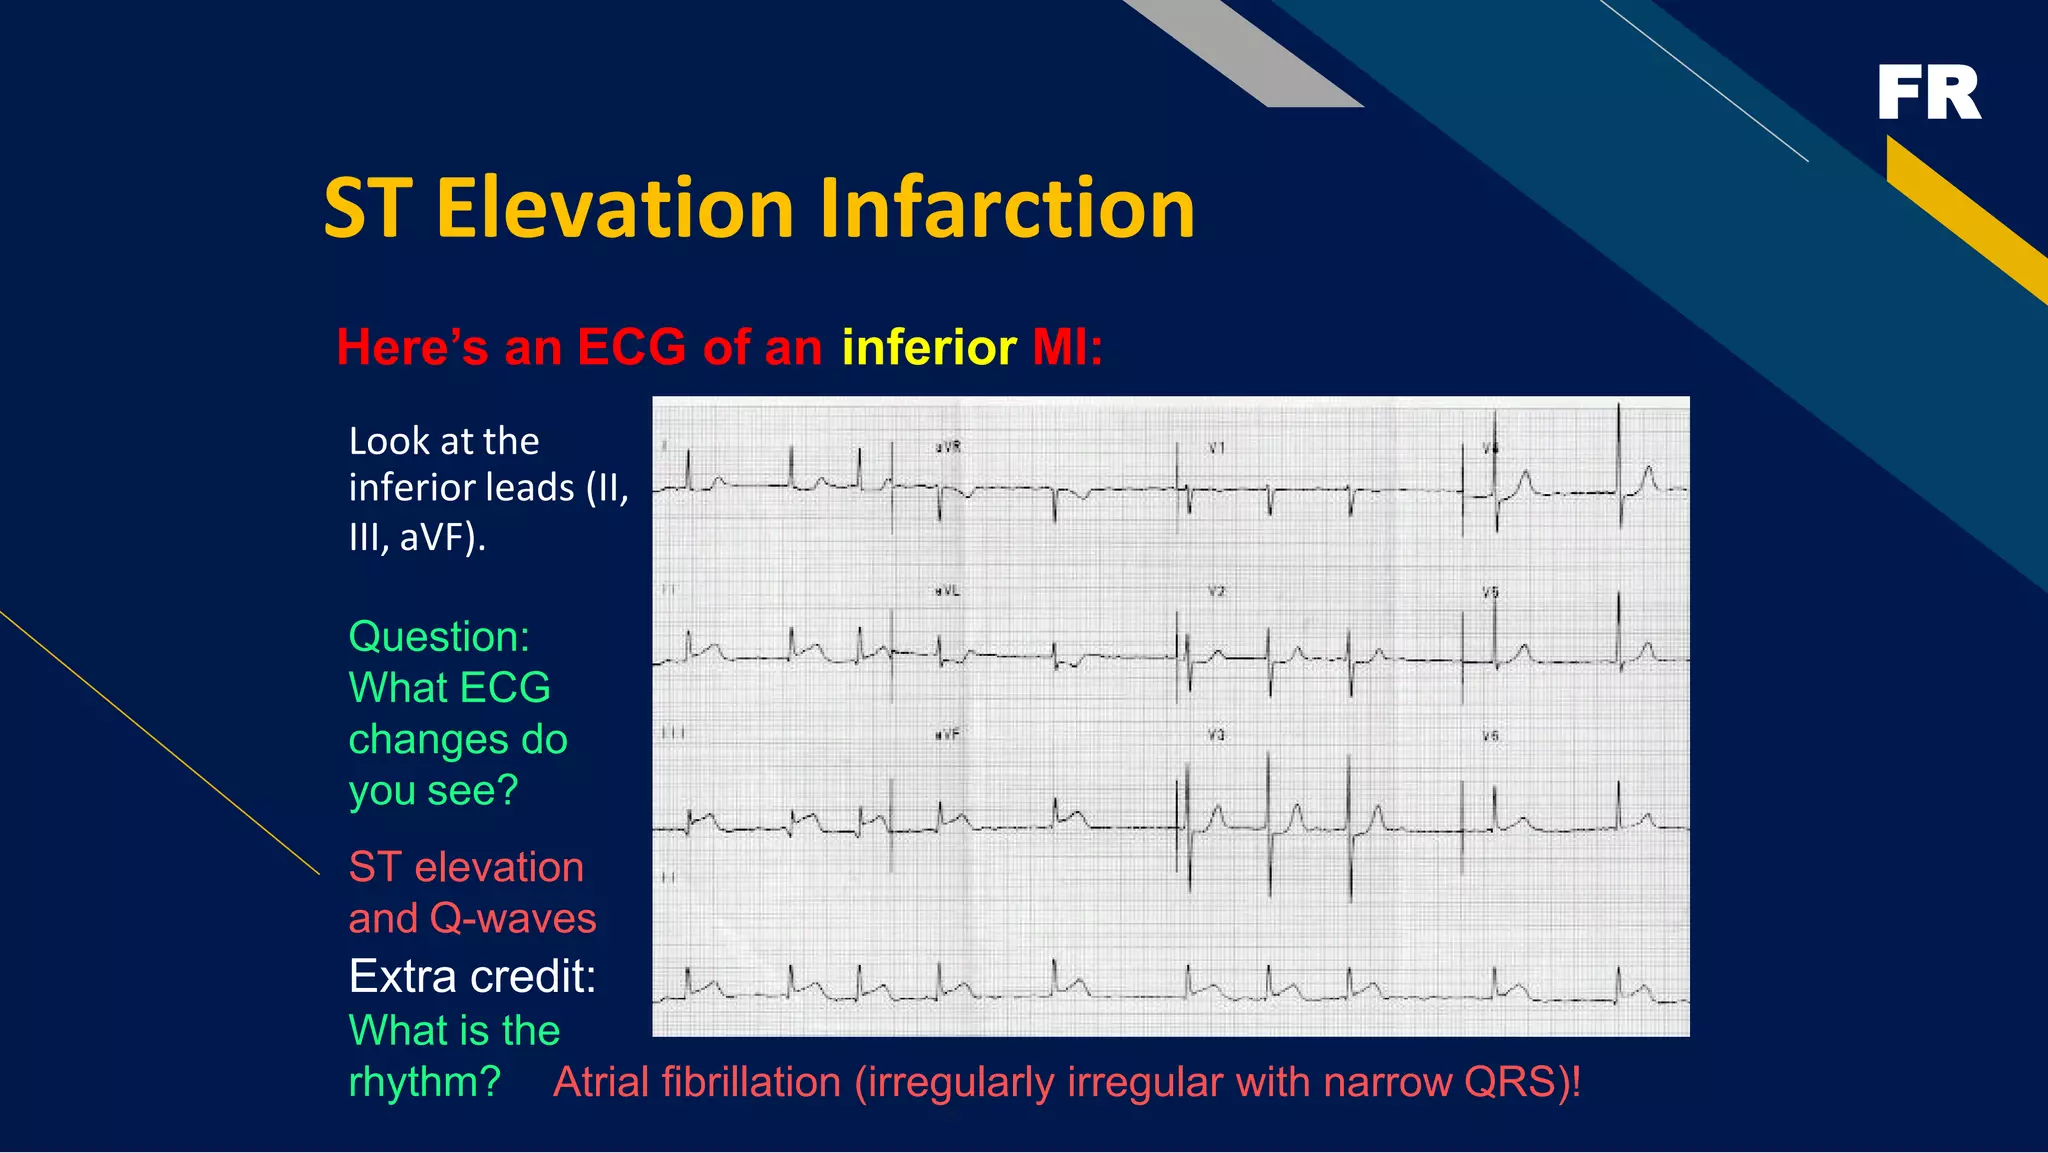
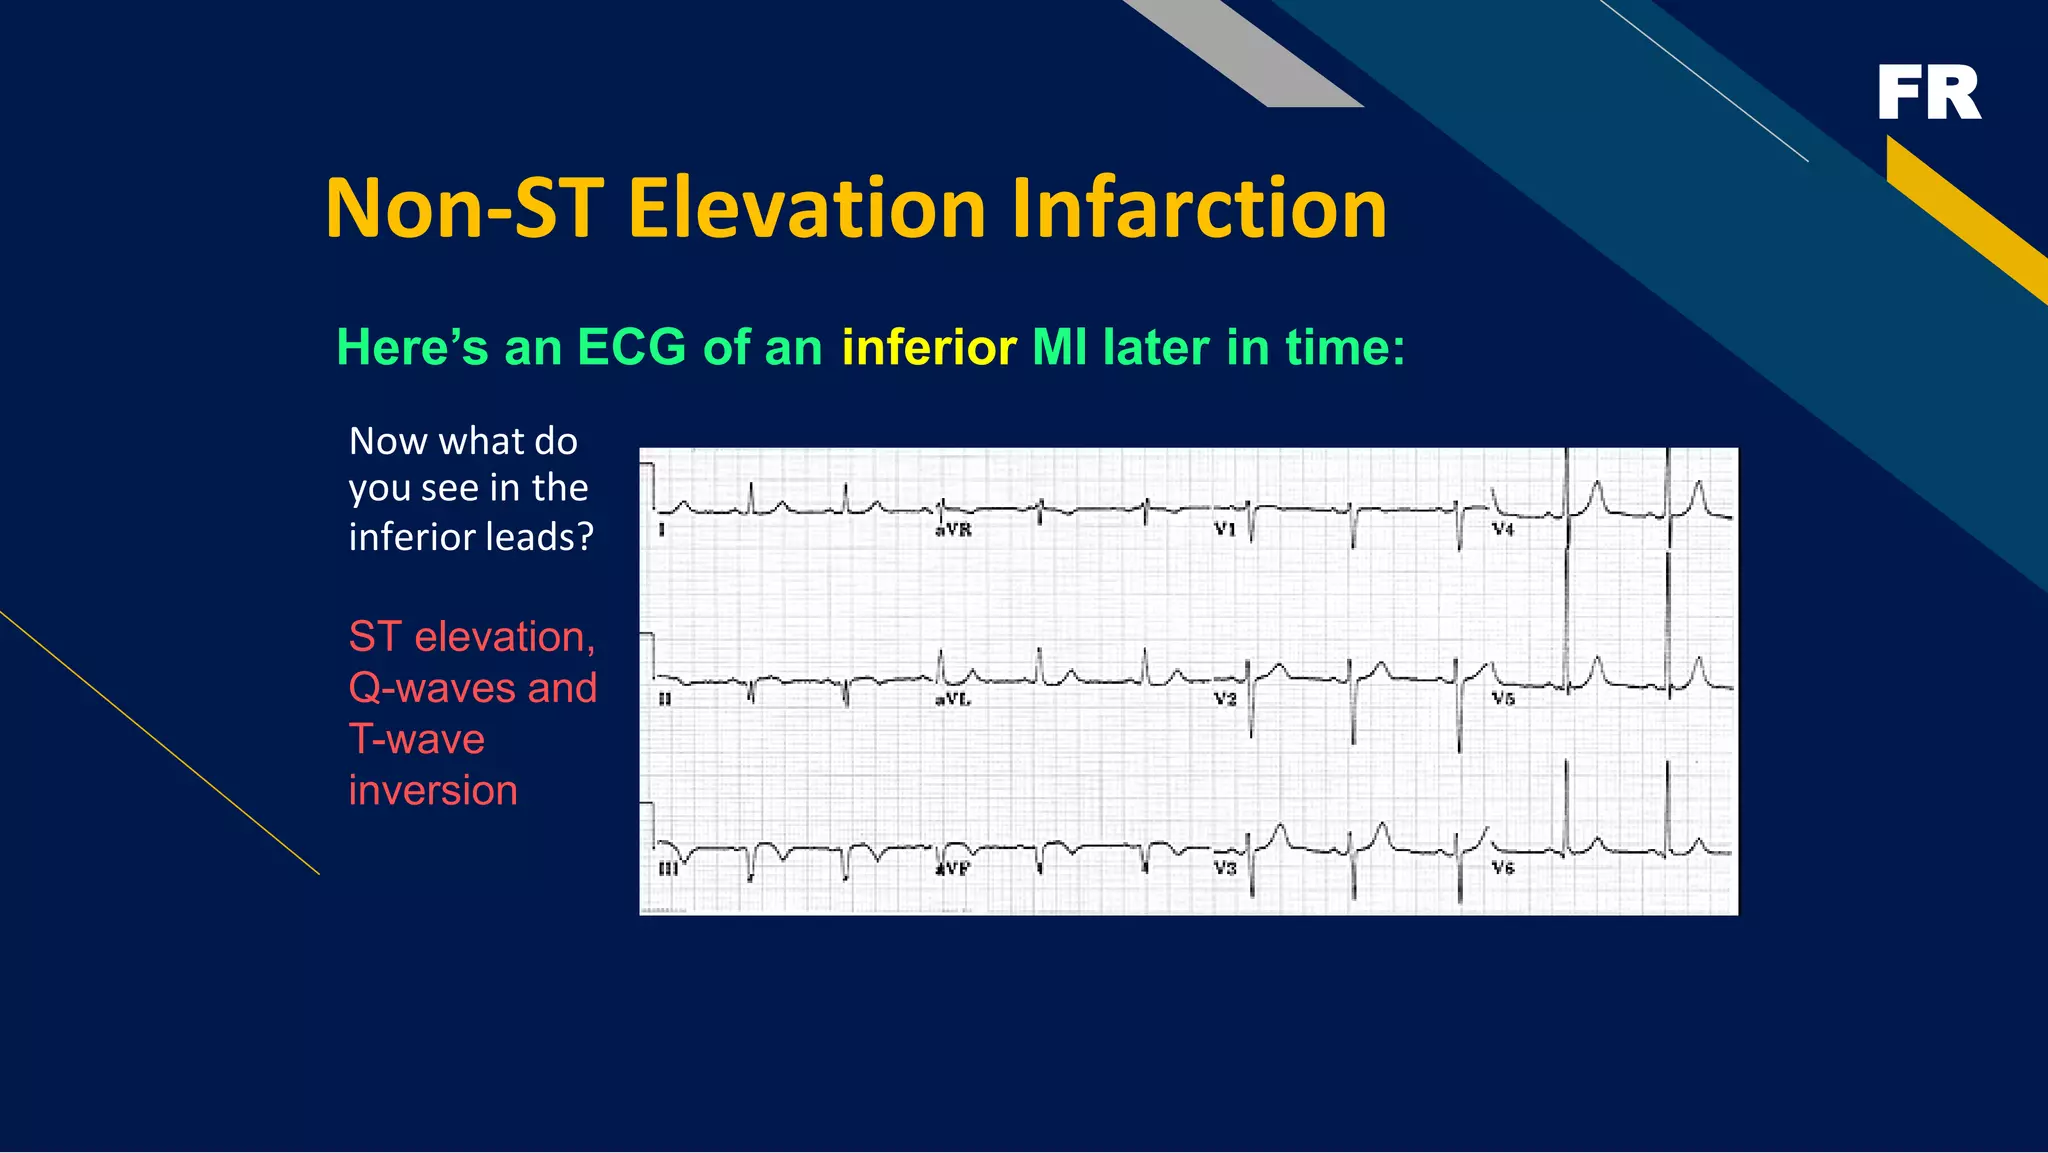
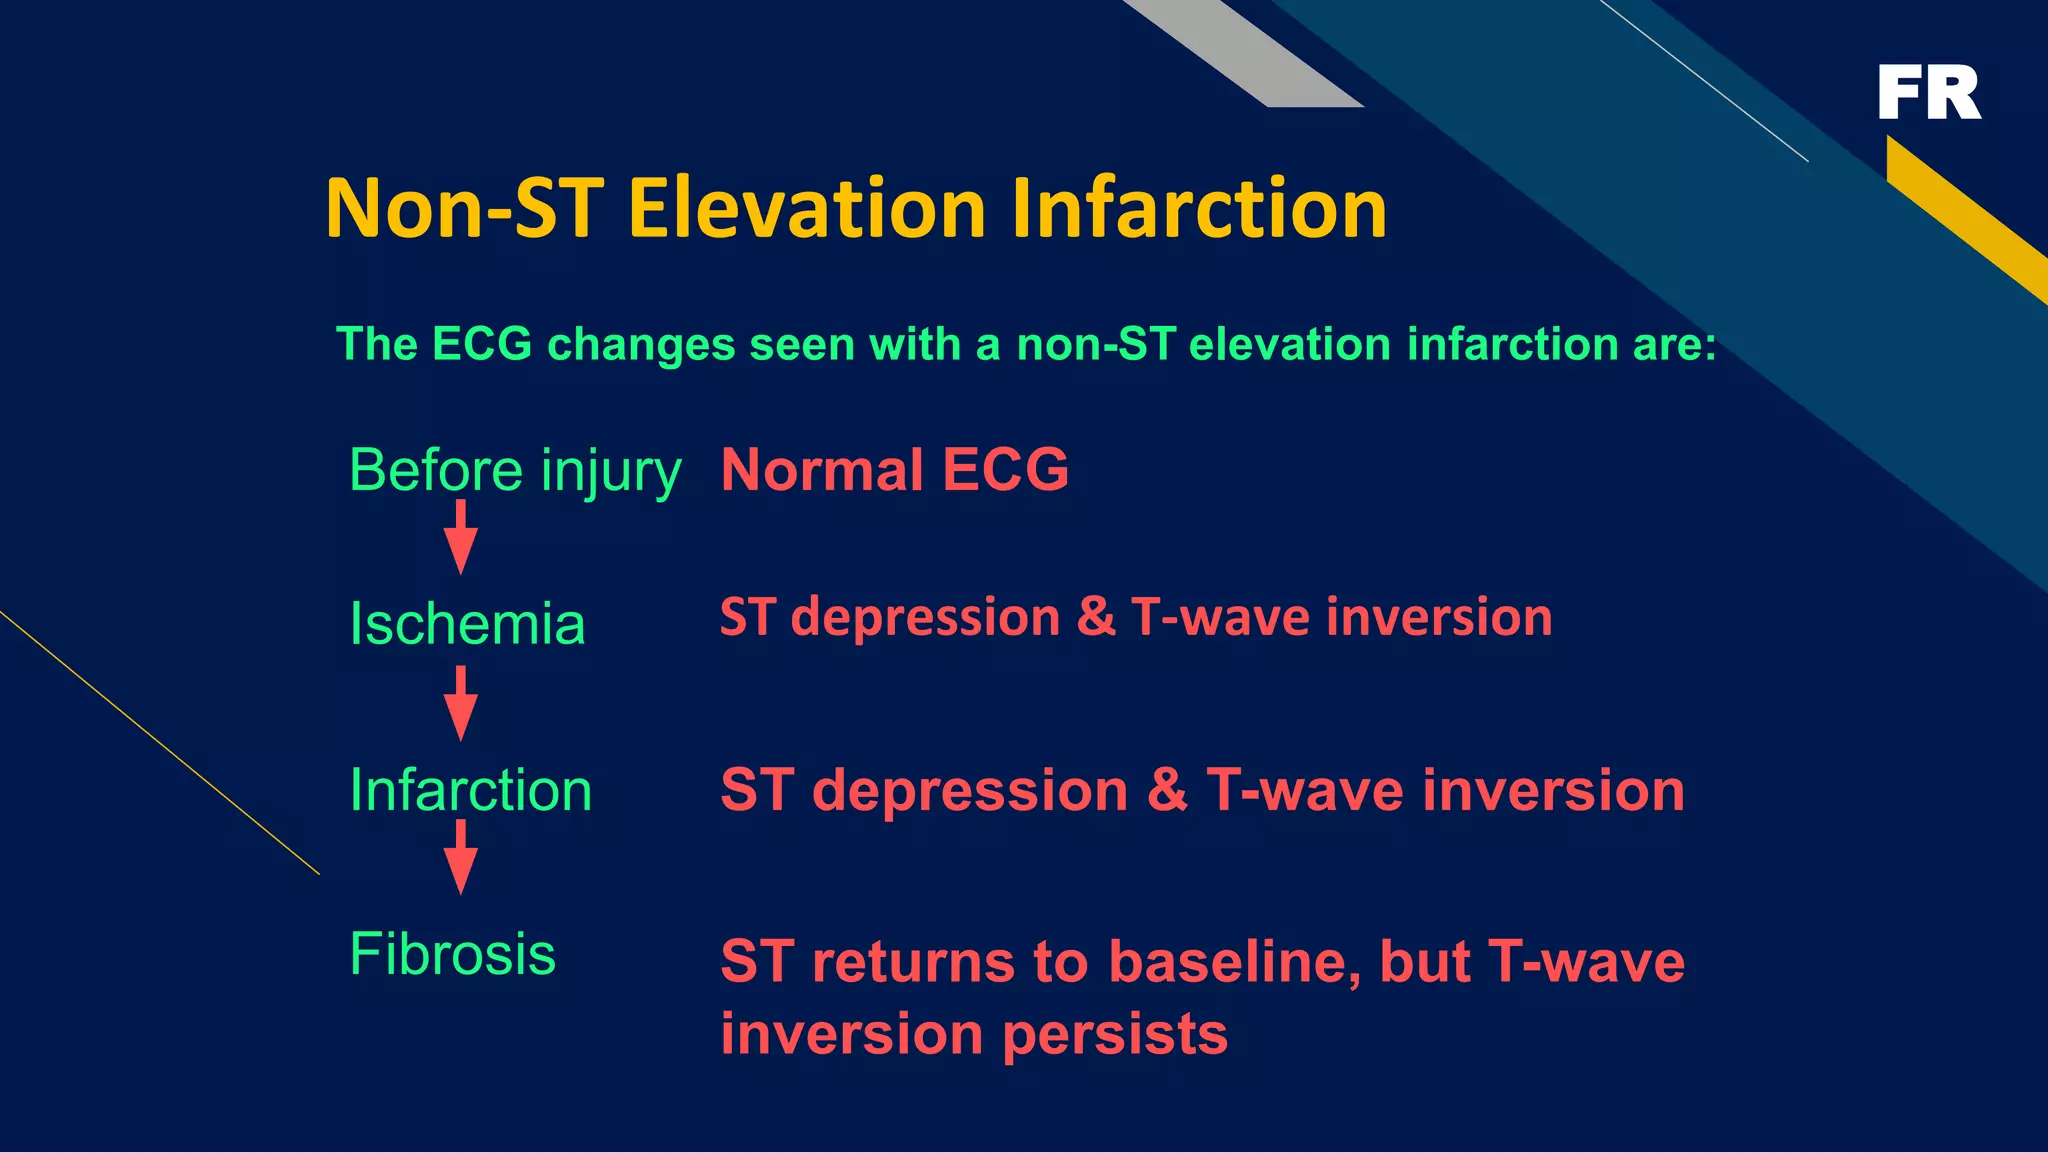
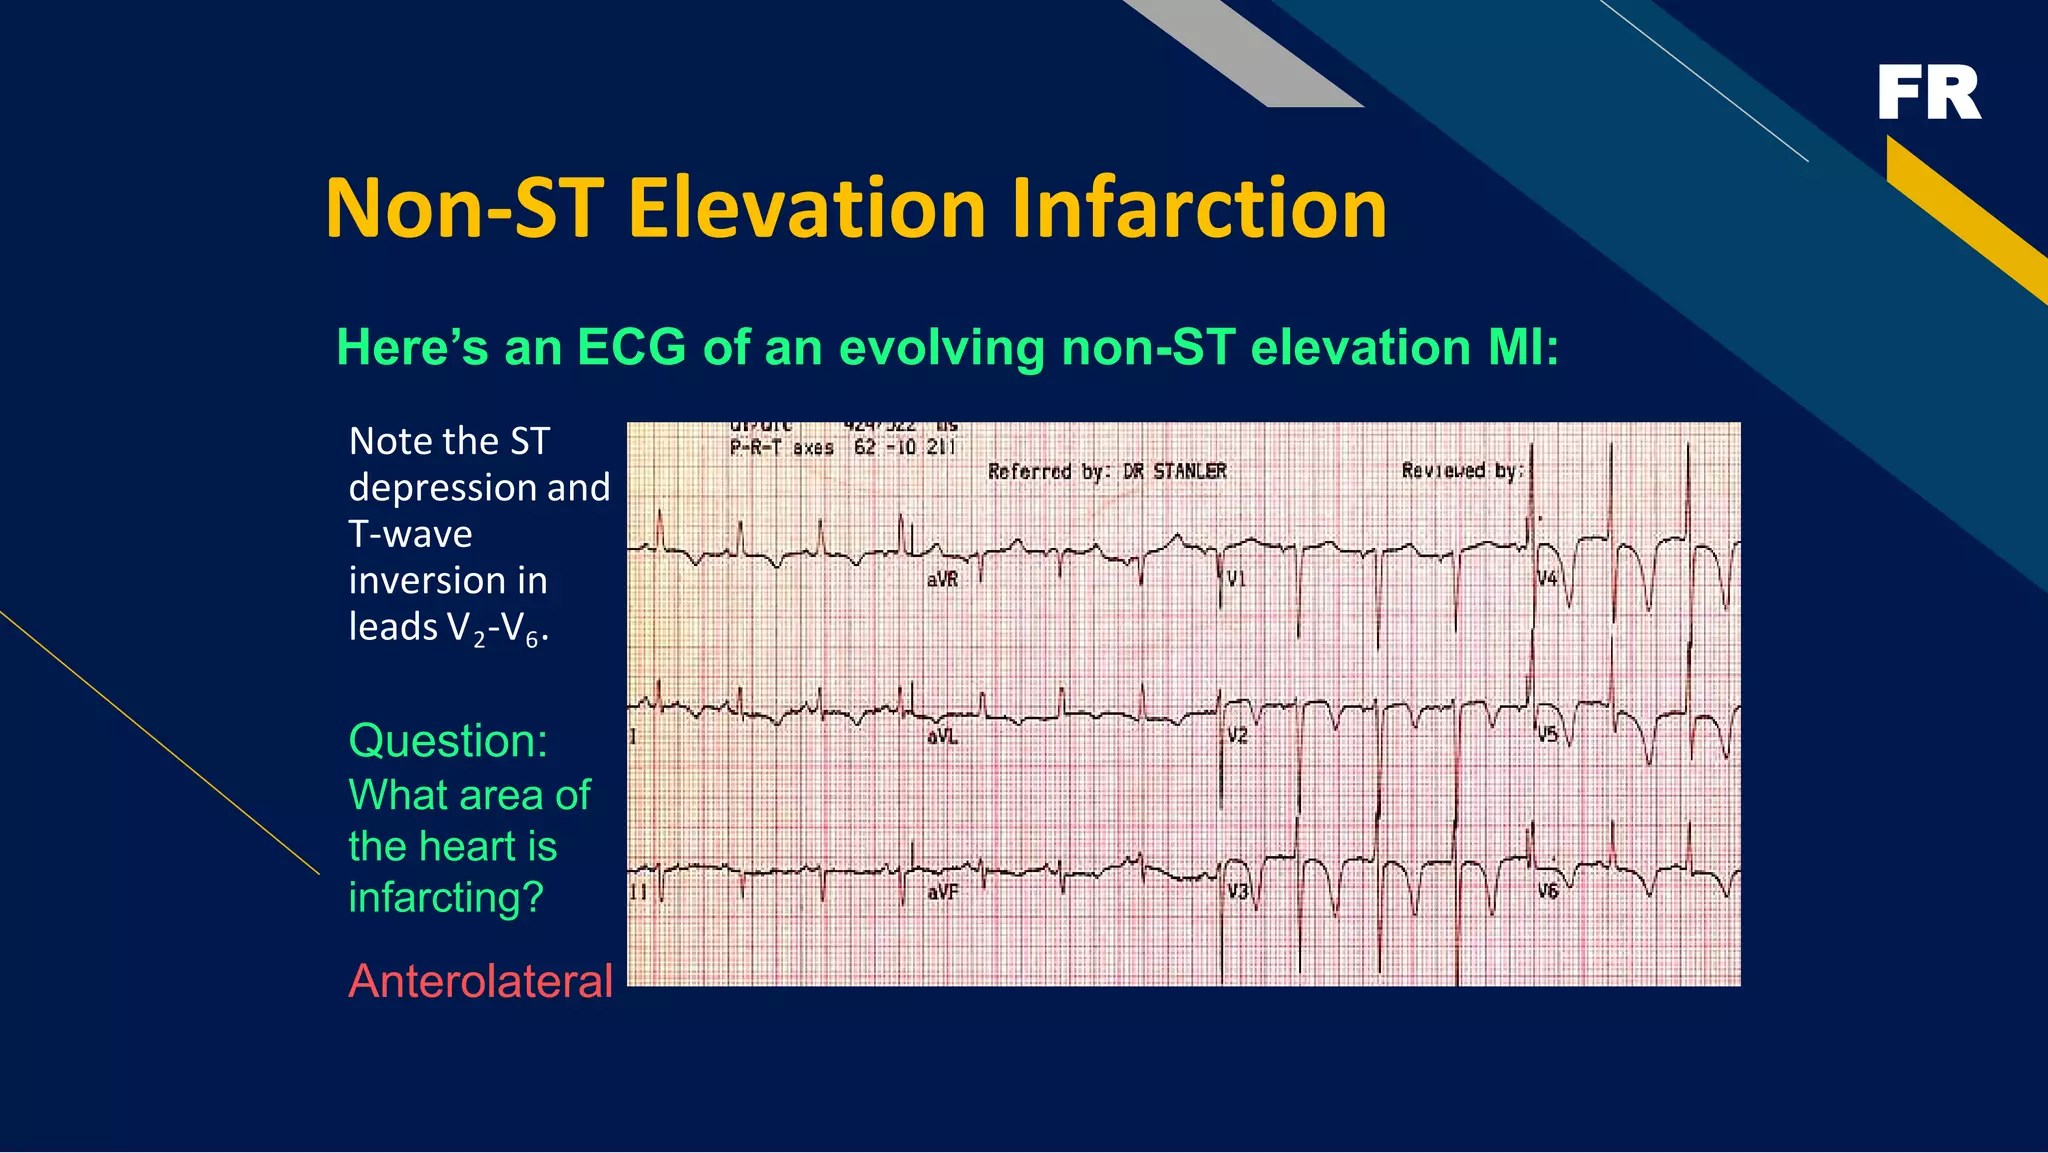
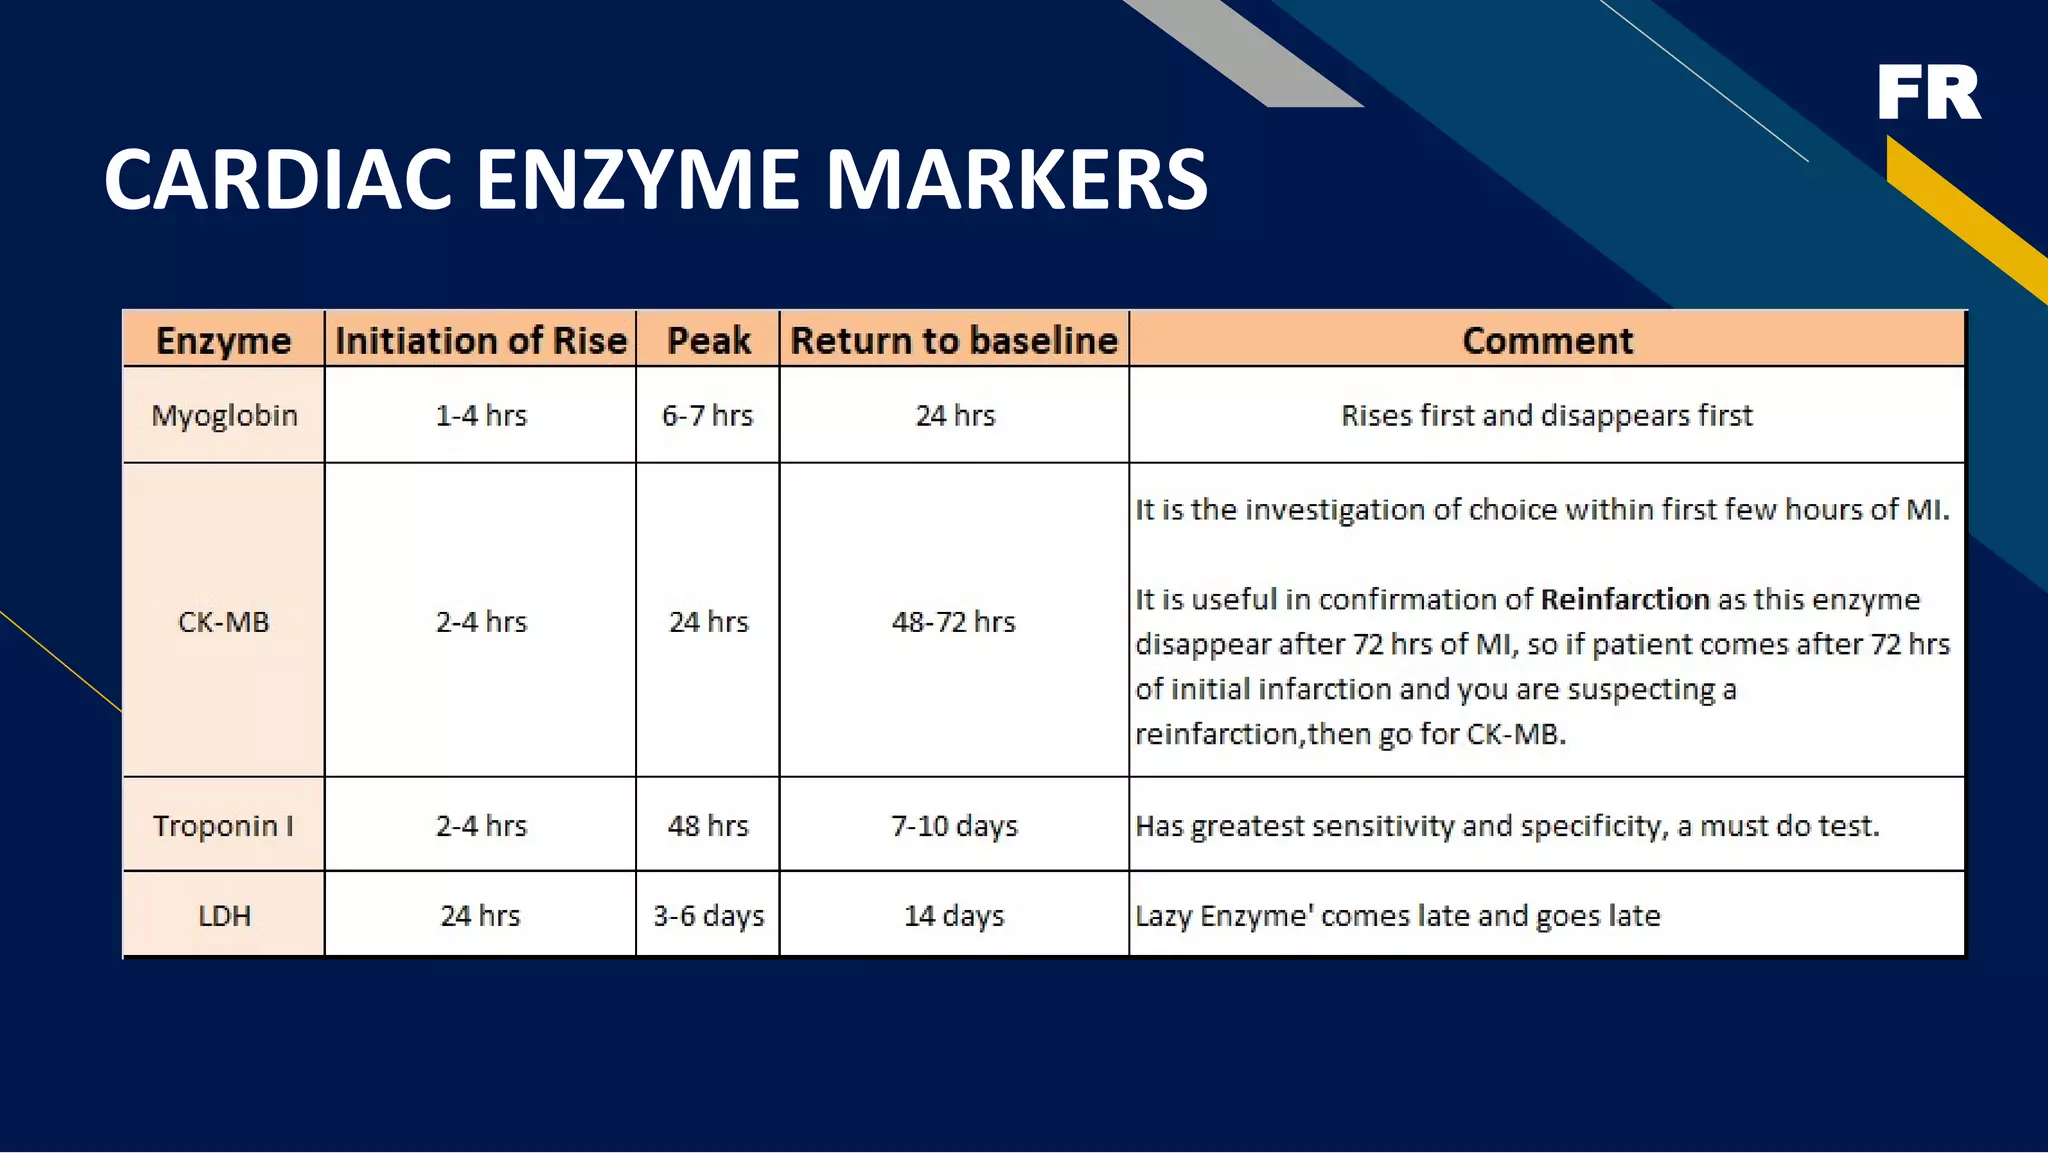
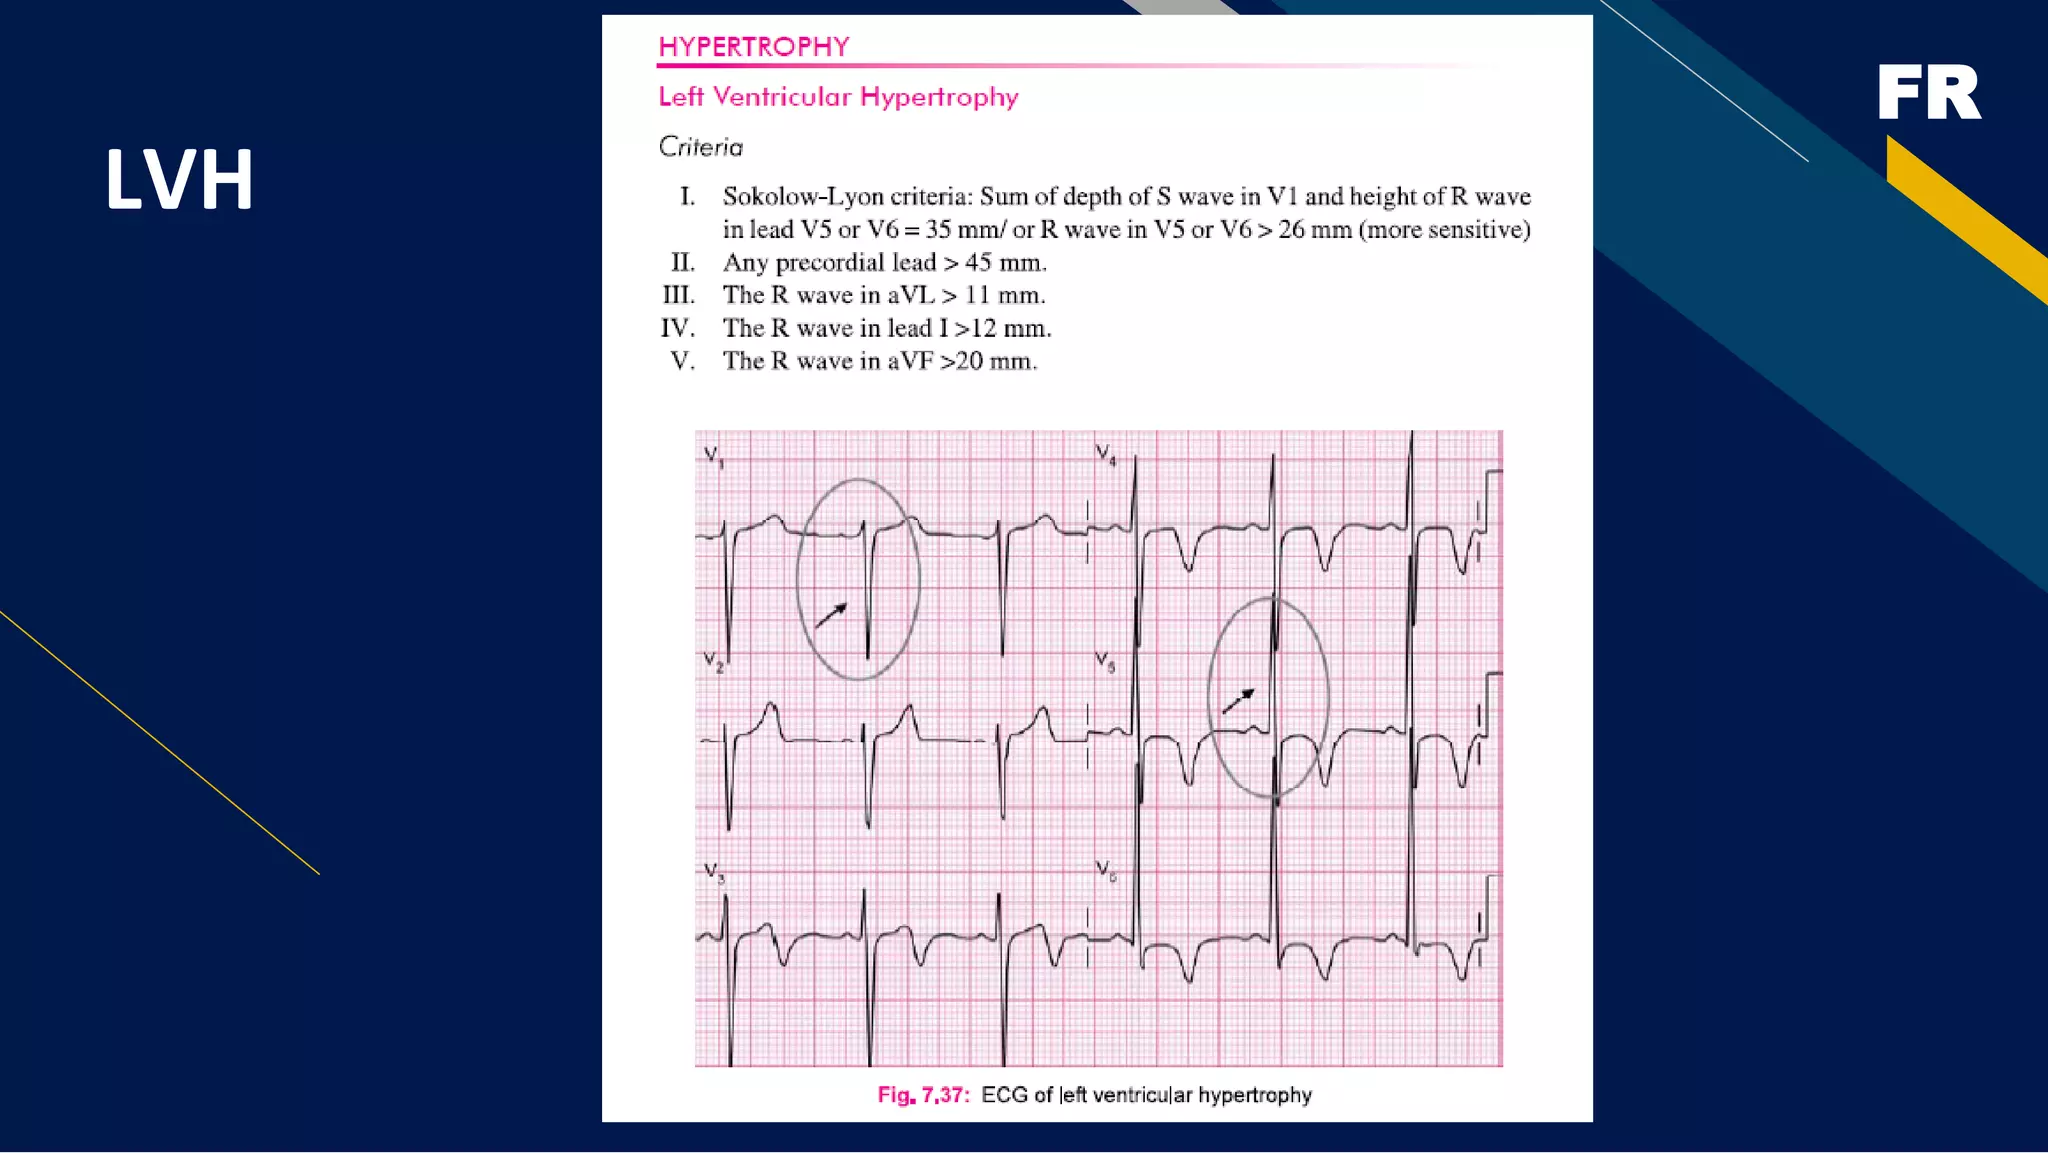


This document provides an overview of basics of electrocardiography (ECG) including anatomy and physiology of the heart, conduction system of the heart, blood flow through the heart, electrophysiology of the heart, components of the ECG complex, how to analyze rhythms like normal sinus rhythm and various arrhythmias, diagnosing myocardial infarction using 12-lead ECGs, and distinguishing between ST-elevation and non-ST-elevation myocardial infarctions. The document contains detailed information on interpreting ECGs and using 12-lead ECGs to locate the site of myocardial infarction.


