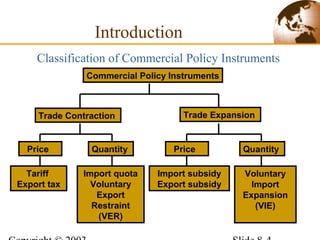
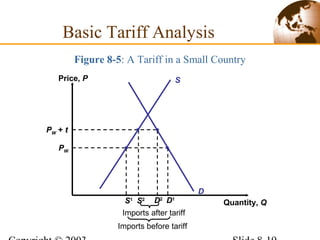
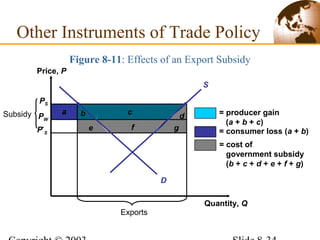
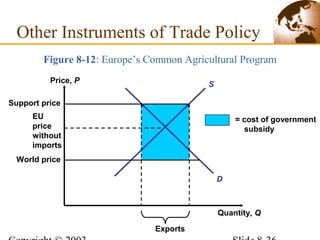
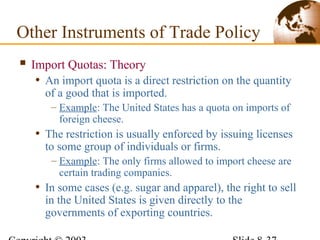
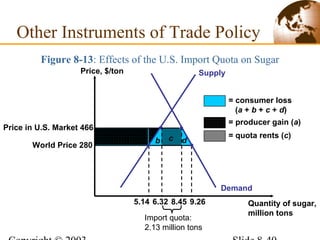
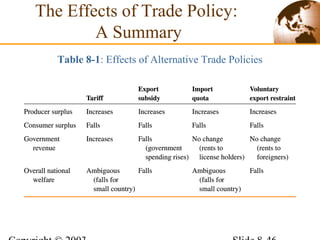
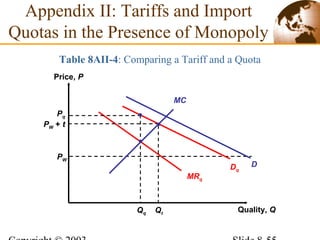
Chapter 8Chapter 8
The Instruments of Trade PolicyThe Instruments of Trade Policy
Prepared by Iordanis Petsas
To Accompany
International Economics: Theory and PolicyInternational Economics: Theory and Policy, Sixth Edition
by Paul R. Krugman and Maurice Obstfeld
 Introduction
 Basic Tariff Analysis
 Costs and Benefits of a Tariff
 Other Instruments of Trade Policy
 The Effects of Trade Policy: A Summary
 Summary
 Appendix I: Tariff Analysis in General Equilibrium
 Appendix II: Tariffs and Import Quotas in the
Presence of Monopoly
Chapter Organization
Introduction
 This chapter is focused on the following questions:
• What are the effects of various trade policy
instruments?
– Who will benefit and who will lose from these trade
policy instruments?
• What are the costs and benefits of protection?
– Will the benefits outweigh the costs?
• What should a nation’s trade policy be?
– For example, should the United States use a tariff or an
import quota to protect its automobile industry against
competition from Japan and South Korea?
Classification of Commercial Policy Instruments
Introduction
Commercial Policy Instruments
Trade Contraction Trade Expansion
Tariff
Export tax
Import quota
Voluntary
Export
Restraint
(VER)
Import subsidy
Export subsidy
Voluntary
Import
Expansion
(VIE)
Price Quantity Price Quantity
Basic Tariff Analysis
 Tariffs can be classified as:
• Specific tariffs
– Taxes that are levied as a fixed charge for each unit of
goods imported
– Example: A specific tariff of $10 on each imported bicycle
with an international price of $100 means that customs
officials collect the fixed sum of $10.
• Ad valorem tariffs
– Taxes that are levied as a fraction of the value of the
imported goods
– Example: A 20% ad valorem tariff on bicycles generates a
$20 payment on each $100 imported bicycle.
• A compound duty (tariff) is a combination of an ad valorem
and a specific tariff.
• Modern governments usually prefer to protect domestic
industries through a variety of nontariff barriers, such as:
– Import quotas
– Limit the quantity of imports
– Export restraints
– Limit the quantity of exports
Basic Tariff Analysis
 Supply, Demand, and Trade in a Single Industry
• Suppose that there are two countries (Home and
Foreign).
• Both countries consume and produce wheat, which can
be costless transported between the countries.
• In each country, wheat is a competitive industry.
• Suppose that in the absence of trade the price of wheat
at Home exceeds the corresponding price at Foreign.
– This implies that shippers begin to move wheat from
Foreign to Home.
– The export of wheat raises its price in Foreign and lowers its
price in Home until the initial difference in prices has been
eliminated.
Basic Tariff Analysis
 To determine the world price (Pw) and the quantity
trade (Qw), two curves are defined:
• Home import demand curve
– Shows the maximum quantity of imports the Home
country would like to consume at each price of the
imported good.
– That is, the excess of what Home consumers demand over
what Home producers supply: MD = D(P) – S(P)
• Foreign export supply curve
– Shows the maximum quantity of exports Foreign would
like to provide the rest of the world at each price.
– That is, the excess of what Foreign producers supply over
what foreign consumers demand: XS = S*(P*) – D*(P*)
Basic Tariff Analysis
Quantity, Q
Price, PPrice, P
Quantity, Q
MD
D
S
A
PA
P2
P1
S2 D2
D2
– S2
2
S1
D1
D1
– S1
1
Figure 8-1: Deriving Home’s Import Demand Curve
Basic Tariff Analysis
 Properties of the import demand curve:
• It intersects the vertical axis at the closed economy
price of the importing country.
• It is downward sloping.
• It is flatter than the domestic demand curve in the
importing country.
Basic Tariff Analysis
P2
P*
A
D*
S*
P1
XS
Price, P Price, P
Quantity, Q Quantity, QS*2
– D*2
S*2
D*2
Figure 8-2: Deriving Foreign’s Export Supply Curve
Basic Tariff Analysis
D*1
S*1
S*1
– D*1
 Properties of the export supply curve:
• It intersects the vertical axis at the closed economy
price of the exporting country.
• It is upward sloping.
• It is flatter that the domestic supply curve in the
exporting country.
Basic Tariff Analysis
Figure 8-3: World Equilibrium
XS
Price, P
Quantity, Q
MD
PW
QW
1
Basic Tariff Analysis
 Useful definitions:
• The terms of trade is the relative price of the
exportable good expressed in units of the importable
good.
• A small country is a country that cannot affect its
terms of trade no matter how much it trades with the
rest of the world.
 The analytical framework will be based on either of
the following:
• Two large countries trading with each other
• A small country trading with the rest of the world
Basic Tariff Analysis
 Effects of a Tariff
• Assume that two large countries trade with each other.
• Suppose Home imposes a tax of $2 on every bushel of
wheat imported.
– Then shippers will be unwilling to move the wheat
unless the price difference between the two markets is at
least $2.
• Figure 8-4 illustrates the effects of a specific tariff of
$t per unit of wheat.
Basic Tariff Analysis
XS
PT
MD
D*
S*
D
S
PW
2
QT
1
QW
Basic Tariff Analysis
Figure 8-4: Effects of a Tariff
P*
T
3
t
Price, P
Quantity, Q
Price, P
Quantity, Q
Price, P
Quantity, Q
Home market World market Foreign marketHome market World market Foreign market
• In the absence of tariff, the world price of wheat (Pw)
would be equalized in both countries.
• With the tariff in place, the price of wheat rises to PT at
Home and falls to P*T (= PT – t) at Foreign until the price
difference is $t.
– In Home: producers supply more and consumers demand
less due to the higher price, so that fewer imports are
demanded.
– In Foreign: producers supply less and consumers demand
more due to the lower price, so that fewer exports are
supplied.
– Thus, the volume of wheat traded declines due to the
imposition of the tariff.
Basic Tariff Analysis
• The increase in the domestic Home price is less
than the tariff, because part of the tariff is reflected
in a decline in Foreign’ s export price.
– If Home is a small country and imposes a tariff, the
foreign export prices are unaffected and the
domestic price at Home (the importing country)
rises by the full amount of the tariff.
Basic Tariff Analysis
Figure 8-5: A Tariff in a Small Country
SPrice, P
Quantity, Q
D
PW + t
PW
Imports after tariff
S1 D1
Imports before tariff
D2
S2
Basic Tariff Analysis
 Measuring the Amount of Protection
• In analyzing trade policy in practice, it is important
to know how much protection a trade policy
actually provides.
– One can express the amount of protection as a
percentage of the price that would prevail under free
trade.
– Two problems arise from this method of measurement:
» In the large country case, the tariff will lower the foreign
export price.
» Tariffs may have different effects on different stages of
production of a good.
Basic Tariff Analysis
 Effective rate of protection
• One must consider both the effects of tariffs on the
final price of a good, and the effects of tariffs on the
costs of inputs used in production.
– The actual protection provided by a tariff will not equal
the tariff rate if imported intermediate goods are used in
the production of the protected good.
– Example: A European airplane that sells for $50 million has
cost $60 million to produce. Half of the purchase price of the
aircraft represents the cost of components purchased from
other countries. A subsidy of $10 million from the European
government cuts the cost of the value added to purchasers of
the airplane from $30 to $20 million. Thus, the effective rate
of protection is (30-20)/20 = 50%.
Basic Tariff Analysis
Costs and Benefits of a Tariff
 A tariff raises the price of a good in the importing
country and lowers it in the exporting country.
 As a result of these price changes:
• Consumers lose in the importing country and gain in
the exporting country
• Producers gain in the importing country and lose in the
exporting country
• Government imposing the tariff gains revenue
 To measure and compare these costs and benefits, we
need to define consumer and producer surplus.
 Consumer and Producer Surplus
• Consumer surplus
– It measures the amount a consumer gains from a purchase
by the difference between the price he actually pays and
the price he would have been willing to pay.
– It can be derived from the market demand curve.
– Graphically, it is equal to the area under the demand
curve and above the price.
– Example: Suppose a person is willing to pay $20 per
packet of pills, but the price is only $5. Then, the
consumer surplus gained by the purchase of a packet of
pills is $15.
Costs and Benefits of a Tariff
8
$12
9
$10
10
$9
11
D
Figure 8-6: Deriving Consumer Surplus from the Demand Curve
Costs and Benefits of a Tariff
Price, P
Quantity, Q
Figure 8-7: Geometry of Consumer Surplus
Costs and Benefits of a Tariff
a
b
P1
P2
D
Price, P
Quantity, QQ2
Q1
• Producer surplus
– It measures the amount a producer gains from a sale by
the difference between the price he actually receives
and the price at which he would have been willing to
sell.
– It can be derived from the market supply curve.
– Graphically, it is equal to the area above the supply
curve and below the price.
– Example: A producer willing to sell a good for $2 but
receiving a price of $5 gains a producer surplus of $3.
Costs and Benefits of a Tariff
Figure 8-8: Geometry of Producer Surplus
Costs and Benefits of a Tariff
d
c
P2
P1
S
Price, P
Quantity, QQ2
Q1
Costs and Benefits of a Tariff
 Measuring the Cost and Benefits
• Is it possible to add consumer and producer surplus?
– We can (algebraically) add consumer and producer
surplus because any change in price affects each
individual in two ways:
– As a consumer
– As a worker
– We assume that at the margin a dollar’s worth of gain or
loss to each group is of the same social worth.
Figure 8-9: Costs and Benefits of a Tariff for the Importing Country
Costs and Benefits of a Tariff
PT
PW
P*
T
b c d
e
D
a
= consumer loss (a + b + c + d)
= producer gain (a)
= government revenue gain (c + e)
QT
D2
S2
S
S1 D1
Price, P
Quantity, Q
• The areas of the two triangles b and d measure the loss
to the nation as a whole (efficiency loss) and the area
of the rectangle e measures an offsetting gain (terms of
trade gain).
– The efficiency loss arises because a tariff distorts
incentives to consume and produce.
– Producers and consumers act as if imports were more
expensive than they actually are.
– Triangle b is the production distortion loss and triangle d is
the consumption distortion loss.
– The terms of trade gain arises because a tariff lowers
foreign export prices.
Costs and Benefits of a Tariff
• If the terms of trade gain is greater than the efficiency
loss, the tariff increases welfare for the importing
country.
– In the case of a small country, the tariff reduces welfare
for the importing country.
Costs and Benefits of a Tariff
Figure 8-10: Net Welfare Effects of a Tariff
PT
PW
P*
T
b d
e
D
= efficiency loss (b + d)
= terms of trade gain (e)
Imports
SPrice, P
Quantity, Q
Costs and Benefits of a Tariff
 Export Subsidies: Theory
• Export subsidy
– A payment by the government to a firm or individual
that ships a good abroad
– When the government offers an export subsidy, shippers will
export the good up to the point where the domestic price
exceeds the foreign price by the amount of the subsidy.
– It can be either specific or ad valorem.
Other Instruments of Trade Policy
ba
Figure 8-11: Effects of an Export Subsidy
Other Instruments of Trade Policy
PS
PW
P*
S
Price, P
Quantity, Q
Exports
gfe
Subsidy d
c = producer gain
(a + b + c)
= consumer loss (a + b)
= cost of
government subsidy
(b + c + d + e + f + g)
D
S
• An export subsidy raises prices in the exporting
country while lowering them in the importing country.
• In addition, and in contrast to a tariff, the export
subsidy worsens the terms of trade.
• An export subsidy unambiguously leads to costs that
exceed its benefits.
Other Instruments of Trade Policy
Figure 8-12: Europe’s Common Agricultural Program
Other Instruments of Trade Policy
Price, P
Quantity, Q
S
D
EU
price
without
imports
World price
= cost of government
subsidy
Support price
Exports
 Import Quotas: Theory
• An import quota is a direct restriction on the quantity
of a good that is imported.
– Example: The United States has a quota on imports of
foreign cheese.
• The restriction is usually enforced by issuing licenses
to some group of individuals or firms.
– Example: The only firms allowed to import cheese are
certain trading companies.
• In some cases (e.g. sugar and apparel), the right to sell
in the United States is given directly to the
governments of exporting countries.
Other Instruments of Trade Policy
• An import quota always raises the domestic price of
the imported good.
• License holders are able to buy imports and resell
them at a higher price in the domestic market.
– The profits received by the holders of import licenses
are known as quota rents.
Other Instruments of Trade Policy
• Welfare analysis of import quotas versus of that of
tariffs
– The difference between a quota and a tariff is that
with a quota the government receives no revenue.
– In assessing the costs and benefits of an import
quota, it is crucial to determine who gets the rents.
– When the rights to sell in the domestic market are
assigned to governments of exporting countries, the
transfer of rents abroad makes the costs of a quota
substantially higher than the equivalent tariff.
Other Instruments of Trade Policy
Price in U.S. Market 466
World Price 280
b c d
Demand
a
8.456.32
Supply
5.14 9.26
Price, $/ton
Quantity of sugar,
million tons
Figure 8-13: Effects of the U.S. Import Quota on Sugar
Other Instruments of Trade Policy
Import quota:
2.13 million tons
= consumer loss
(a + b + c + d)
= producer gain (a)
= quota rents (c)
 Voluntary Export Restraints
• A voluntary export restraint (VER) is an export
quota administered by the exporting country.
– It is also known as a voluntary restraint agreement
(VRA).
• VERs are imposed at the request of the importer and
are agreed to by the exporter to forestall other trade
restrictions.
Other Instruments of Trade Policy
• A VER is exactly like an import quota where the
licenses are assigned to foreign governments and is
therefore very costly to the importing country.
• A VER is always more costly to the importing country
than a tariff that limits imports by the same amount.
– The tariff equivalent revenue becomes rents earned by
foreigners under the VER.
– Example: About 2/3 of the cost to consumers of the three
major U.S. voluntary restraints in textiles and apparel, steel,
and automobiles is accounted for by the rents earned by
foreigners.
• A VER produces a loss for the importing country.
Other Instruments of Trade Policy
 Local Content Requirements
• A local content requirement is a regulation that
requires that some specified fraction of a final good be
produced domestically.
– This fraction can be specified in physical units or in
value terms.
• Local content laws have been widely used by
developing countries trying to shift their manufacturing
base from assembly back into intermediate goods.
Other Instruments of Trade Policy
• Local content laws do not produce either government
revenue or quota rents.
– Instead, the difference between the prices of imports
and domestic goods gets averaged in the final price and
is passed on to consumers.
– Example: Suppose that auto assembly firms are required to use
50% domestic parts. The cost of imported parts is $6000 and
the cost of the same parts domestically is $10,000. Then the
average cost of parts is $8000 (0.5 x $6000 + 0.5 x $10,000).
• Firms are allowed to satisfy their local content
requirement by exporting instead of using parts
domestically.
Other Instruments of Trade Policy
 Other Trade Policy Instruments
• Export credit subsidies
– A form of a subsidized loan to the buyer of exports.
– They have the same effect as regular export
subsidies.
• National procurement
– Purchases by the government (or public firms) can
be directed towards domestic goods, even if they are
more expensive than imports.
• Red-tape barriers
– Sometimes governments place substantial barriers
based on health, safety and customs procedures.
Other Instruments of Trade Policy
The Effects of Trade Policy:
A Summary
Table 8-1: Effects of Alternative Trade Policies
Summary
 A tariff drives a wedge between foreign and domestic
prices, raising the domestic price but by less than the
tariff rate (except in the “small” country case).
• In the small country case, a tariff is fully reflected in
domestic prices.
 The costs and benefits of a tariff or other trade policy
instruments may be measured using the concepts of
consumer and producer surplus.
• The domestic producers of a good gain
• The domestic consumers lose
• The government collects tariff revenue
Summary
 The net welfare effect of a tariff can be separated into
two parts:
• Efficiency (consumption and production) loss
• Terms of trade gain (is zero in the case of a small
country)
 An export subsidy causes efficiency losses similar to
a tariff but compounds these losses by causing a
deterioration of the terms of trade.
 Under import quotas and voluntary export restraints
the government of the importing country receives no
revenue.
Table 8AI-1: Free Trade Equilibrium for a Small Country
Appendix I: Tariff Analysis in
General Equilibrium
Slope = - P*
M/P*
F
Manufactures production and
consumption, QM, DM
Food production and
consumption, QF, DF
D1
Q1
QF, DF
QM, DM
Q2
D2
Slope = - P*
M/P*
F (1 + t)
Table 8AI-2: A Tariff in a Small Country
Appendix I: Tariff Analysis in
General Equilibrium
Table 8AI-3: Effect of a Tariff on the Terms of Trade
Appendix I: Tariff Analysis in
General Equilibrium
F
M1
Slope = (P*
M/P*
F)1
1
Slope = (P*
M/P*
F)2
M2
2
3
Home exports of manufactures, QM - DM
Foreign imports of manufactures, D*
M - Q*
M
Home imports of food, DF - QF
Foreign exports of food, Q*
F - D*
F
O
D
Appendix II: Tariffs and Import
Quotas in the Presence of Monopoly
Table 8AII-1: A Monopolist Under Free Trade
Price, P
Quality, Q
PW
PM
MC
MR
DfQMQf
D
Appendix II: Tariffs and Import
Quotas in the Presence of Monopoly
Table 8AII-2: A Monopolist Protected by a Tariff
Price, P
Quality, Q
PW
PM
MC
MR
DfQMQf
DtQt
PW + t
Price, P
Quality, Q
PW
Pq
Appendix II: Tariffs and Import
Quotas in the Presence of Monopoly
Table 8AII-3: A Monopolist Protected by an Import Quota
MC
MRq
Dq
D
Qq
Price, P
Quality, Q
PW
Pq
PW + t
Appendix II: Tariffs and Import
Quotas in the Presence of Monopoly
Table 8AII-4: Comparing a Tariff and a Quota
MC
MRq
Dq
D
QtQq

International economic ch08

  • 1.
    Chapter 8Chapter 8 TheInstruments of Trade PolicyThe Instruments of Trade Policy Prepared by Iordanis Petsas To Accompany International Economics: Theory and PolicyInternational Economics: Theory and Policy, Sixth Edition by Paul R. Krugman and Maurice Obstfeld
  • 2.
     Introduction  BasicTariff Analysis  Costs and Benefits of a Tariff  Other Instruments of Trade Policy  The Effects of Trade Policy: A Summary  Summary  Appendix I: Tariff Analysis in General Equilibrium  Appendix II: Tariffs and Import Quotas in the Presence of Monopoly Chapter Organization
  • 3.
    Introduction  This chapteris focused on the following questions: • What are the effects of various trade policy instruments? – Who will benefit and who will lose from these trade policy instruments? • What are the costs and benefits of protection? – Will the benefits outweigh the costs? • What should a nation’s trade policy be? – For example, should the United States use a tariff or an import quota to protect its automobile industry against competition from Japan and South Korea?
  • 4.
    Classification of CommercialPolicy Instruments Introduction Commercial Policy Instruments Trade Contraction Trade Expansion Tariff Export tax Import quota Voluntary Export Restraint (VER) Import subsidy Export subsidy Voluntary Import Expansion (VIE) Price Quantity Price Quantity
  • 5.
    Basic Tariff Analysis Tariffs can be classified as: • Specific tariffs – Taxes that are levied as a fixed charge for each unit of goods imported – Example: A specific tariff of $10 on each imported bicycle with an international price of $100 means that customs officials collect the fixed sum of $10. • Ad valorem tariffs – Taxes that are levied as a fraction of the value of the imported goods – Example: A 20% ad valorem tariff on bicycles generates a $20 payment on each $100 imported bicycle.
  • 6.
    • A compoundduty (tariff) is a combination of an ad valorem and a specific tariff. • Modern governments usually prefer to protect domestic industries through a variety of nontariff barriers, such as: – Import quotas – Limit the quantity of imports – Export restraints – Limit the quantity of exports Basic Tariff Analysis
  • 7.
     Supply, Demand,and Trade in a Single Industry • Suppose that there are two countries (Home and Foreign). • Both countries consume and produce wheat, which can be costless transported between the countries. • In each country, wheat is a competitive industry. • Suppose that in the absence of trade the price of wheat at Home exceeds the corresponding price at Foreign. – This implies that shippers begin to move wheat from Foreign to Home. – The export of wheat raises its price in Foreign and lowers its price in Home until the initial difference in prices has been eliminated. Basic Tariff Analysis
  • 8.
     To determinethe world price (Pw) and the quantity trade (Qw), two curves are defined: • Home import demand curve – Shows the maximum quantity of imports the Home country would like to consume at each price of the imported good. – That is, the excess of what Home consumers demand over what Home producers supply: MD = D(P) – S(P) • Foreign export supply curve – Shows the maximum quantity of exports Foreign would like to provide the rest of the world at each price. – That is, the excess of what Foreign producers supply over what foreign consumers demand: XS = S*(P*) – D*(P*) Basic Tariff Analysis
  • 9.
    Quantity, Q Price, PPrice,P Quantity, Q MD D S A PA P2 P1 S2 D2 D2 – S2 2 S1 D1 D1 – S1 1 Figure 8-1: Deriving Home’s Import Demand Curve Basic Tariff Analysis
  • 10.
     Properties ofthe import demand curve: • It intersects the vertical axis at the closed economy price of the importing country. • It is downward sloping. • It is flatter than the domestic demand curve in the importing country. Basic Tariff Analysis
  • 11.
    P2 P* A D* S* P1 XS Price, P Price,P Quantity, Q Quantity, QS*2 – D*2 S*2 D*2 Figure 8-2: Deriving Foreign’s Export Supply Curve Basic Tariff Analysis D*1 S*1 S*1 – D*1
  • 12.
     Properties ofthe export supply curve: • It intersects the vertical axis at the closed economy price of the exporting country. • It is upward sloping. • It is flatter that the domestic supply curve in the exporting country. Basic Tariff Analysis
  • 13.
    Figure 8-3: WorldEquilibrium XS Price, P Quantity, Q MD PW QW 1 Basic Tariff Analysis
  • 14.
     Useful definitions: •The terms of trade is the relative price of the exportable good expressed in units of the importable good. • A small country is a country that cannot affect its terms of trade no matter how much it trades with the rest of the world.  The analytical framework will be based on either of the following: • Two large countries trading with each other • A small country trading with the rest of the world Basic Tariff Analysis
  • 15.
     Effects ofa Tariff • Assume that two large countries trade with each other. • Suppose Home imposes a tax of $2 on every bushel of wheat imported. – Then shippers will be unwilling to move the wheat unless the price difference between the two markets is at least $2. • Figure 8-4 illustrates the effects of a specific tariff of $t per unit of wheat. Basic Tariff Analysis
  • 16.
    XS PT MD D* S* D S PW 2 QT 1 QW Basic Tariff Analysis Figure8-4: Effects of a Tariff P* T 3 t Price, P Quantity, Q Price, P Quantity, Q Price, P Quantity, Q Home market World market Foreign marketHome market World market Foreign market
  • 17.
    • In theabsence of tariff, the world price of wheat (Pw) would be equalized in both countries. • With the tariff in place, the price of wheat rises to PT at Home and falls to P*T (= PT – t) at Foreign until the price difference is $t. – In Home: producers supply more and consumers demand less due to the higher price, so that fewer imports are demanded. – In Foreign: producers supply less and consumers demand more due to the lower price, so that fewer exports are supplied. – Thus, the volume of wheat traded declines due to the imposition of the tariff. Basic Tariff Analysis
  • 18.
    • The increasein the domestic Home price is less than the tariff, because part of the tariff is reflected in a decline in Foreign’ s export price. – If Home is a small country and imposes a tariff, the foreign export prices are unaffected and the domestic price at Home (the importing country) rises by the full amount of the tariff. Basic Tariff Analysis
  • 19.
    Figure 8-5: ATariff in a Small Country SPrice, P Quantity, Q D PW + t PW Imports after tariff S1 D1 Imports before tariff D2 S2 Basic Tariff Analysis
  • 20.
     Measuring theAmount of Protection • In analyzing trade policy in practice, it is important to know how much protection a trade policy actually provides. – One can express the amount of protection as a percentage of the price that would prevail under free trade. – Two problems arise from this method of measurement: » In the large country case, the tariff will lower the foreign export price. » Tariffs may have different effects on different stages of production of a good. Basic Tariff Analysis
  • 21.
     Effective rateof protection • One must consider both the effects of tariffs on the final price of a good, and the effects of tariffs on the costs of inputs used in production. – The actual protection provided by a tariff will not equal the tariff rate if imported intermediate goods are used in the production of the protected good. – Example: A European airplane that sells for $50 million has cost $60 million to produce. Half of the purchase price of the aircraft represents the cost of components purchased from other countries. A subsidy of $10 million from the European government cuts the cost of the value added to purchasers of the airplane from $30 to $20 million. Thus, the effective rate of protection is (30-20)/20 = 50%. Basic Tariff Analysis
  • 22.
    Costs and Benefitsof a Tariff  A tariff raises the price of a good in the importing country and lowers it in the exporting country.  As a result of these price changes: • Consumers lose in the importing country and gain in the exporting country • Producers gain in the importing country and lose in the exporting country • Government imposing the tariff gains revenue  To measure and compare these costs and benefits, we need to define consumer and producer surplus.
  • 23.
     Consumer andProducer Surplus • Consumer surplus – It measures the amount a consumer gains from a purchase by the difference between the price he actually pays and the price he would have been willing to pay. – It can be derived from the market demand curve. – Graphically, it is equal to the area under the demand curve and above the price. – Example: Suppose a person is willing to pay $20 per packet of pills, but the price is only $5. Then, the consumer surplus gained by the purchase of a packet of pills is $15. Costs and Benefits of a Tariff
  • 24.
    8 $12 9 $10 10 $9 11 D Figure 8-6: DerivingConsumer Surplus from the Demand Curve Costs and Benefits of a Tariff Price, P Quantity, Q
  • 25.
    Figure 8-7: Geometryof Consumer Surplus Costs and Benefits of a Tariff a b P1 P2 D Price, P Quantity, QQ2 Q1
  • 26.
    • Producer surplus –It measures the amount a producer gains from a sale by the difference between the price he actually receives and the price at which he would have been willing to sell. – It can be derived from the market supply curve. – Graphically, it is equal to the area above the supply curve and below the price. – Example: A producer willing to sell a good for $2 but receiving a price of $5 gains a producer surplus of $3. Costs and Benefits of a Tariff
  • 27.
    Figure 8-8: Geometryof Producer Surplus Costs and Benefits of a Tariff d c P2 P1 S Price, P Quantity, QQ2 Q1
  • 28.
    Costs and Benefitsof a Tariff  Measuring the Cost and Benefits • Is it possible to add consumer and producer surplus? – We can (algebraically) add consumer and producer surplus because any change in price affects each individual in two ways: – As a consumer – As a worker – We assume that at the margin a dollar’s worth of gain or loss to each group is of the same social worth.
  • 29.
    Figure 8-9: Costsand Benefits of a Tariff for the Importing Country Costs and Benefits of a Tariff PT PW P* T b c d e D a = consumer loss (a + b + c + d) = producer gain (a) = government revenue gain (c + e) QT D2 S2 S S1 D1 Price, P Quantity, Q
  • 30.
    • The areasof the two triangles b and d measure the loss to the nation as a whole (efficiency loss) and the area of the rectangle e measures an offsetting gain (terms of trade gain). – The efficiency loss arises because a tariff distorts incentives to consume and produce. – Producers and consumers act as if imports were more expensive than they actually are. – Triangle b is the production distortion loss and triangle d is the consumption distortion loss. – The terms of trade gain arises because a tariff lowers foreign export prices. Costs and Benefits of a Tariff
  • 31.
    • If theterms of trade gain is greater than the efficiency loss, the tariff increases welfare for the importing country. – In the case of a small country, the tariff reduces welfare for the importing country. Costs and Benefits of a Tariff
  • 32.
    Figure 8-10: NetWelfare Effects of a Tariff PT PW P* T b d e D = efficiency loss (b + d) = terms of trade gain (e) Imports SPrice, P Quantity, Q Costs and Benefits of a Tariff
  • 33.
     Export Subsidies:Theory • Export subsidy – A payment by the government to a firm or individual that ships a good abroad – When the government offers an export subsidy, shippers will export the good up to the point where the domestic price exceeds the foreign price by the amount of the subsidy. – It can be either specific or ad valorem. Other Instruments of Trade Policy
  • 34.
    ba Figure 8-11: Effectsof an Export Subsidy Other Instruments of Trade Policy PS PW P* S Price, P Quantity, Q Exports gfe Subsidy d c = producer gain (a + b + c) = consumer loss (a + b) = cost of government subsidy (b + c + d + e + f + g) D S
  • 35.
    • An exportsubsidy raises prices in the exporting country while lowering them in the importing country. • In addition, and in contrast to a tariff, the export subsidy worsens the terms of trade. • An export subsidy unambiguously leads to costs that exceed its benefits. Other Instruments of Trade Policy
  • 36.
    Figure 8-12: Europe’sCommon Agricultural Program Other Instruments of Trade Policy Price, P Quantity, Q S D EU price without imports World price = cost of government subsidy Support price Exports
  • 37.
     Import Quotas:Theory • An import quota is a direct restriction on the quantity of a good that is imported. – Example: The United States has a quota on imports of foreign cheese. • The restriction is usually enforced by issuing licenses to some group of individuals or firms. – Example: The only firms allowed to import cheese are certain trading companies. • In some cases (e.g. sugar and apparel), the right to sell in the United States is given directly to the governments of exporting countries. Other Instruments of Trade Policy
  • 38.
    • An importquota always raises the domestic price of the imported good. • License holders are able to buy imports and resell them at a higher price in the domestic market. – The profits received by the holders of import licenses are known as quota rents. Other Instruments of Trade Policy
  • 39.
    • Welfare analysisof import quotas versus of that of tariffs – The difference between a quota and a tariff is that with a quota the government receives no revenue. – In assessing the costs and benefits of an import quota, it is crucial to determine who gets the rents. – When the rights to sell in the domestic market are assigned to governments of exporting countries, the transfer of rents abroad makes the costs of a quota substantially higher than the equivalent tariff. Other Instruments of Trade Policy
  • 40.
    Price in U.S.Market 466 World Price 280 b c d Demand a 8.456.32 Supply 5.14 9.26 Price, $/ton Quantity of sugar, million tons Figure 8-13: Effects of the U.S. Import Quota on Sugar Other Instruments of Trade Policy Import quota: 2.13 million tons = consumer loss (a + b + c + d) = producer gain (a) = quota rents (c)
  • 41.
     Voluntary ExportRestraints • A voluntary export restraint (VER) is an export quota administered by the exporting country. – It is also known as a voluntary restraint agreement (VRA). • VERs are imposed at the request of the importer and are agreed to by the exporter to forestall other trade restrictions. Other Instruments of Trade Policy
  • 42.
    • A VERis exactly like an import quota where the licenses are assigned to foreign governments and is therefore very costly to the importing country. • A VER is always more costly to the importing country than a tariff that limits imports by the same amount. – The tariff equivalent revenue becomes rents earned by foreigners under the VER. – Example: About 2/3 of the cost to consumers of the three major U.S. voluntary restraints in textiles and apparel, steel, and automobiles is accounted for by the rents earned by foreigners. • A VER produces a loss for the importing country. Other Instruments of Trade Policy
  • 43.
     Local ContentRequirements • A local content requirement is a regulation that requires that some specified fraction of a final good be produced domestically. – This fraction can be specified in physical units or in value terms. • Local content laws have been widely used by developing countries trying to shift their manufacturing base from assembly back into intermediate goods. Other Instruments of Trade Policy
  • 44.
    • Local contentlaws do not produce either government revenue or quota rents. – Instead, the difference between the prices of imports and domestic goods gets averaged in the final price and is passed on to consumers. – Example: Suppose that auto assembly firms are required to use 50% domestic parts. The cost of imported parts is $6000 and the cost of the same parts domestically is $10,000. Then the average cost of parts is $8000 (0.5 x $6000 + 0.5 x $10,000). • Firms are allowed to satisfy their local content requirement by exporting instead of using parts domestically. Other Instruments of Trade Policy
  • 45.
     Other TradePolicy Instruments • Export credit subsidies – A form of a subsidized loan to the buyer of exports. – They have the same effect as regular export subsidies. • National procurement – Purchases by the government (or public firms) can be directed towards domestic goods, even if they are more expensive than imports. • Red-tape barriers – Sometimes governments place substantial barriers based on health, safety and customs procedures. Other Instruments of Trade Policy
  • 46.
    The Effects ofTrade Policy: A Summary Table 8-1: Effects of Alternative Trade Policies
  • 47.
    Summary  A tariffdrives a wedge between foreign and domestic prices, raising the domestic price but by less than the tariff rate (except in the “small” country case). • In the small country case, a tariff is fully reflected in domestic prices.  The costs and benefits of a tariff or other trade policy instruments may be measured using the concepts of consumer and producer surplus. • The domestic producers of a good gain • The domestic consumers lose • The government collects tariff revenue
  • 48.
    Summary  The netwelfare effect of a tariff can be separated into two parts: • Efficiency (consumption and production) loss • Terms of trade gain (is zero in the case of a small country)  An export subsidy causes efficiency losses similar to a tariff but compounds these losses by causing a deterioration of the terms of trade.  Under import quotas and voluntary export restraints the government of the importing country receives no revenue.
  • 49.
    Table 8AI-1: FreeTrade Equilibrium for a Small Country Appendix I: Tariff Analysis in General Equilibrium Slope = - P* M/P* F Manufactures production and consumption, QM, DM Food production and consumption, QF, DF D1 Q1
  • 50.
    QF, DF QM, DM Q2 D2 Slope= - P* M/P* F (1 + t) Table 8AI-2: A Tariff in a Small Country Appendix I: Tariff Analysis in General Equilibrium
  • 51.
    Table 8AI-3: Effectof a Tariff on the Terms of Trade Appendix I: Tariff Analysis in General Equilibrium F M1 Slope = (P* M/P* F)1 1 Slope = (P* M/P* F)2 M2 2 3 Home exports of manufactures, QM - DM Foreign imports of manufactures, D* M - Q* M Home imports of food, DF - QF Foreign exports of food, Q* F - D* F O
  • 52.
    D Appendix II: Tariffsand Import Quotas in the Presence of Monopoly Table 8AII-1: A Monopolist Under Free Trade Price, P Quality, Q PW PM MC MR DfQMQf
  • 53.
    D Appendix II: Tariffsand Import Quotas in the Presence of Monopoly Table 8AII-2: A Monopolist Protected by a Tariff Price, P Quality, Q PW PM MC MR DfQMQf DtQt PW + t
  • 54.
    Price, P Quality, Q PW Pq AppendixII: Tariffs and Import Quotas in the Presence of Monopoly Table 8AII-3: A Monopolist Protected by an Import Quota MC MRq Dq D Qq
  • 55.
    Price, P Quality, Q PW Pq PW+ t Appendix II: Tariffs and Import Quotas in the Presence of Monopoly Table 8AII-4: Comparing a Tariff and a Quota MC MRq Dq D QtQq