Download to read offline


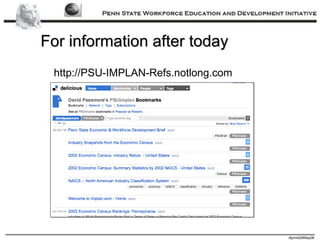
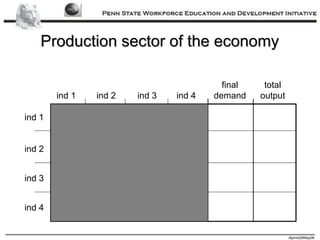

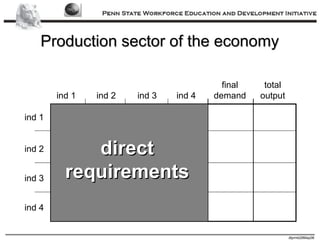
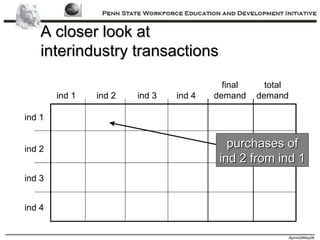
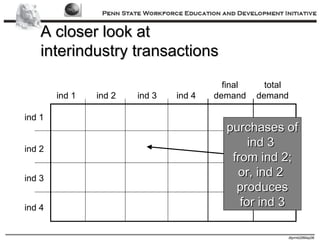
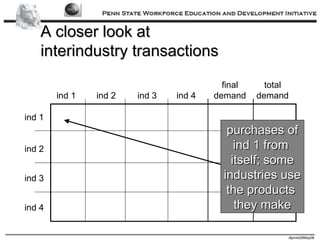
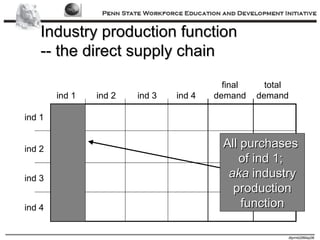
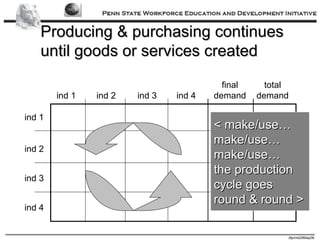
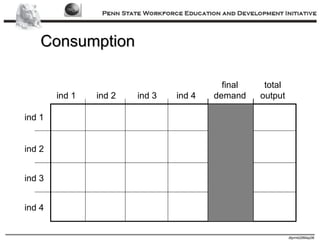
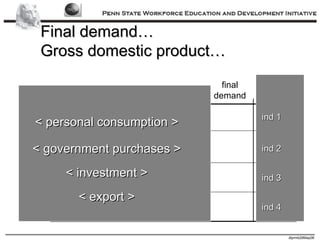
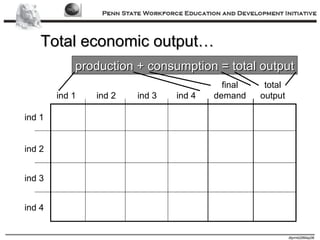

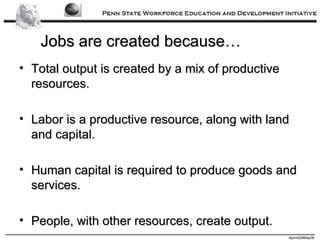


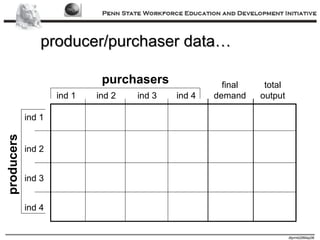
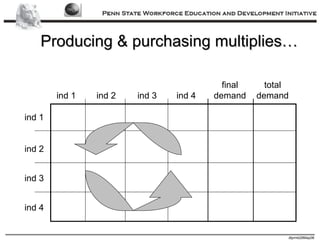
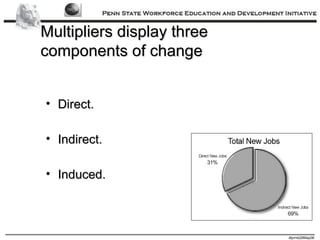
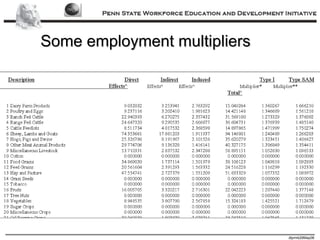
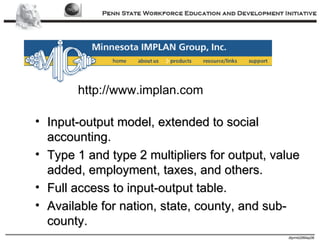
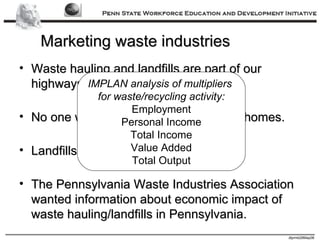
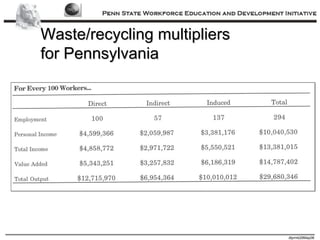


The document discusses economic impact analysis using input-output tables to better understand production, consumption, and job creation within an economy. It explains the classification of industries through the NAICS system and the relationship between different industries, emphasizing the roles of direct, indirect, and induced effects in economic multipliers. Additionally, it highlights the necessity for community discussions around the costs related to economic and workforce development, particularly in the context of waste management and recycling industries in Pennsylvania.