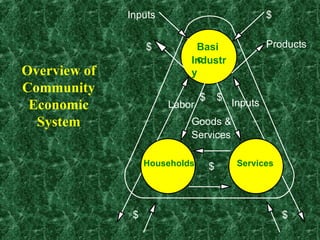
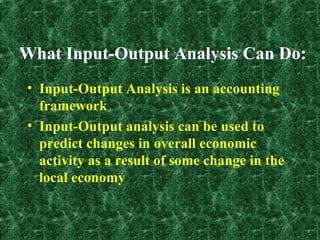
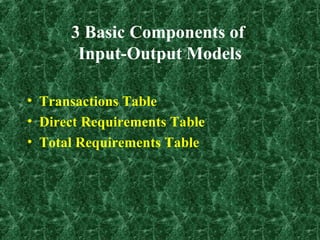
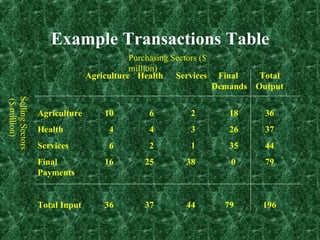
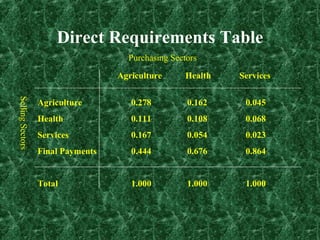
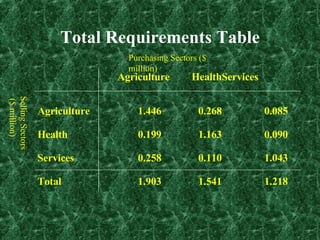
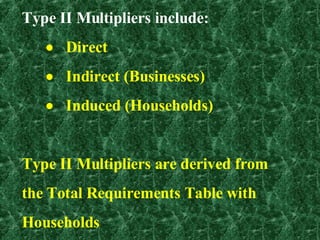
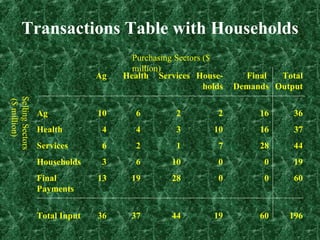
Input-Output Model Basics Tom Harris University of Nevada, Reno University Center for Economic Development MS 204 Reno, NV  89557-0105 and Gerald A. Doeksen Oklahoma State University Oklahoma Cooperative Extension Service 515 Ag Hall Stillwater, OK  74078
Examples of Interrelationships Between Sectors: Sectors purchase from other sectors Sectors sell to other sectors Sectors sell outside the local economy Sectors buy outside the local economy
Overview of Community Economic System Households Industry Basic Services Goods & $ Inputs Products Inputs $ $ $ $ Services $ $ Labor
Input-Output analysis creates a picture of a regional economy describing flows to and from industries and institutions
What Input-Output Analysis Can Do: Input-Output Analysis is an accounting framework Input-Output analysis can be used to predict changes in overall economic activity as a result of some change in the local economy
Uses of Input-Output Analysis Provides a description of a local economy Predictive model to estimate impacts
3 Basic Components of  Input-Output Models Transactions Table Direct Requirements Table Total Requirements Table
Transactions Table A transactions table shows the monetary flows of goods and services in a local economy Represents monetary flows for a given time period, usually one year
Transactions Table Flows Total outlays = Total output Intermediate purchases are goods and services purchased and used in the local production process Final demands are purchases for final consumption Final payments are payments for factors or inputs outside intermediate production process
Example Transactions Table Selling Sectors ($ million) Purchasing Sectors ($ million) Agriculture Health Services Final  Total Demands Output Agriculture 10 6 2 18 36 Health 4 4 3 26 37 Services 6 2 1 35 44 Final 16 25 38 0 79 Payments Total Input 36 37 44 79 196
Predictive Use  of Input-Output Analysis Impacts are tracked throughout the economy The multipliers are derived from regional economic accounts Only local transactions are used to create the multiplier effect
Direct Requirements Table Direct requirements are the purchases of resources (inputs) by a sector from all sectors to produce one dollar of output Creates a production recipe
Selling Sectors  Purchasing Sectors Agriculture Health Services Agriculture 0.278 0.162 0.045 Health 0.111 0.108 0.068 Services 0.167 0.054 0.023 Final Payments 0.444 0.676 0.864 Total  1.000 1.000 1.000 Direct Requirements Table
What are Multipliers? Multipliers measure total change  throughout the economy  from one unit change  for a given sector.
Three Types of Multipliers are calculated from Model 1. Output 2. Employment 3. Income
Three levels of Multipliers Type I Multipliers Type II Multipliers  Type III Multipliers
Type I Multipliers Include direct or initial spending Include indirect spending or businesses buying and selling to each other The multiplier is direct plus indirect effect divided by direct effect
Type II Multipliers Includes Type I Multiplier effects Plus household spending based on the income earned from the direct and indirect effects – the induced effects
TYPE III MULTIPLIERS Type III Multipliers are modified Type II multipliers. Therefore, Type III Multipliers also include the direct, indirect, and induced effects. Type III Multipliers adjust Type II Multipliers based on spending patterns amongst different income groups.
Type I Multipliers include:  Direct  Indirect (Business Spending) Type I Multipliers are derived from the Total Requirements Table In math, this is:   X = (1-A) -1  Y
Selling Sectors ($ million) Purchasing Sectors ($ million) Agriculture Health Services Agriculture 1.446 0.268 0.085 Health 0.199 1.163 0.090 Services 0.258 0.110 1.043 Total  1.903 1.541 1.218 Total Requirements Table
Explaining the Health Sector  Type I Multiplier For a $1.00 change in final demand sales in the local economy, the total direct and indirect impacts are $1.541
Type II Multipliers include:  Direct  Indirect (Businesses)  Induced (Households) Type II Multipliers are derived from  the Total Requirements Table with Households
Transactions Table with Households Selling Sectors ($ million) Purchasing Sectors ($ million) Ag Health Services House- Final  Total holds Demands Output Ag 10 6 2 2 16 36 Health 4 4 3 10 16 37 Services 6 2 1 7 28 44 Households 3 6 10 0 0 19 Final 13 19 28 0 0 60 Payments Total Input 36 37 44 19 60 196
Total Requirements Table  with Households  Selling Sectors Purchasing Sectors Agriculture Health Services Households   Agriculture 1.536 0.369 0.197 0.429 Health 0.386 1.370 0.318 0.879 Services 0.388 0.256 1.203 0.619 Households 0.279 0.311 0.341 1.319 Total 2.589 2.307 2.059 3.245
Explaining the Health Sector  Type II Multiplier For a $1.00 change in final demand sales in the local economy, the total direct, indirect and induced impacts are $2.307
Multipliers Direct requirements represent direct or initial spending Direct and indirect effects include the direct spending plus the indirect spending or businesses buying and selling to each other Direct, indirect and induced effects include direct and indirect plus household spending earned from direct and indirect effects
Other Multipliers Employment Multipliers Type I Type II Type III Income Multipliers Type I Type II Type III
Example - Type I  Employment Multiplier Agricultural Sector Type I Employment Multiplier = 1.43 When the Agricultural Sector realizes a 1 employee change, total employment in the study area changes by 1.43 jobs from direct and indirect linkages
Example – Type II Employment Multiplier Agricultural Sector Type II Employment Multiplier = 2.25  When the Agricultural Sector realizes a 1 employee change, total employment in the study area changes by 2.25 jobs from direct, indirect and induced linkages
Breakdown of  Type II Employment Multiplier - Agricultural Sector Direct Effects  =  1.00 Indirect Effects  =  0.43 Induced Effects  =  0.82 Total =  2.25
Example – Type I Income Multiplier Agricultural Sector Type I Income Multiplier = 1.96 When the Agricultural Sector realizes a $1.00 change in income, total income in the study area changes by $1.96 from direct and indirect linkages
Example - Type II Income Multiplier Agricultural Sector Type II Income Multiplier = 2.50  When the Agricultural Sector realizes a $1.00 change in income, total income in the study area changes by $2.50 from direct, indirect and induced linkages
Breakdown of  Type II Income Multiplier - Agricultural Sector Direct Effects  = $1.00 Indirect Effects  = $0.96 Induced Effects  = $0.54 Total = $2.50
Caution When Using Multipliers Multiplier values include direct effects Do not aggregate sector multipliers to derive an aggregate multiplier Be cautious of large multipliers Be cautious in using a multiplier from another study area
Procedures Used  For This Analysis IMPLAN (IMPact analysis for PLANning) *  Geographical database *  Software and data for model  construction and impact analysis *  History of IMPLAN
IMPLAN USE FOR HEALTH SECTOR ANALYSIS Develop county-wide input-output model From State Employment Security Offices derived health sector employment Use IMPLAN to derive county-wide output, employment, income and sales tax impacts from the local health sector
Database of IMPLAN 528 Industrial Sectors Most 3 or 4 digit SIC All standard counties in the U.S. Now available at zip code level
Any Questions?

Doeksen Inputoutput

  • 1.
    Input-Output Model BasicsTom Harris University of Nevada, Reno University Center for Economic Development MS 204 Reno, NV 89557-0105 and Gerald A. Doeksen Oklahoma State University Oklahoma Cooperative Extension Service 515 Ag Hall Stillwater, OK 74078
  • 2.
    Examples of InterrelationshipsBetween Sectors: Sectors purchase from other sectors Sectors sell to other sectors Sectors sell outside the local economy Sectors buy outside the local economy
  • 3.
    Overview of CommunityEconomic System Households Industry Basic Services Goods & $ Inputs Products Inputs $ $ $ $ Services $ $ Labor
  • 4.
    Input-Output analysis createsa picture of a regional economy describing flows to and from industries and institutions
  • 5.
    What Input-Output AnalysisCan Do: Input-Output Analysis is an accounting framework Input-Output analysis can be used to predict changes in overall economic activity as a result of some change in the local economy
  • 6.
    Uses of Input-OutputAnalysis Provides a description of a local economy Predictive model to estimate impacts
  • 7.
    3 Basic Componentsof Input-Output Models Transactions Table Direct Requirements Table Total Requirements Table
  • 8.
    Transactions Table Atransactions table shows the monetary flows of goods and services in a local economy Represents monetary flows for a given time period, usually one year
  • 9.
    Transactions Table FlowsTotal outlays = Total output Intermediate purchases are goods and services purchased and used in the local production process Final demands are purchases for final consumption Final payments are payments for factors or inputs outside intermediate production process
  • 10.
    Example Transactions TableSelling Sectors ($ million) Purchasing Sectors ($ million) Agriculture Health Services Final Total Demands Output Agriculture 10 6 2 18 36 Health 4 4 3 26 37 Services 6 2 1 35 44 Final 16 25 38 0 79 Payments Total Input 36 37 44 79 196
  • 11.
    Predictive Use of Input-Output Analysis Impacts are tracked throughout the economy The multipliers are derived from regional economic accounts Only local transactions are used to create the multiplier effect
  • 12.
    Direct Requirements TableDirect requirements are the purchases of resources (inputs) by a sector from all sectors to produce one dollar of output Creates a production recipe
  • 13.
    Selling Sectors Purchasing Sectors Agriculture Health Services Agriculture 0.278 0.162 0.045 Health 0.111 0.108 0.068 Services 0.167 0.054 0.023 Final Payments 0.444 0.676 0.864 Total 1.000 1.000 1.000 Direct Requirements Table
  • 14.
    What are Multipliers?Multipliers measure total change throughout the economy from one unit change for a given sector.
  • 15.
    Three Types ofMultipliers are calculated from Model 1. Output 2. Employment 3. Income
  • 16.
    Three levels ofMultipliers Type I Multipliers Type II Multipliers Type III Multipliers
  • 17.
    Type I MultipliersInclude direct or initial spending Include indirect spending or businesses buying and selling to each other The multiplier is direct plus indirect effect divided by direct effect
  • 18.
    Type II MultipliersIncludes Type I Multiplier effects Plus household spending based on the income earned from the direct and indirect effects – the induced effects
  • 19.
    TYPE III MULTIPLIERSType III Multipliers are modified Type II multipliers. Therefore, Type III Multipliers also include the direct, indirect, and induced effects. Type III Multipliers adjust Type II Multipliers based on spending patterns amongst different income groups.
  • 20.
    Type I Multipliersinclude:  Direct  Indirect (Business Spending) Type I Multipliers are derived from the Total Requirements Table In math, this is: X = (1-A) -1 Y
  • 21.
    Selling Sectors ($million) Purchasing Sectors ($ million) Agriculture Health Services Agriculture 1.446 0.268 0.085 Health 0.199 1.163 0.090 Services 0.258 0.110 1.043 Total 1.903 1.541 1.218 Total Requirements Table
  • 22.
    Explaining the HealthSector Type I Multiplier For a $1.00 change in final demand sales in the local economy, the total direct and indirect impacts are $1.541
  • 23.
    Type II Multipliersinclude:  Direct  Indirect (Businesses)  Induced (Households) Type II Multipliers are derived from the Total Requirements Table with Households
  • 24.
    Transactions Table withHouseholds Selling Sectors ($ million) Purchasing Sectors ($ million) Ag Health Services House- Final Total holds Demands Output Ag 10 6 2 2 16 36 Health 4 4 3 10 16 37 Services 6 2 1 7 28 44 Households 3 6 10 0 0 19 Final 13 19 28 0 0 60 Payments Total Input 36 37 44 19 60 196
  • 25.
    Total Requirements Table with Households Selling Sectors Purchasing Sectors Agriculture Health Services Households Agriculture 1.536 0.369 0.197 0.429 Health 0.386 1.370 0.318 0.879 Services 0.388 0.256 1.203 0.619 Households 0.279 0.311 0.341 1.319 Total 2.589 2.307 2.059 3.245
  • 26.
    Explaining the HealthSector Type II Multiplier For a $1.00 change in final demand sales in the local economy, the total direct, indirect and induced impacts are $2.307
  • 27.
    Multipliers Direct requirementsrepresent direct or initial spending Direct and indirect effects include the direct spending plus the indirect spending or businesses buying and selling to each other Direct, indirect and induced effects include direct and indirect plus household spending earned from direct and indirect effects
  • 28.
    Other Multipliers EmploymentMultipliers Type I Type II Type III Income Multipliers Type I Type II Type III
  • 29.
    Example - TypeI Employment Multiplier Agricultural Sector Type I Employment Multiplier = 1.43 When the Agricultural Sector realizes a 1 employee change, total employment in the study area changes by 1.43 jobs from direct and indirect linkages
  • 30.
    Example – TypeII Employment Multiplier Agricultural Sector Type II Employment Multiplier = 2.25 When the Agricultural Sector realizes a 1 employee change, total employment in the study area changes by 2.25 jobs from direct, indirect and induced linkages
  • 31.
    Breakdown of Type II Employment Multiplier - Agricultural Sector Direct Effects = 1.00 Indirect Effects = 0.43 Induced Effects = 0.82 Total = 2.25
  • 32.
    Example – TypeI Income Multiplier Agricultural Sector Type I Income Multiplier = 1.96 When the Agricultural Sector realizes a $1.00 change in income, total income in the study area changes by $1.96 from direct and indirect linkages
  • 33.
    Example - TypeII Income Multiplier Agricultural Sector Type II Income Multiplier = 2.50 When the Agricultural Sector realizes a $1.00 change in income, total income in the study area changes by $2.50 from direct, indirect and induced linkages
  • 34.
    Breakdown of Type II Income Multiplier - Agricultural Sector Direct Effects = $1.00 Indirect Effects = $0.96 Induced Effects = $0.54 Total = $2.50
  • 35.
    Caution When UsingMultipliers Multiplier values include direct effects Do not aggregate sector multipliers to derive an aggregate multiplier Be cautious of large multipliers Be cautious in using a multiplier from another study area
  • 36.
    Procedures Used For This Analysis IMPLAN (IMPact analysis for PLANning) * Geographical database * Software and data for model construction and impact analysis * History of IMPLAN
  • 37.
    IMPLAN USE FORHEALTH SECTOR ANALYSIS Develop county-wide input-output model From State Employment Security Offices derived health sector employment Use IMPLAN to derive county-wide output, employment, income and sales tax impacts from the local health sector
  • 38.
    Database of IMPLAN528 Industrial Sectors Most 3 or 4 digit SIC All standard counties in the U.S. Now available at zip code level
  • 39.