Download as PDF, PPTX


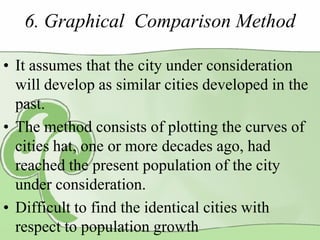


![9. Growth composition analysis method
•
-
Population of city changes due to
Birth
Death and
Migration
Pn = P +Natural increase + Migration
Natural increase =T[IBP – IDP]
T= design forecast period
P= present population
IB= avg. birth rate/yr and ID= avg. death rate/yr](https://image.slidesharecdn.com/l-7populationforecasting-131016230220-phpapp02/85/L-7-population-forecasting-13-320.jpg)


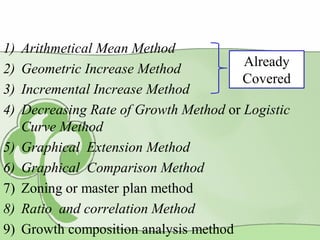
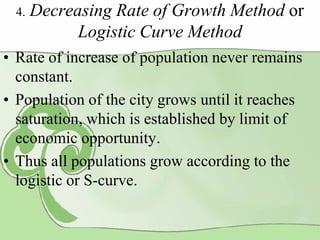
The document outlines various population forecasting methods used in environmental engineering, including methods such as the arithmetical mean, geometric increase, and logistic curve. It discusses how populations grow according to economic opportunities and presents graphical methods for population projection based on past data. Additionally, it highlights factors influencing population growth, including economic, social, and environmental aspects, along with objectives and theory questions related to the topic.