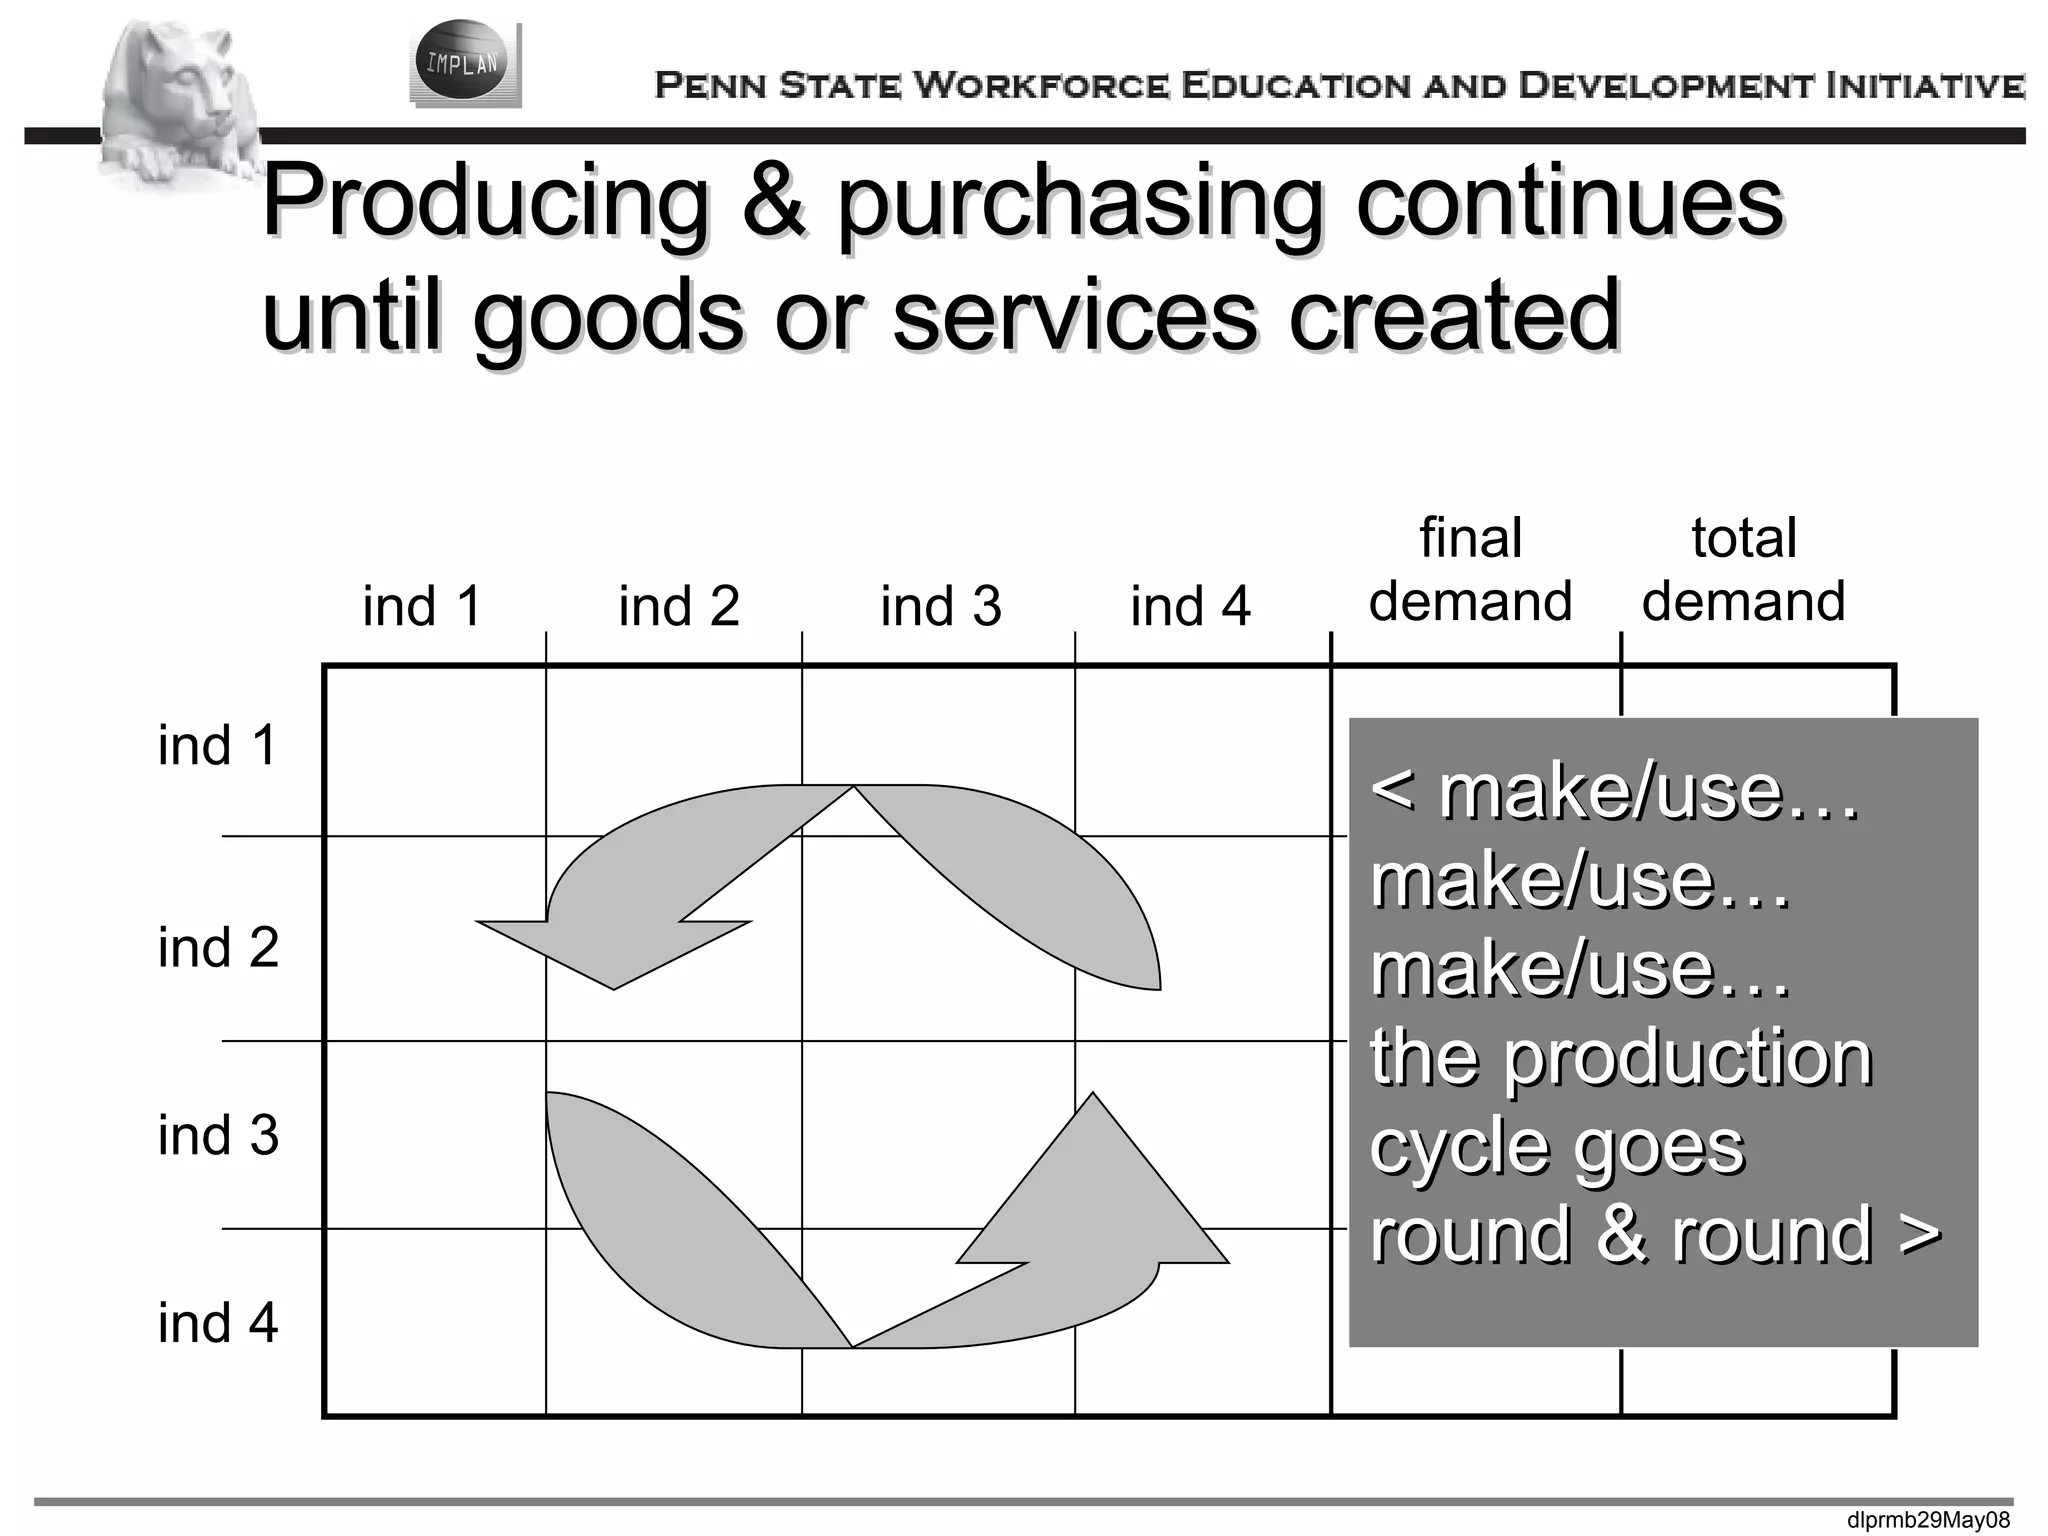
Economic Impact Analysis with IMPLAN Rose M. Baker David L. Passmore
Who we are… Rose M. Baker David L. Passmore Who are  you?
Your experiences & plans http://implan.questionpro.com
Your experiences & plans What you told us….
 
Our process today We have a lot of information. But, we don’t need to dump it all on you. No time pressure to do it all. Bring your knowledge and experiences to the table. Ask questions! Talk! Challenge! A copy of all slides is provided on a web site. We will not overwhelm you with handouts. Sources of information are available on a web site. Breaks and lunch will occur!
For information after today
Input-Output Analysis A systematic view of production and consumption in an economy
Sex life of your regional economy < the birds & bees of job creation >
The economy is like a ball of string < complex > < intertwined > < large > < unexpected >
Way to organize data < input-output tables > Summarize production & consumption.
Input-output table ind 1 ind 2 ind 3 ind 4 ind 1 ind 2 ind 3 ind 4 final demand total output
How is economic activity classified? An  industry  is a group of establishments with similar production processes or products. An  establishment  is a single physical location where business is conducted. Industrial operations conducted or services provided. Not to be confused with an enterprise. A  commodity  is a group of similar products. Industries  make  and  use  commodities. Some commodities are  primary  products or services. Some some commodities are  secondary  to primary business.
NAICS classifies industries N orth  A merican  I ndustrial  C lassification  S ystem. Six-digit code read from left to right (general to more detailed industries). First two digits = sector (manufacturing). Third digit = sub-sector (food manufacturing). Fourth digit = industry group (dairy product manufacturing). Fifth digit = NAICS industry (ice cream & frozen dessert manufacturing). Sixth digit is country–specific. An example
Primary & secondary commodities Establishments are in industries that define their primary commodities. Most establishments produce commodities in addition to primary. Newspapers are primary product of newspaper industry; advertising is secondary product. Lodging is the primary product of hotels; meal services are secondary products. Other examples? Secondary commodities are  redefined  to other industries.
Simple input-output table ind 1 ind 2 ind 3 ind 4 ind 1 ind 2 ind 3 ind 4 final demand total output
Industries  produce  goods & services ind 1 ind 2 ind 3 ind 4 ind 1 ind 2 ind 3 ind 4 final demand total output producers
Industries  purchase   goods & services ind 1 ind 2 ind 3 ind 4 ind 1 ind 2 ind 3 ind 4 final demand total output purchasers
Production sector of the economy ind 1 ind 2 ind 3 ind 4 ind 1 ind 2 ind 3 ind 4 final demand total output
Production sector of the economy ind 1 ind 2 ind 3 ind 4 ind 1 ind 2 ind 3 ind 4 final demand total output interindustry transactions
Production sector of the economy ind 1 ind 2 ind 3 ind 4 ind 1 ind 2 ind 3 ind 4 final demand total output direct requirements
A closer look at interindustry transactions ind 1 ind 2 ind 3 ind 4 ind 1 ind 2 ind 3 ind 4 final demand total demand purchases of ind 2 from ind 1
A closer look at interindustry transactions ind 1 ind 2 ind 3 ind 4 ind 1 ind 2 ind 3 ind 4 final demand total demand purchases of ind 3  from ind 2; or, ind 2  produces for ind 3
A closer look at interindustry transactions ind 1 ind 2 ind 3 ind 4 ind 1 ind 2 ind 3 ind 4 final demand total demand purchases of ind 1 from  itself; some industries use the products  they make
Industry production function  -- the direct supply chain ind 1 ind 2 ind 3 ind 4 ind 1 ind 2 ind 3 ind 4 final demand total demand All purchases  of ind 1;  aka  industry production function
Producing & purchasing continues until goods or services created ind 1 ind 2 ind 3 ind 4 ind 1 ind 2 ind 3 ind 4 final demand total demand < make/use… make/use… make/use… the production cycle goes  round & round >
Consumption ind 1 ind 2 ind 3 ind 4 ind 1 ind 2 ind 3 ind 4 final demand total output
Final demand… Gross domestic product… MDEV 6058   Penn State Management Development ind 1 ind 2 ind 3 ind 4 ind 1 ind 2 ind 3 ind 4 final demand total demand ind 1 ind 2 ind 3 ind 4 < personal consumption > < government purchases > < investment > < export >
Total economic output… ind 1 ind 2 ind 3 ind 4 ind 1 ind 2 ind 3 ind 4 final demand total output production + consumption = total output
Some Examples of Input-Output Tables
Here is the sex part…. < where jobs come from >
Jobs are created because… Total output is created by a mix of productive resources. Labor is a productive resource, along with land and capital. Human capital is required to produce goods and services. People, with other resources, create output.
Jobs are tied to total output… ind 1 ind 2 ind 3 ind 4 ind 1 ind 2 ind 3 ind 4 final demand total output ind 1 ind 2 ind 3 ind 4 < in each industry, it takes a  certain number of people to  create a dollar’s worth of  total economic output >
Jobs are tied to total output… ind 1 ind 2 ind 3 ind 4 ind 1 ind 2 ind 3 ind 4 final demand total output ind 1 ind 2 ind 3 ind 4 < if It takes .001 workers to create $1 of economic output,  then,                                  
Jobs are tied to total output… ind 1 ind 2 ind 3 ind 4 ind 1 ind 2 ind 3 ind 4 final demand total output ind 1 Ind 2 ind 3 ind 4 < if It takes .001 workers to create $1 of economic output, then, with $1 billion of total industrial output, 1 million workers are required >
Jobs are tied to total output… ind 1 ind 2 ind 3 ind 4 ind 1 ind 2 ind 3 ind 4 final demand total output ind 1 ind 2 ind 3 ind 4 < changes in labor intensity or in total economic output create changes in numbers and kinds of jobs >
Occupational employment is tied to total industrial output… ind 1 ind 2 ind 3 ind 4 ind 1 ind 2 ind 3 ind 4 final demand total output ind 1 ind 2 ind 3 ind 4 < industries use different occupations > < industries use different labor intensities > < occupational employment differs by industry >
Occupational employment is created.. … when people  use their unique human capital to create goods &  services
Results of input-output analysis
Input-output tables are used for… Economic accounting Forecasting “ What if” simulation
Local uses of input-output analysis <  producer & purchaser data >   <  multipliers >
Multiplier A product of input-output analysis
producer/purchaser data… ind 1 ind 2 ind 3 ind 4 ind 1 ind 2 ind 3 ind 4 final demand total output producers purchasers
Multipliers Economic impact of change in final demand. Calculated for output, income, employment, taxes, and other factors. Show total effects of change on economy. Expressed as a positive number.
Producing & purchasing multiplies… ind 1 ind 2 ind 3 ind 4 ind 1 ind 2 ind 3 ind 4 final demand total demand
Multipliers display three  components of change Direct. Indirect. Induced.
Direct effects Changes in production as a result of immediate effects of a change in final demand. E.g., increase in demand for autos increases production of autos.
Indirect effects Changes in production in industries supplying industry delivering the final product. E.g., increase in auto production increases production in supplying industries (like glass, steel, plastics).
Induced effects Changes in direct and indirect production increase income and, therefore, consumption (and, maybe saving). E.g., workers in auto industry and supplying industries spend and save their income, creating additional economic activity.
Two types of multipliers type 1 = type 2 = direct + indirect direct direct + indirect + induced direct
Some employment multipliers
Input-output model, extended to social accounting. Type 1 and type 2 multipliers for output, value added, employment, taxes, and others. Full access to input-output table. Available for nation, state, county, and sub-county. http://www.implan.com
Marketing waste industries Waste hauling and landfills are part of our highways and landscape. No one wants waste hauled near their homes. Landfills are not desirable neighbors. The Pennsylvania Waste Industries Association wanted information about economic impact of waste hauling/landfills in Pennsylvania. IMPLAN analysis of multipliers  for waste/recycling activity: Employment Personal Income Total Income Value Added Total Output
Waste/recycling multipliers  for Pennsylvania
Loss of opportunity Penn State research on: Community Costs of Technical Skills Deficits
Quick response, regional impact Penn State research: Economic & Workforce  Brief series
Economic Impact Analysis with IMPLAN Rose M. Baker David L. Passmore

Economic Impact Analysis with IMPLAN

  • 1.
    Economic Impact Analysiswith IMPLAN Rose M. Baker David L. Passmore
  • 2.
    Who we are…Rose M. Baker David L. Passmore Who are you?
  • 3.
    Your experiences &plans http://implan.questionpro.com
  • 4.
    Your experiences &plans What you told us….
  • 5.
  • 6.
    Our process todayWe have a lot of information. But, we don’t need to dump it all on you. No time pressure to do it all. Bring your knowledge and experiences to the table. Ask questions! Talk! Challenge! A copy of all slides is provided on a web site. We will not overwhelm you with handouts. Sources of information are available on a web site. Breaks and lunch will occur!
  • 7.
  • 8.
    Input-Output Analysis Asystematic view of production and consumption in an economy
  • 9.
    Sex life ofyour regional economy < the birds & bees of job creation >
  • 10.
    The economy islike a ball of string < complex > < intertwined > < large > < unexpected >
  • 11.
    Way to organizedata < input-output tables > Summarize production & consumption.
  • 12.
    Input-output table ind1 ind 2 ind 3 ind 4 ind 1 ind 2 ind 3 ind 4 final demand total output
  • 13.
    How is economicactivity classified? An industry is a group of establishments with similar production processes or products. An establishment is a single physical location where business is conducted. Industrial operations conducted or services provided. Not to be confused with an enterprise. A commodity is a group of similar products. Industries make and use commodities. Some commodities are primary products or services. Some some commodities are secondary to primary business.
  • 14.
    NAICS classifies industriesN orth A merican I ndustrial C lassification S ystem. Six-digit code read from left to right (general to more detailed industries). First two digits = sector (manufacturing). Third digit = sub-sector (food manufacturing). Fourth digit = industry group (dairy product manufacturing). Fifth digit = NAICS industry (ice cream & frozen dessert manufacturing). Sixth digit is country–specific. An example
  • 15.
    Primary & secondarycommodities Establishments are in industries that define their primary commodities. Most establishments produce commodities in addition to primary. Newspapers are primary product of newspaper industry; advertising is secondary product. Lodging is the primary product of hotels; meal services are secondary products. Other examples? Secondary commodities are redefined to other industries.
  • 16.
    Simple input-output tableind 1 ind 2 ind 3 ind 4 ind 1 ind 2 ind 3 ind 4 final demand total output
  • 17.
    Industries produce goods & services ind 1 ind 2 ind 3 ind 4 ind 1 ind 2 ind 3 ind 4 final demand total output producers
  • 18.
    Industries purchase goods & services ind 1 ind 2 ind 3 ind 4 ind 1 ind 2 ind 3 ind 4 final demand total output purchasers
  • 19.
    Production sector ofthe economy ind 1 ind 2 ind 3 ind 4 ind 1 ind 2 ind 3 ind 4 final demand total output
  • 20.
    Production sector ofthe economy ind 1 ind 2 ind 3 ind 4 ind 1 ind 2 ind 3 ind 4 final demand total output interindustry transactions
  • 21.
    Production sector ofthe economy ind 1 ind 2 ind 3 ind 4 ind 1 ind 2 ind 3 ind 4 final demand total output direct requirements
  • 22.
    A closer lookat interindustry transactions ind 1 ind 2 ind 3 ind 4 ind 1 ind 2 ind 3 ind 4 final demand total demand purchases of ind 2 from ind 1
  • 23.
    A closer lookat interindustry transactions ind 1 ind 2 ind 3 ind 4 ind 1 ind 2 ind 3 ind 4 final demand total demand purchases of ind 3 from ind 2; or, ind 2 produces for ind 3
  • 24.
    A closer lookat interindustry transactions ind 1 ind 2 ind 3 ind 4 ind 1 ind 2 ind 3 ind 4 final demand total demand purchases of ind 1 from itself; some industries use the products they make
  • 25.
    Industry production function -- the direct supply chain ind 1 ind 2 ind 3 ind 4 ind 1 ind 2 ind 3 ind 4 final demand total demand All purchases of ind 1; aka industry production function
  • 26.
    Producing & purchasingcontinues until goods or services created ind 1 ind 2 ind 3 ind 4 ind 1 ind 2 ind 3 ind 4 final demand total demand < make/use… make/use… make/use… the production cycle goes round & round >
  • 27.
    Consumption ind 1ind 2 ind 3 ind 4 ind 1 ind 2 ind 3 ind 4 final demand total output
  • 28.
    Final demand… Grossdomestic product… MDEV 6058  Penn State Management Development ind 1 ind 2 ind 3 ind 4 ind 1 ind 2 ind 3 ind 4 final demand total demand ind 1 ind 2 ind 3 ind 4 < personal consumption > < government purchases > < investment > < export >
  • 29.
    Total economic output…ind 1 ind 2 ind 3 ind 4 ind 1 ind 2 ind 3 ind 4 final demand total output production + consumption = total output
  • 30.
    Some Examples ofInput-Output Tables
  • 31.
    Here is thesex part…. < where jobs come from >
  • 32.
    Jobs are createdbecause… Total output is created by a mix of productive resources. Labor is a productive resource, along with land and capital. Human capital is required to produce goods and services. People, with other resources, create output.
  • 33.
    Jobs are tiedto total output… ind 1 ind 2 ind 3 ind 4 ind 1 ind 2 ind 3 ind 4 final demand total output ind 1 ind 2 ind 3 ind 4 < in each industry, it takes a certain number of people to create a dollar’s worth of total economic output >
  • 34.
    Jobs are tiedto total output… ind 1 ind 2 ind 3 ind 4 ind 1 ind 2 ind 3 ind 4 final demand total output ind 1 ind 2 ind 3 ind 4 < if It takes .001 workers to create $1 of economic output, then,                               
  • 35.
    Jobs are tiedto total output… ind 1 ind 2 ind 3 ind 4 ind 1 ind 2 ind 3 ind 4 final demand total output ind 1 Ind 2 ind 3 ind 4 < if It takes .001 workers to create $1 of economic output, then, with $1 billion of total industrial output, 1 million workers are required >
  • 36.
    Jobs are tiedto total output… ind 1 ind 2 ind 3 ind 4 ind 1 ind 2 ind 3 ind 4 final demand total output ind 1 ind 2 ind 3 ind 4 < changes in labor intensity or in total economic output create changes in numbers and kinds of jobs >
  • 37.
    Occupational employment istied to total industrial output… ind 1 ind 2 ind 3 ind 4 ind 1 ind 2 ind 3 ind 4 final demand total output ind 1 ind 2 ind 3 ind 4 < industries use different occupations > < industries use different labor intensities > < occupational employment differs by industry >
  • 38.
    Occupational employment iscreated.. … when people use their unique human capital to create goods & services
  • 39.
  • 40.
    Input-output tables areused for… Economic accounting Forecasting “ What if” simulation
  • 41.
    Local uses ofinput-output analysis < producer & purchaser data > < multipliers >
  • 42.
    Multiplier A productof input-output analysis
  • 43.
    producer/purchaser data… ind1 ind 2 ind 3 ind 4 ind 1 ind 2 ind 3 ind 4 final demand total output producers purchasers
  • 44.
    Multipliers Economic impactof change in final demand. Calculated for output, income, employment, taxes, and other factors. Show total effects of change on economy. Expressed as a positive number.
  • 45.
    Producing & purchasingmultiplies… ind 1 ind 2 ind 3 ind 4 ind 1 ind 2 ind 3 ind 4 final demand total demand
  • 46.
    Multipliers display three components of change Direct. Indirect. Induced.
  • 47.
    Direct effects Changesin production as a result of immediate effects of a change in final demand. E.g., increase in demand for autos increases production of autos.
  • 48.
    Indirect effects Changesin production in industries supplying industry delivering the final product. E.g., increase in auto production increases production in supplying industries (like glass, steel, plastics).
  • 49.
    Induced effects Changesin direct and indirect production increase income and, therefore, consumption (and, maybe saving). E.g., workers in auto industry and supplying industries spend and save their income, creating additional economic activity.
  • 50.
    Two types ofmultipliers type 1 = type 2 = direct + indirect direct direct + indirect + induced direct
  • 51.
  • 52.
    Input-output model, extendedto social accounting. Type 1 and type 2 multipliers for output, value added, employment, taxes, and others. Full access to input-output table. Available for nation, state, county, and sub-county. http://www.implan.com
  • 53.
    Marketing waste industriesWaste hauling and landfills are part of our highways and landscape. No one wants waste hauled near their homes. Landfills are not desirable neighbors. The Pennsylvania Waste Industries Association wanted information about economic impact of waste hauling/landfills in Pennsylvania. IMPLAN analysis of multipliers for waste/recycling activity: Employment Personal Income Total Income Value Added Total Output
  • 54.
  • 55.
    Loss of opportunityPenn State research on: Community Costs of Technical Skills Deficits
  • 56.
    Quick response, regionalimpact Penn State research: Economic & Workforce Brief series
  • 57.
    Economic Impact Analysiswith IMPLAN Rose M. Baker David L. Passmore