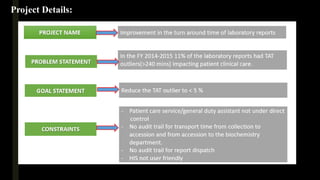
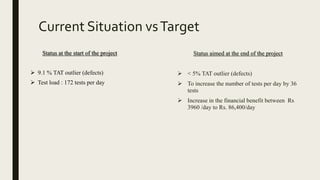
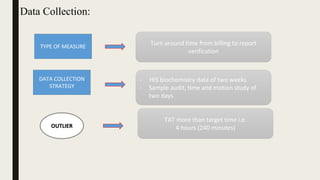
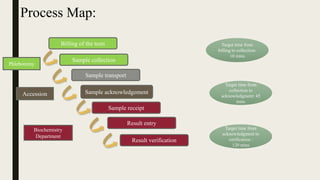
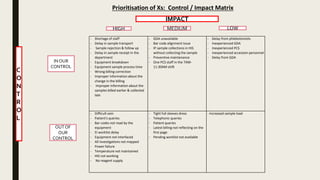
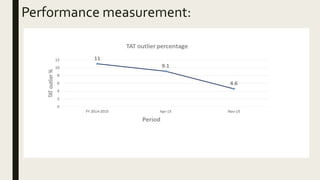
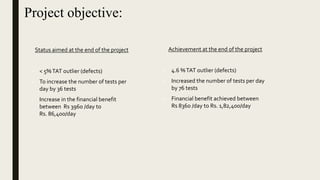
IMPROVEMENT IN THE TURN AROUND
TIME BY USING VARIOUS
METHODOLOGY
Presented by:
Dr Jasbeer Singh
Dr Aditi
Project Details:
Current Situation vsTarget
Status aimed at the end of the project
 < 5% TAT outlier (defects)
 To increase the number of tests per day by 36
tests
 Increase in the financial benefit between Rs
3960 /day to Rs. 86,400/day
Status at the start of the project
 9.1 % TAT outlier (defects)
 Test load : 172 tests per day
Scope: All biochemistry reports
Out of bounds:
- IP and outsourced tests
- samples billed before 6AM and after 4PM
- National holidays and Sundays
- Timed samples
- Urine and other fluid samples
TYPE OF MEASURE
DATA COLLECTION
STRATEGY
OUTLIER
Turn around time from billing to report
verification
- HIS biochemistry data of two weeks
- Sample audit, time and motion study of
two days
TAT more than target time i.e.
4 hours (240 minutes)
Data Collection:
Process Map:
Billing of the tests
Sample collection
Sample transport
Sample acknowledgement
Sample receipt
Result entry
Result verification
Target time from
billing to collection:
10 mins
Target time from
collection to
acknowledgment: 45
mins
Target time from
acknowledgment to
verification :
120 mins
Phlebotomy
Accession
Biochemistry
Department
Cause and effect diagram (Ishikawa):
- Shortage of staff
- Delay in sample transport
- Sample rejection & follow up
- Delay in sample receipt in the
department
- Equipment breakdown
- Equipment sample process time
- Wrong billing correction
- Improper information about the
change in the billing
- Improper information about the
samples billed earlier & collected
late
- GDA unavailable
- Bar code alignment issue
- IP sample collections in HIS
without collecting the sample
- Preventive maintenance
- One PCS staff in the 7AM-
11:30AM shift
- Delay from phlebotomists
- Inexperienced GDA
- Inexperienced PCS
- Inexperienced accession personnel
- Delay from GDA
- Difficult vein
- Patient's queries
- Bar codes not read by the
equipment
- EI worklist delay
- Equipment not interfaced
- All investigations not mapped
- Power failure
- Temperature not maintained
- HIS not working
- No reagent supply
- Tight full sleeves dress
- Telephonic queries
- Patient queries
- Latest billing not reflecting on the
first page
- Pending worklist not available
- Increased sample load
Prioritisation of Xs: Control / Impact Matrix
HIGH MEDIUM LOW
IMPACT
C
O
N
T
R
O
L
IN OUR
CONTROL
OUTOF
OUR
CONTROL
Analyze Phase:
Target time:10 mins
HIS data
Gemba-time
and motion
study
Source: 1. HIS 2.Gemba-
time and motion study
Data: Population
Area: Phlebotomy
Target time: 45 mins
HIS data
Gemba-time
and motion
study
Source: 1. HIS
2.Gemba-time and
motion study
Data: Population
Area: Accession
Target time: 120 mins
HIS data Gemba-time
and motion
study
Source: 1. HIS
2.Gemba-time and
motion study
Data: Population
Area: Biochemistry
Improvement strategy:
Phlebotomy:
■ Non value added steps reduced in the sample collection process
■ Takt time analysis done and staff allotted for sample collection during the peak time and back up
provided for sample collection when there are more three patients waiting
■ Two dedicated GDA staff & their back up trained for sample transport and time management
Accession:
■ GDA training for the transport of samples from accession to the biochemistry department
■ Specific time to be allotted for outsource report dispatch
Biochemistry department:
■ Pending lists monitored at frequent intervals
■ The unresolved IT issues were compensated to some level by the technical staff
suggestions in the brainstorming session: 1. Manual dilution programming for auto
calculation (manual calculation step was skipped) 2. Manual assignment of the position
and rack ID (helped in the reduction of number of steps in the manual process)
Suggestions that were not implemented-
 Two dedicated staff to be provided covering 7AM-5:30PM
 Target time of the transport time to be revised to 10mins from 45mins as we have
pneumatic chute system for sample transport
Performance measurement:
Project objective:
Status aimed at the end of the project
 < 5%TAT outlier (defects)
 To increase the number of tests per
day by 36 tests
 Increase in the financial benefit
between Rs 3960 /day to
Rs. 86,400/day
Achievement at the end of the project
 4.6 %TAT outlier (defects)
 Increased the number of tests per day
by 76 tests
 Financial benefit achieved between
Rs 8360 /day to Rs. 1,82,400/day
For the sustenance of theTAT
 The pending tests list is monitored twice daily at 11 AM and 4 PM by the biochemistry department to
control theTAT of the tests.
 Monthly TAT review in the laboratory quality meeting and quarterly TAT review by the hospital quality
department.
Control Phase:
Conclusion:
Lean six sigma methodology has helped in the achievement of the following:
 increasing productivity without any additional resources;
 improving quality by reducing the opportunities for error; and
 ensuring the improvements are maintained through systematic and timely monitoring.
 The stakeholders have noticed the change and improvement in the turnaround time of biochemistry reports.
 Staff feel appreciated and motivated as their suggestions has played a vital role in the success of this project.
 Furthermore, this project has served as a model that launched other quality improvement programs in the
hospital
Innovative Ideas:
Thank You

www.jkhalsa6.com
Every Ending has a New Beginning
to it…

Improvement in the turn around time

  • 1.
    IMPROVEMENT IN THETURN AROUND TIME BY USING VARIOUS METHODOLOGY Presented by: Dr Jasbeer Singh Dr Aditi
  • 2.
  • 3.
    Current Situation vsTarget Statusaimed at the end of the project  < 5% TAT outlier (defects)  To increase the number of tests per day by 36 tests  Increase in the financial benefit between Rs 3960 /day to Rs. 86,400/day Status at the start of the project  9.1 % TAT outlier (defects)  Test load : 172 tests per day
  • 4.
    Scope: All biochemistryreports Out of bounds: - IP and outsourced tests - samples billed before 6AM and after 4PM - National holidays and Sundays - Timed samples - Urine and other fluid samples
  • 5.
    TYPE OF MEASURE DATACOLLECTION STRATEGY OUTLIER Turn around time from billing to report verification - HIS biochemistry data of two weeks - Sample audit, time and motion study of two days TAT more than target time i.e. 4 hours (240 minutes) Data Collection:
  • 6.
    Process Map: Billing ofthe tests Sample collection Sample transport Sample acknowledgement Sample receipt Result entry Result verification Target time from billing to collection: 10 mins Target time from collection to acknowledgment: 45 mins Target time from acknowledgment to verification : 120 mins Phlebotomy Accession Biochemistry Department
  • 7.
    Cause and effectdiagram (Ishikawa):
  • 8.
    - Shortage ofstaff - Delay in sample transport - Sample rejection & follow up - Delay in sample receipt in the department - Equipment breakdown - Equipment sample process time - Wrong billing correction - Improper information about the change in the billing - Improper information about the samples billed earlier & collected late - GDA unavailable - Bar code alignment issue - IP sample collections in HIS without collecting the sample - Preventive maintenance - One PCS staff in the 7AM- 11:30AM shift - Delay from phlebotomists - Inexperienced GDA - Inexperienced PCS - Inexperienced accession personnel - Delay from GDA - Difficult vein - Patient's queries - Bar codes not read by the equipment - EI worklist delay - Equipment not interfaced - All investigations not mapped - Power failure - Temperature not maintained - HIS not working - No reagent supply - Tight full sleeves dress - Telephonic queries - Patient queries - Latest billing not reflecting on the first page - Pending worklist not available - Increased sample load Prioritisation of Xs: Control / Impact Matrix HIGH MEDIUM LOW IMPACT C O N T R O L IN OUR CONTROL OUTOF OUR CONTROL
  • 9.
    Analyze Phase: Target time:10mins HIS data Gemba-time and motion study Source: 1. HIS 2.Gemba- time and motion study Data: Population Area: Phlebotomy
  • 10.
    Target time: 45mins HIS data Gemba-time and motion study Source: 1. HIS 2.Gemba-time and motion study Data: Population Area: Accession
  • 11.
    Target time: 120mins HIS data Gemba-time and motion study Source: 1. HIS 2.Gemba-time and motion study Data: Population Area: Biochemistry
  • 12.
    Improvement strategy: Phlebotomy: ■ Nonvalue added steps reduced in the sample collection process ■ Takt time analysis done and staff allotted for sample collection during the peak time and back up provided for sample collection when there are more three patients waiting ■ Two dedicated GDA staff & their back up trained for sample transport and time management Accession: ■ GDA training for the transport of samples from accession to the biochemistry department ■ Specific time to be allotted for outsource report dispatch
  • 13.
    Biochemistry department: ■ Pendinglists monitored at frequent intervals ■ The unresolved IT issues were compensated to some level by the technical staff suggestions in the brainstorming session: 1. Manual dilution programming for auto calculation (manual calculation step was skipped) 2. Manual assignment of the position and rack ID (helped in the reduction of number of steps in the manual process) Suggestions that were not implemented-  Two dedicated staff to be provided covering 7AM-5:30PM  Target time of the transport time to be revised to 10mins from 45mins as we have pneumatic chute system for sample transport
  • 14.
  • 15.
    Project objective: Status aimedat the end of the project  < 5%TAT outlier (defects)  To increase the number of tests per day by 36 tests  Increase in the financial benefit between Rs 3960 /day to Rs. 86,400/day Achievement at the end of the project  4.6 %TAT outlier (defects)  Increased the number of tests per day by 76 tests  Financial benefit achieved between Rs 8360 /day to Rs. 1,82,400/day
  • 16.
    For the sustenanceof theTAT  The pending tests list is monitored twice daily at 11 AM and 4 PM by the biochemistry department to control theTAT of the tests.  Monthly TAT review in the laboratory quality meeting and quarterly TAT review by the hospital quality department. Control Phase:
  • 17.
    Conclusion: Lean six sigmamethodology has helped in the achievement of the following:  increasing productivity without any additional resources;  improving quality by reducing the opportunities for error; and  ensuring the improvements are maintained through systematic and timely monitoring.  The stakeholders have noticed the change and improvement in the turnaround time of biochemistry reports.  Staff feel appreciated and motivated as their suggestions has played a vital role in the success of this project.  Furthermore, this project has served as a model that launched other quality improvement programs in the hospital
  • 18.
  • 19.
    Thank You  www.jkhalsa6.com Every Endinghas a New Beginning to it…