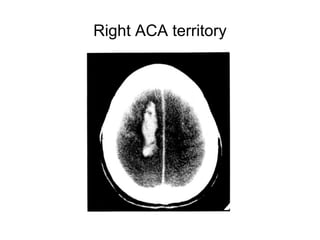
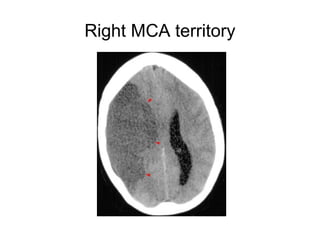
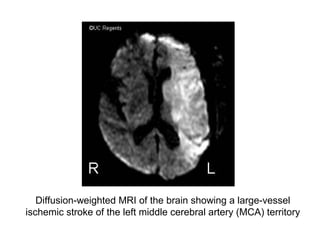
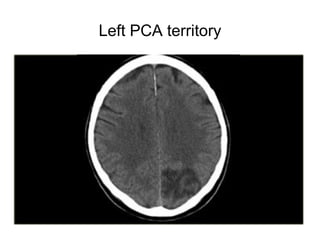
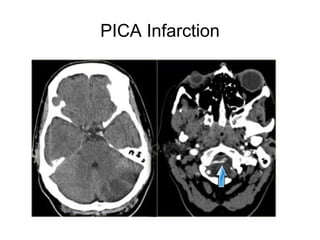
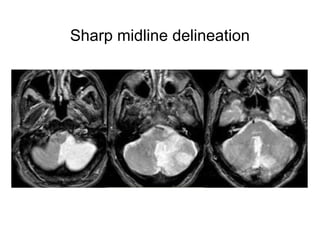
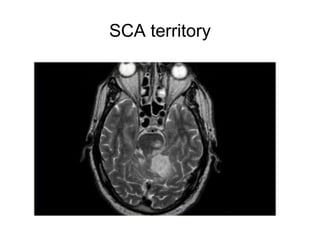
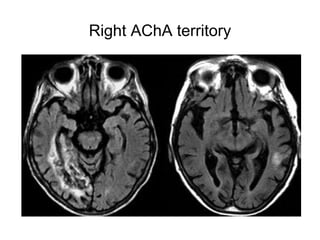
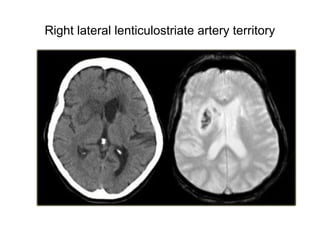
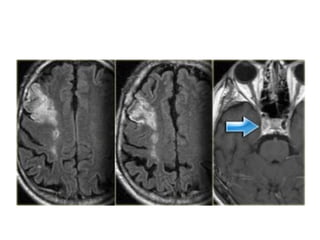
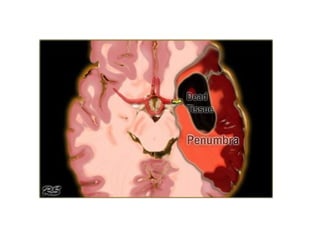
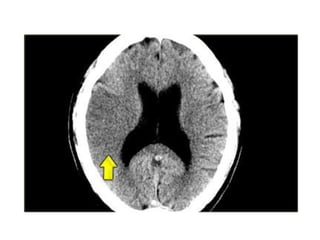
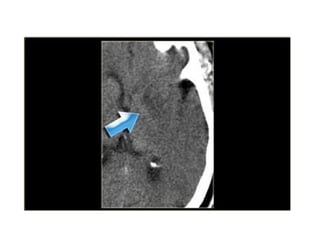
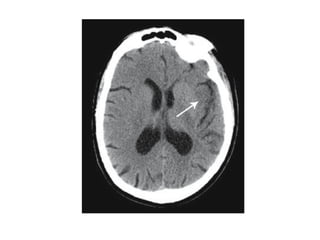
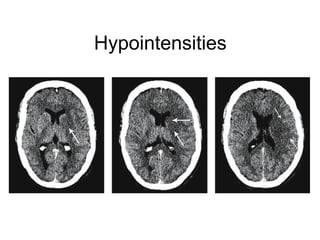
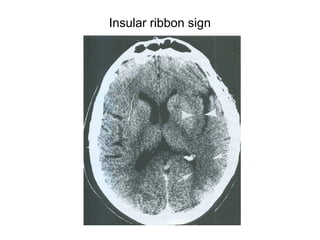
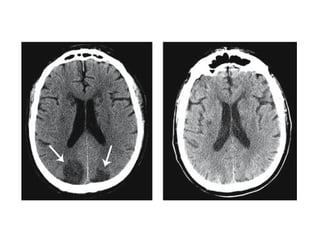
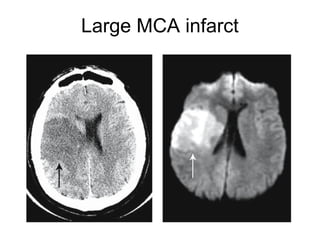
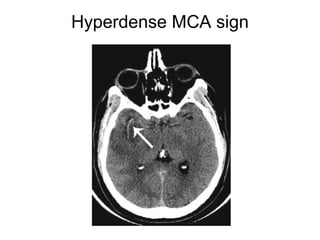
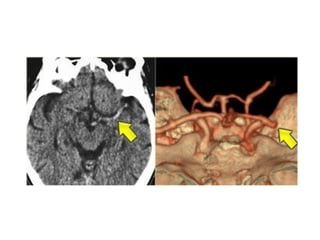
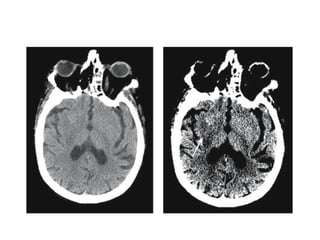
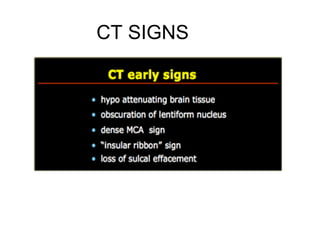
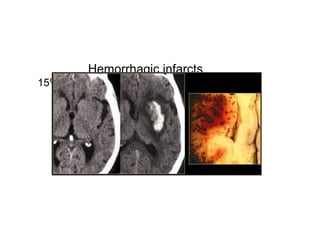
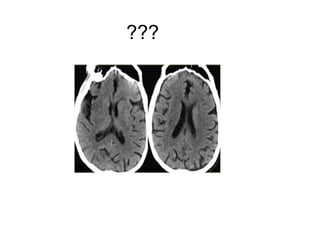
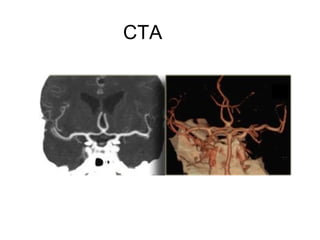
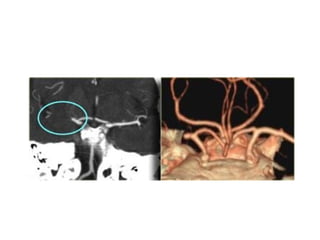
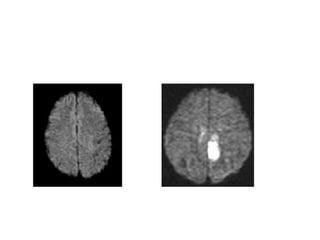
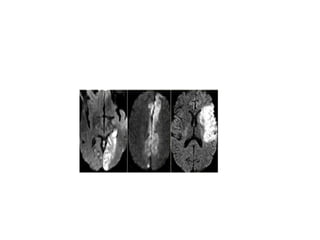
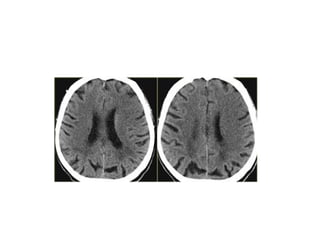
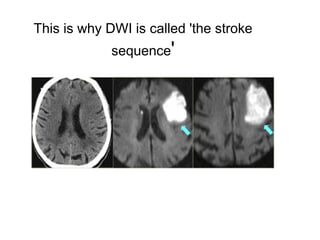
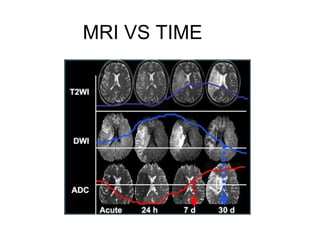
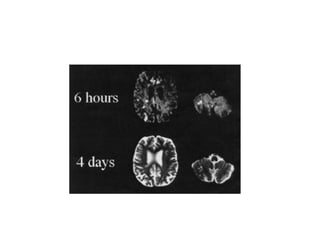
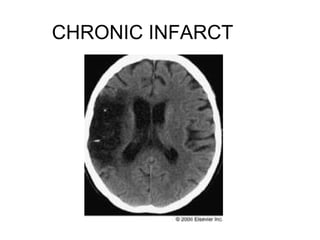
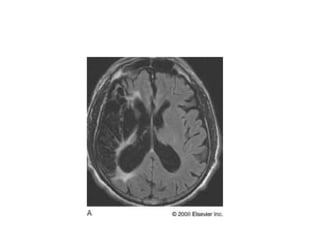
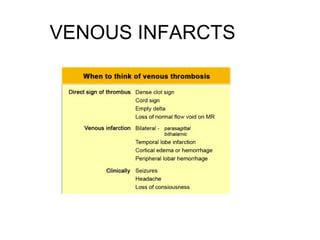
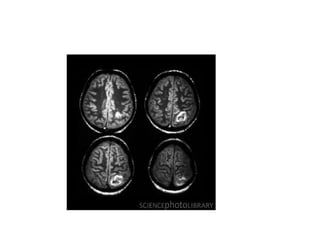
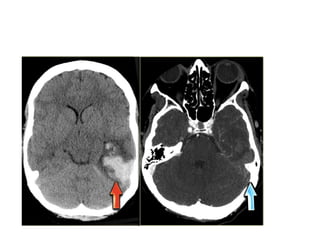
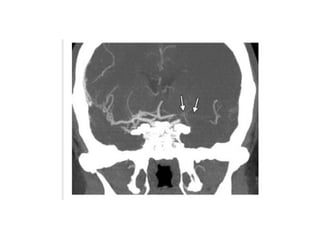
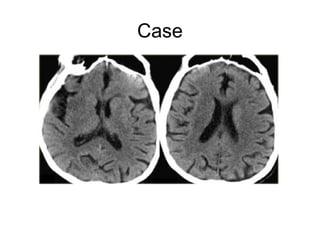
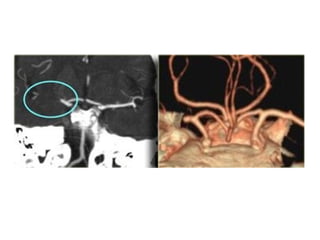
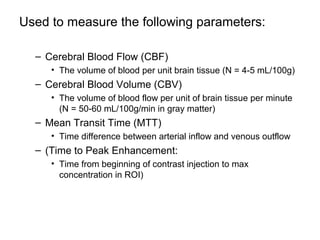
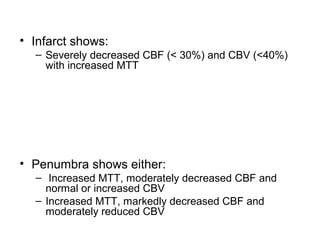
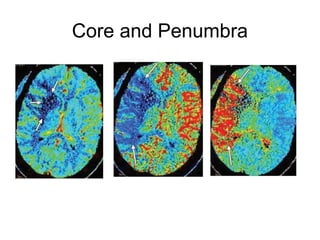
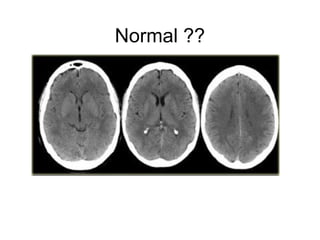
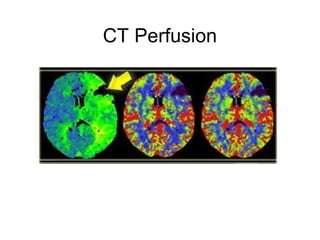
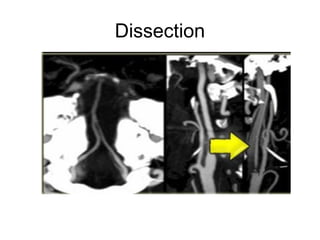
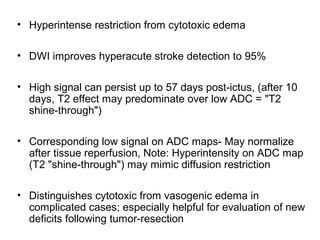
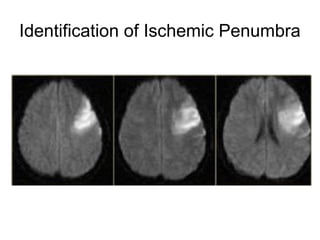
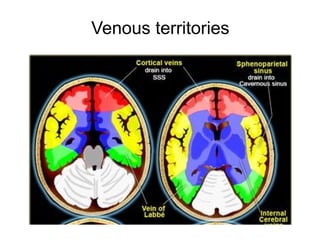
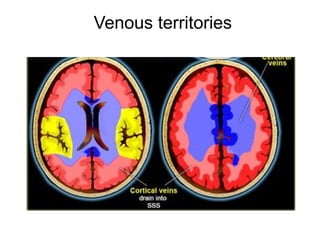
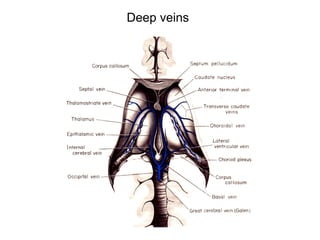
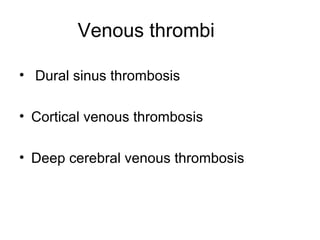
IMAGING
IN
ACUTE STROKE
Dr Anoop.K.R
Asst professor
General Medicine
MMCH,Calicut
Vascular territories of the brain
Left ACA territory
Right ACA territory
Right MCA territory
Diffusion-weighted MRI of the brain showing a large-vessel
ischemic stroke of the left middle cerebral artery (MCA) territory
Left PCA territory
PICA Infarction
Sharp midline delineation
SCA territory
Right AChA territory
Right lateral lenticulostriate artery territory
Watershed zones
The term stroke is most accurately used to
describe a clinical event that consists of the
sudden onset of neurologic symptoms.
Cerebral infarction, by contrast, is a term
that describes a lethal tissue-level ischemic
event that may or may not cause
symptoms.
• In the absence of blood flow, available energy can maintain
neuronal viability for 2-3 minutes
• In the brain, ischemia is incomplete, with collateral supply
• Cerebral ischemia = central irreversibly infarcted tissue core
surrounded by peripheral region of stunned cells, the
‘penumbra’
• The penumbra is potentially salvageable with early
recannalization
Cerebral infarction accounts for approximately 85%
of all stroke.
-- which may be arterial ( large vessel or small
vessel ) or venous
Primary cerebral hemorrhages account for most of
the remainder.
The goals of an imaging evaluation for acute stroke are
to:
•Establish a diagnosis as early as possible
•Guide appropriate treatment
•Assess location and size of territory involved
•Rule out hemorrhage and stroke mimics
•Obtain accurate information about the intracranial
vasculature and brain perfusion for guidance in
selecting the appropriate therapy
• Parenchyma:
– Assess early signs of acute stroke, rule out hemorrhage
• Pipes
– Assess extracranial circulation (carotid and vertebral
arteries of the neck) and intracranial circulation for
evidence of intravascular thrombus
• Perfusion
– Assess cerebral blood volume, cerebral blood flow, and
mean transit time
• Penumbra
– Assess tissue at risk of dying if ischemia continues with
out re-canalization of intravascular thrombus
The speed, widespread availability, low cost, and
accuracy in detecting subarachnoid and intracranial
hemorrhage have led CT scanning to become the first-
line diagnostic test for the emergency evaluation of
acute stroke.
Head CT scans can detect ischemic brain regions
within 6 h of stroke onset.
Importantly, the identification of ischemic brain
tissue by CT not only defines regions likely to
infarct, but also may predict outcome and
response to intravenous (i.v.) or intra-arterial
(i.a.) thrombolytic therapy.
CT is used to exclude parenchymal hemorrhage
and significant established infarction.
Unenhanced CT findings can additionally,in some
settings, help to predict hemorrhagic
transformation of already necrotic tissue
following arterial reperfusion.
Early ischemic signs
1. Focal parenchymal hypodensity
– Of the insular ribbon
– Of the lenticular nuclei
2. Cortical swelling with sulcal effacement
3. Loss of gray-white matter differentiation
4. Hyperdense MCA sign
Certain points to be kept in mind
• to maximize image quality – especially of
the posterior fossa structures
• to minimize radiation dose
• to minimize helical artifact
• to minimize image noise
Hypointensities
Insular ribbon sign
Effect of patient position
Large MCA infarct
Hyperdense MCA sign
Physical basis of imaging
findings
A 1% increase in net tissue water
produces 2.5 HU decrease on NCCT
The finding of early (up to 6 h) parenchymal
hypodensity has been hypothesized to be
secondary to cytotoxic edema, caused by lactic
acidosis and failure of cell membrane ion pumps
due to an inadequate ATP supply.
This process may involve redistribution of tissue water
from the extracellular to the intracellular space, but
because there is little overall change in net tissue
water, there is only minimal reduction in gray and
white matter brain parenchymal Hounsfield
attenuation.
When stroke-related edema is extensive and life-
threatening, it is sometimes called malignant brain
edema.
Life-threatening brain edema that is associated with
stroke occurs most commonly in patients with
extensive ischemia in the temtory of a middle
cerebral artery (MCA).
Interesting phenomenon occurs in the
subacute phase of stoke is the “CT
fogging effect,” in which irreversibly
infarcted regions “disappear” on
unenhanced CT performed on older
generation scanners, 2–6 weeks after
stroke onset
Effect of narrowing window width
• The Alberta Stroke Programe Early CT Score (ASPECTS) is a
10-point quantitative topographic CT scan score used in patients
with middle cerebral artery (MCA) stroke.
• Segmental assessment of MCA territory is made and 1 point is
removed from the initial score of 10 if there is evidence of
infarction in that region.
• caudate
• putamen
• internal capsule*
• insular cortex
• M1: "anterior MCA cortex," corresponding to frontal operculum
• M2: "MCA cortex lateral to insular ribbon" corresponding to
anterior temporal lobe
• M3: "posterior MCA cortex" corresponding to posterior temporal
lobe
•M4: "anterior MCA territory immediately superior to M1"
•M5: "lateral MCA territory immediately superior to M2"
•M6: "posterior MCA territory immediately superior to M3"
(M1 to M3 are at the level of the basal ganglia and M4 to
M6 are at the level of the ventricles immediately above
the basal ganglia)
An ASPECTS score less than or equal to 7 predicts
worse functional outcome at 3 months as well as
symptomatic haemorrhage.
Lacunar infarcts
• Lacunar infarcts are small infarcts in the deeper parts of
the brain (basal ganglia, thalamus, white matter) and in
the brain stem.
• Lacunar infarcts are caused by occlusion of a single
deep penetrating artery.
• Lacunar infarcts account for 25% of all ischemic strokes.
• Atherosclerosis is the most common cause of lacunar
infarcts followed by emboli.
NECT
• Because of their small size, most "true" lacunar
infarcts not seen on CT scans
• Visible lacunes seen as small, well
circumscribed areas of low (CSF) attenuation
• Usually seen in setting of more extensive white
matter disease; typically multiple
MR Findings
• Tl WI: Small, well circumscribed hypointense foci
• T2WI: Small, well circumscribed hyperintense foci
• FLAIR:Typically increased in signal
• DWI
o Restricted diffusion (hyperintense) if acute/subacute
o May show small lesions otherwise undetectable
• Tl C+: May enhance if late acute/early subacute
• MRA: Normal
Lacunes may be confused with other empty
spaces, such as enlarged perivascular
Virchow-Robin spaces (VRS).
The VRS are extensions of the
subarachnoid space that accompany
vessels entering the brain parenchyma.
The goal of imaging in a patient with acute
stroke is:
• Exclude hemorrhage
• Differentiate between irreversibly affected
brain tissue and reversibly impaired tissue
(dead tissue versus tissue at risk)
• Identify stenosis or occlusion of major
extra- and intracranial arteries
CT SCAN
• CT has the advantage of being available
24 hours a day and is the gold standard
for hemorrhage.
Hemorrhage on MR images can be quite
confusing.
On CT 60% of infarcts are seen within 3-6
hrs and virtually all are seen in 24 hours.
CT SIGNS
1.Hypoattenuating brain tissue
• The diagnosis is infarction, because of the
location (vascular territory of the middle
cerebral artery (MCA) and because of the
involvement of gray and white matter,
which is also very typical for infarction.
2.Obscuration of the lentiform
nucleus
• Obscuration of the lentiform nucleus, also
called blurred basal ganglia, is an
important sign of infarction.
It is seen in middle cerebral artery
infarction and is one of the earliest and
most frequently seen signs.
The basal ganglia are almost always
involved in MCA-infarction.
3.Insular Ribbon sign
• This refers to hypodensity and swelling of
the insular cortex.
It is a very indicative and subtle early CT-
sign of infarction in the territory of the
middle cerebral artery.
It has to be differentiated from herpes
encephalitis.
4.Dense MCA sign
• This is a result of thrombus or embolus in
the MCA.
Hemorrhagic infarcts
15% of MCA infarcts are initially hemorrhagic.
???
CTA
MRI
• On T2WI and FLAIR infarction is seen as
high SI.
These sequences detect 80% of
infarctions before 24 hours.
They may be negative up to 2-4 hours
post-ictus!
• High signal on conventional MR-
sequences is comparable to hypodensity
on CT.
It is the result of irreversible injury with cell
death.
So hyperintensity means BAD news: dead
brain.
Diffusion Weighted Imaging (DWI)
• DWI is the most sensitive sequence for
stroke imaging.
DWI is sensitive to restriction of Brownian
motion of extracellular water due to
imbalance caused by cytotoxic edema.
Normally water protons have the ability to
diffuse extracellularly and loose signal.
High intensity on DWI indicates restriction
of the ability of water protons to diffuse
extracellularly.
This is why DWI is called 'the stroke
sequence'
MRI VS TIME
• In the acute phase T2WI will be normal,
but in time the infarcted area will become
hyperintense.
• The hyperintensity on T2WI reaches its
maximum between 7 and 30 days. After
this it starts to fade
MRI VS TIME
• DWI is already positive in the acute phase
and then becomes more bright with a
maximum at 7 days.
• DWI in brain infarction will be positive for
approximately for 3 weeks after onset (in
spinal cord infarction DWI is only positive
for one week!).
MRI VS TIME
• ADC will be of low signal intensity with a
maximum at 24 hours and then will
increase in signal intensity and finally
becomes bright in the chronic stage.
INFARCT??
CHRONIC INFARCT
VENOUS INFARCTS
CT Angiography
and
CT Perfusion
• For assessment of intracranial and extracranial
circulation
• Can demonstrate thrombi
• Timed bolus of contrast for vessel enhancement
• Can guide decision regarding intraarterial or mechanical
thrombolysis by quantifying clot burden
Normal CT Angiography
Case
CT Perfusion
• With CT and MR-diffusion we can get a good impression of
the area that is infarcted.
• But, we cannot preclude a large ischemic penumbra (tissue
at risk).
• With perfusion studies we monitor the first pass of an
iodinated contrast agent bolus through the cerebral
vasculature.
• Areas of decreased perfusion will tell us which area is at
risk.
Used to measure the following parameters:
– Cerebral Blood Flow (CBF)
• The volume of blood per unit brain tissue (N = 4-5 mL/100g)
– Cerebral Blood Volume (CBV)
• The volume of blood flow per unit of brain tissue per minute
(N = 50-60 mL/100g/min in gray matter)
– Mean Transit Time (MTT)
• Time difference between arterial inflow and venous outflow
– (Time to Peak Enhancement:
• Time from beginning of contrast injection to max
concentration in ROI)
• Infarct shows:
– Severely decreased CBF (< 30%) and CBV (<40%)
with increased MTT
• Penumbra shows either:
– Increased MTT, moderately decreased CBF and
normal or increased CBV
– Increased MTT, markedly decreased CBF and
moderately reduced CBV
Core and Penumbra
Normal ??
CT Perfusion
Dissection
Diffusion Weighted Imaging (DWI)
DWI is the most sensitive sequence for stroke imaging.
DWI is sensitive to restriction of Brownian motion of
extracellular water due to imbalance caused by cytotoxic
edema.
Normally water protons have the ability to diffuse
extracellularly and loose signal.
High intensity on DWI indicates restriction of the ability of
water protons to diffuse extracellularly.
• Acute stroke causes excess intracellular water
accumulation or “cytotoxic edema”, with an overall
decreased rate of water molecular diffusion within
the affected tissue.
• Tissues with a higher rate of diffusion undergo a greater loss of
signal in a given period of time than do tissues with a lower
diffusion rate.
• Therefore, areas of cytotoxic edema, in which the motion of
water molecules is restricted, appear brighter on diffusion-
weighted images because of lesser signal losses.
• Hyperintense restriction from cytotoxic edema
• DWI improves hyperacute stroke detection to 95%
• High signal can persist up to 57 days post-ictus, (after 10
days, T2 effect may predominate over low ADC = "T2
shine-through")
• Corresponding low signal on ADC maps- May normalize
after tissue reperfusion, Note: Hyperintensity on ADC map
(T2 "shine-through") may mimic diffusion restriction
• Distinguishes cytotoxic from vasogenic edema in
complicated cases; especially helpful for evaluation of new
deficits following tumor-resection
Territories in DWI
Normal ??
Left Frontal diffusion restriction
Identification of Ischemic Penumbra
MR Findings
• Tl WI: Early cortical swelling & hypointensity, loss of gray-
white borders
• T2WI
Early cortical swelling, hyperintensity in affected distribution
May normalize 2-3 weeks post-ictus = MR "fogging"
• FLAIR
May be positive (hyperintense) when other sequences
normal (as early as 6 hrs post-ictus)
MR intra-arterial signal on FLAIR= early specific signof
major vessel occlusion
• Occasionally, the territories of supply of the
lenticulostriate arteries may be the only regions
that undergo infarction in MCA stroke .
• When occlusion of the MCA occurs distal to
the MI segment (and thus distal to the origins of
the lenticulostriatearteries), infarction in the
cortical territory of the MCA may occur without
infarction of the basal ganglia.
Post Gadolinium study
Parenchymal enhancement associated with ischemic
stroke, by comparison, is most commonly seen in the
subacute time frame is seen to some degree in most
patients by 7 days following an ischemic stroke
Venous infarcts in brief
Venous drainage
Venous territories
Venous territories
Deep veins
Venous thrombi
• Dural sinus thrombosis
• Cortical venous thrombosis
• Deep cerebral venous thrombosis
• Thrombus initially forms in dural sinus
• Clot propagates into cortical veins
• Venous drainage obstructed, venous pressure
elevated
• Blood-brain barrier breakdown with vasogenic
edema, hemorrhage
• Venous infarct with cytotoxic edema ensues
Venous ischemia
• Type 1: No abnormality
• Type 2: High signal on T2WI/FLAIR; no
enhancement
• Type 3: High signal on T2WI/FLAIR;
enhancement present
• Type 4: Hemorrhage or venous infarction
Empty delta sign
Cord sign
Thank you

Imaginginacutestroke dr anoop.k.r

  • 1.
    IMAGING IN ACUTE STROKE Dr Anoop.K.R Asstprofessor General Medicine MMCH,Calicut
  • 2.
  • 8.
  • 9.
  • 10.
  • 11.
    Diffusion-weighted MRI ofthe brain showing a large-vessel ischemic stroke of the left middle cerebral artery (MCA) territory
  • 12.
  • 13.
  • 14.
  • 15.
  • 16.
  • 17.
  • 18.
  • 22.
    The term strokeis most accurately used to describe a clinical event that consists of the sudden onset of neurologic symptoms. Cerebral infarction, by contrast, is a term that describes a lethal tissue-level ischemic event that may or may not cause symptoms.
  • 23.
    • In theabsence of blood flow, available energy can maintain neuronal viability for 2-3 minutes • In the brain, ischemia is incomplete, with collateral supply • Cerebral ischemia = central irreversibly infarcted tissue core surrounded by peripheral region of stunned cells, the ‘penumbra’ • The penumbra is potentially salvageable with early recannalization
  • 25.
    Cerebral infarction accountsfor approximately 85% of all stroke. -- which may be arterial ( large vessel or small vessel ) or venous Primary cerebral hemorrhages account for most of the remainder.
  • 26.
    The goals ofan imaging evaluation for acute stroke are to: •Establish a diagnosis as early as possible •Guide appropriate treatment •Assess location and size of territory involved •Rule out hemorrhage and stroke mimics •Obtain accurate information about the intracranial vasculature and brain perfusion for guidance in selecting the appropriate therapy
  • 28.
    • Parenchyma: – Assessearly signs of acute stroke, rule out hemorrhage • Pipes – Assess extracranial circulation (carotid and vertebral arteries of the neck) and intracranial circulation for evidence of intravascular thrombus • Perfusion – Assess cerebral blood volume, cerebral blood flow, and mean transit time • Penumbra – Assess tissue at risk of dying if ischemia continues with out re-canalization of intravascular thrombus
  • 29.
    The speed, widespreadavailability, low cost, and accuracy in detecting subarachnoid and intracranial hemorrhage have led CT scanning to become the first- line diagnostic test for the emergency evaluation of acute stroke.
  • 30.
    Head CT scanscan detect ischemic brain regions within 6 h of stroke onset. Importantly, the identification of ischemic brain tissue by CT not only defines regions likely to infarct, but also may predict outcome and response to intravenous (i.v.) or intra-arterial (i.a.) thrombolytic therapy.
  • 31.
    CT is usedto exclude parenchymal hemorrhage and significant established infarction. Unenhanced CT findings can additionally,in some settings, help to predict hemorrhagic transformation of already necrotic tissue following arterial reperfusion.
  • 32.
    Early ischemic signs 1.Focal parenchymal hypodensity – Of the insular ribbon – Of the lenticular nuclei 2. Cortical swelling with sulcal effacement 3. Loss of gray-white matter differentiation 4. Hyperdense MCA sign
  • 36.
    Certain points tobe kept in mind • to maximize image quality – especially of the posterior fossa structures • to minimize radiation dose • to minimize helical artifact • to minimize image noise
  • 37.
  • 38.
  • 39.
  • 41.
  • 42.
  • 44.
    Physical basis ofimaging findings
  • 45.
    A 1% increasein net tissue water produces 2.5 HU decrease on NCCT
  • 46.
    The finding ofearly (up to 6 h) parenchymal hypodensity has been hypothesized to be secondary to cytotoxic edema, caused by lactic acidosis and failure of cell membrane ion pumps due to an inadequate ATP supply. This process may involve redistribution of tissue water from the extracellular to the intracellular space, but because there is little overall change in net tissue water, there is only minimal reduction in gray and white matter brain parenchymal Hounsfield attenuation.
  • 47.
    When stroke-related edemais extensive and life- threatening, it is sometimes called malignant brain edema. Life-threatening brain edema that is associated with stroke occurs most commonly in patients with extensive ischemia in the temtory of a middle cerebral artery (MCA).
  • 48.
    Interesting phenomenon occursin the subacute phase of stoke is the “CT fogging effect,” in which irreversibly infarcted regions “disappear” on unenhanced CT performed on older generation scanners, 2–6 weeks after stroke onset
  • 50.
    Effect of narrowingwindow width
  • 51.
    • The AlbertaStroke Programe Early CT Score (ASPECTS) is a 10-point quantitative topographic CT scan score used in patients with middle cerebral artery (MCA) stroke. • Segmental assessment of MCA territory is made and 1 point is removed from the initial score of 10 if there is evidence of infarction in that region. • caudate • putamen • internal capsule* • insular cortex • M1: "anterior MCA cortex," corresponding to frontal operculum • M2: "MCA cortex lateral to insular ribbon" corresponding to anterior temporal lobe • M3: "posterior MCA cortex" corresponding to posterior temporal lobe
  • 52.
    •M4: "anterior MCAterritory immediately superior to M1" •M5: "lateral MCA territory immediately superior to M2" •M6: "posterior MCA territory immediately superior to M3" (M1 to M3 are at the level of the basal ganglia and M4 to M6 are at the level of the ventricles immediately above the basal ganglia) An ASPECTS score less than or equal to 7 predicts worse functional outcome at 3 months as well as symptomatic haemorrhage.
  • 53.
    Lacunar infarcts • Lacunarinfarcts are small infarcts in the deeper parts of the brain (basal ganglia, thalamus, white matter) and in the brain stem. • Lacunar infarcts are caused by occlusion of a single deep penetrating artery. • Lacunar infarcts account for 25% of all ischemic strokes. • Atherosclerosis is the most common cause of lacunar infarcts followed by emboli.
  • 54.
    NECT • Because oftheir small size, most "true" lacunar infarcts not seen on CT scans • Visible lacunes seen as small, well circumscribed areas of low (CSF) attenuation • Usually seen in setting of more extensive white matter disease; typically multiple
  • 55.
    MR Findings • TlWI: Small, well circumscribed hypointense foci • T2WI: Small, well circumscribed hyperintense foci • FLAIR:Typically increased in signal • DWI o Restricted diffusion (hyperintense) if acute/subacute o May show small lesions otherwise undetectable • Tl C+: May enhance if late acute/early subacute • MRA: Normal
  • 58.
    Lacunes may beconfused with other empty spaces, such as enlarged perivascular Virchow-Robin spaces (VRS). The VRS are extensions of the subarachnoid space that accompany vessels entering the brain parenchyma.
  • 60.
    The goal ofimaging in a patient with acute stroke is: • Exclude hemorrhage • Differentiate between irreversibly affected brain tissue and reversibly impaired tissue (dead tissue versus tissue at risk) • Identify stenosis or occlusion of major extra- and intracranial arteries
  • 61.
    CT SCAN • CThas the advantage of being available 24 hours a day and is the gold standard for hemorrhage. Hemorrhage on MR images can be quite confusing. On CT 60% of infarcts are seen within 3-6 hrs and virtually all are seen in 24 hours.
  • 62.
  • 63.
  • 64.
    • The diagnosisis infarction, because of the location (vascular territory of the middle cerebral artery (MCA) and because of the involvement of gray and white matter, which is also very typical for infarction.
  • 65.
    2.Obscuration of thelentiform nucleus
  • 66.
    • Obscuration ofthe lentiform nucleus, also called blurred basal ganglia, is an important sign of infarction. It is seen in middle cerebral artery infarction and is one of the earliest and most frequently seen signs. The basal ganglia are almost always involved in MCA-infarction.
  • 67.
  • 68.
    • This refersto hypodensity and swelling of the insular cortex. It is a very indicative and subtle early CT- sign of infarction in the territory of the middle cerebral artery. It has to be differentiated from herpes encephalitis.
  • 69.
  • 72.
    • This isa result of thrombus or embolus in the MCA.
  • 73.
    Hemorrhagic infarcts 15% ofMCA infarcts are initially hemorrhagic.
  • 74.
  • 75.
  • 77.
    MRI • On T2WIand FLAIR infarction is seen as high SI. These sequences detect 80% of infarctions before 24 hours. They may be negative up to 2-4 hours post-ictus!
  • 78.
    • High signalon conventional MR- sequences is comparable to hypodensity on CT. It is the result of irreversible injury with cell death. So hyperintensity means BAD news: dead brain.
  • 80.
    Diffusion Weighted Imaging(DWI) • DWI is the most sensitive sequence for stroke imaging. DWI is sensitive to restriction of Brownian motion of extracellular water due to imbalance caused by cytotoxic edema. Normally water protons have the ability to diffuse extracellularly and loose signal. High intensity on DWI indicates restriction of the ability of water protons to diffuse extracellularly.
  • 84.
    This is whyDWI is called 'the stroke sequence'
  • 85.
  • 86.
    • In theacute phase T2WI will be normal, but in time the infarcted area will become hyperintense. • The hyperintensity on T2WI reaches its maximum between 7 and 30 days. After this it starts to fade
  • 87.
  • 88.
    • DWI isalready positive in the acute phase and then becomes more bright with a maximum at 7 days. • DWI in brain infarction will be positive for approximately for 3 weeks after onset (in spinal cord infarction DWI is only positive for one week!).
  • 89.
  • 90.
    • ADC willbe of low signal intensity with a maximum at 24 hours and then will increase in signal intensity and finally becomes bright in the chronic stage.
  • 92.
  • 95.
  • 97.
  • 100.
  • 101.
    • For assessmentof intracranial and extracranial circulation • Can demonstrate thrombi • Timed bolus of contrast for vessel enhancement • Can guide decision regarding intraarterial or mechanical thrombolysis by quantifying clot burden
  • 102.
  • 106.
  • 108.
    CT Perfusion • WithCT and MR-diffusion we can get a good impression of the area that is infarcted. • But, we cannot preclude a large ischemic penumbra (tissue at risk). • With perfusion studies we monitor the first pass of an iodinated contrast agent bolus through the cerebral vasculature. • Areas of decreased perfusion will tell us which area is at risk.
  • 109.
    Used to measurethe following parameters: – Cerebral Blood Flow (CBF) • The volume of blood per unit brain tissue (N = 4-5 mL/100g) – Cerebral Blood Volume (CBV) • The volume of blood flow per unit of brain tissue per minute (N = 50-60 mL/100g/min in gray matter) – Mean Transit Time (MTT) • Time difference between arterial inflow and venous outflow – (Time to Peak Enhancement: • Time from beginning of contrast injection to max concentration in ROI)
  • 110.
    • Infarct shows: –Severely decreased CBF (< 30%) and CBV (<40%) with increased MTT • Penumbra shows either: – Increased MTT, moderately decreased CBF and normal or increased CBV – Increased MTT, markedly decreased CBF and moderately reduced CBV
  • 111.
  • 112.
  • 113.
  • 114.
  • 115.
    Diffusion Weighted Imaging(DWI) DWI is the most sensitive sequence for stroke imaging. DWI is sensitive to restriction of Brownian motion of extracellular water due to imbalance caused by cytotoxic edema. Normally water protons have the ability to diffuse extracellularly and loose signal. High intensity on DWI indicates restriction of the ability of water protons to diffuse extracellularly.
  • 116.
    • Acute strokecauses excess intracellular water accumulation or “cytotoxic edema”, with an overall decreased rate of water molecular diffusion within the affected tissue. • Tissues with a higher rate of diffusion undergo a greater loss of signal in a given period of time than do tissues with a lower diffusion rate. • Therefore, areas of cytotoxic edema, in which the motion of water molecules is restricted, appear brighter on diffusion- weighted images because of lesser signal losses.
  • 117.
    • Hyperintense restrictionfrom cytotoxic edema • DWI improves hyperacute stroke detection to 95% • High signal can persist up to 57 days post-ictus, (after 10 days, T2 effect may predominate over low ADC = "T2 shine-through") • Corresponding low signal on ADC maps- May normalize after tissue reperfusion, Note: Hyperintensity on ADC map (T2 "shine-through") may mimic diffusion restriction • Distinguishes cytotoxic from vasogenic edema in complicated cases; especially helpful for evaluation of new deficits following tumor-resection
  • 119.
  • 120.
  • 121.
  • 122.
  • 124.
    MR Findings • TlWI: Early cortical swelling & hypointensity, loss of gray- white borders • T2WI Early cortical swelling, hyperintensity in affected distribution May normalize 2-3 weeks post-ictus = MR "fogging" • FLAIR May be positive (hyperintense) when other sequences normal (as early as 6 hrs post-ictus) MR intra-arterial signal on FLAIR= early specific signof major vessel occlusion
  • 125.
    • Occasionally, theterritories of supply of the lenticulostriate arteries may be the only regions that undergo infarction in MCA stroke . • When occlusion of the MCA occurs distal to the MI segment (and thus distal to the origins of the lenticulostriatearteries), infarction in the cortical territory of the MCA may occur without infarction of the basal ganglia.
  • 127.
  • 128.
    Parenchymal enhancement associatedwith ischemic stroke, by comparison, is most commonly seen in the subacute time frame is seen to some degree in most patients by 7 days following an ischemic stroke
  • 129.
  • 130.
  • 131.
  • 132.
  • 133.
  • 134.
    Venous thrombi • Duralsinus thrombosis • Cortical venous thrombosis • Deep cerebral venous thrombosis
  • 135.
    • Thrombus initiallyforms in dural sinus • Clot propagates into cortical veins • Venous drainage obstructed, venous pressure elevated • Blood-brain barrier breakdown with vasogenic edema, hemorrhage • Venous infarct with cytotoxic edema ensues
  • 136.
    Venous ischemia • Type1: No abnormality • Type 2: High signal on T2WI/FLAIR; no enhancement • Type 3: High signal on T2WI/FLAIR; enhancement present • Type 4: Hemorrhage or venous infarction
  • 137.
  • 139.
  • 140.