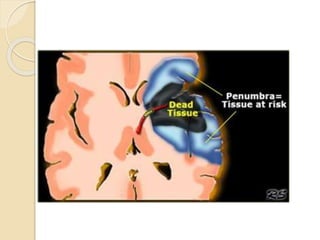
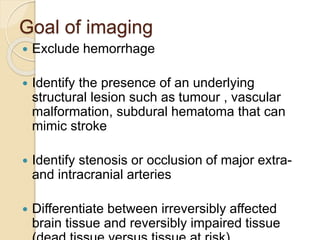
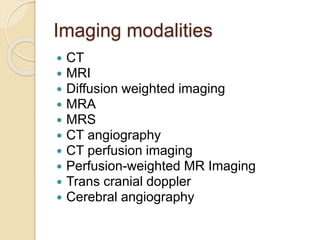
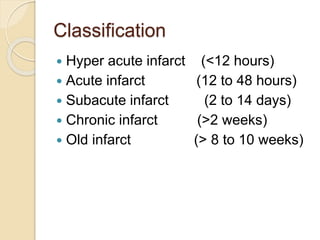
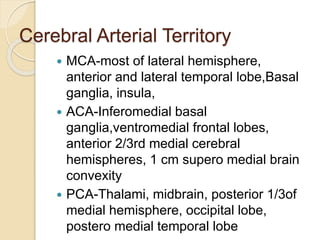
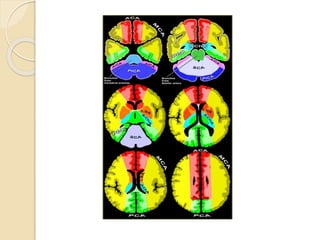
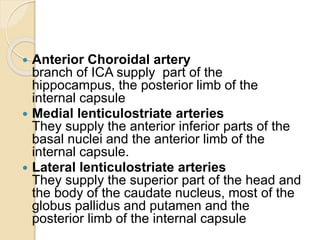
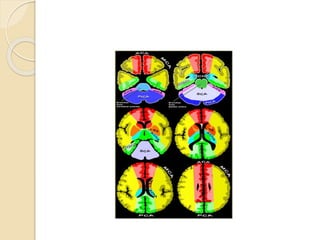
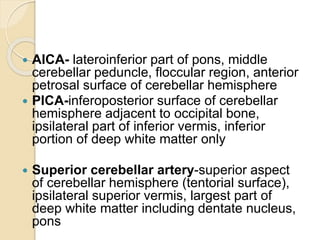
CEREBRAL INFARCTS
Pathophysiology
 Significantly diminished blood supply
to all parts(global ischemia) or
selected areas(regional or focal
ischemia) of the brain
 Focal ischemia- cerebral infarction
 Global ischemia-hypoxic ischemic
encephalopathy(HIE), hypotensive
cerebral infarction
Infarct vs pneumbra
 In the central core of the infarct, the severity
of hypoperfusion results in irreversible
cellular damage
 Around this core, there is a region of
decreased flow in which either:
◦ The critical flow threshold for cell death
has not reached
◦ Or the duration of ischemia has been
insufficient to cause irreversible damage.
 Current therapies attempt to rescue these
‘at risk’ cells
Goal of imaging
 Exclude hemorrhage
 Identify the presence of an underlying
structural lesion such as tumour , vascular
malformation, subdural hematoma that can
mimic stroke
 Identify stenosis or occlusion of major extra-
and intracranial arteries
 Differentiate between irreversibly affected
brain tissue and reversibly impaired tissue
Imaging modalities
 CT
 MRI
 Diffusion weighted imaging
 MRA
 MRS
 CT angiography
 CT perfusion imaging
 Perfusion-weighted MR Imaging
 Trans cranial doppler
 Cerebral angiography
Classification
 Hyper acute infarct (<12 hours)
 Acute infarct (12 to 48 hours)
 Subacute infarct (2 to 14 days)
 Chronic infarct (>2 weeks)
 Old infarct (> 8 to 10 weeks)
CT-Hyperacute infarct
 Normal in 50 – 60%
 Hyperdense MCA sign-acute
intraluminal thrombus
 Obscuration of lentiform nulei
 Dot sign-occluded MCA branch in
sylvian fissure
 Insular ribbon sign –grey white
interface loss along the lateral insula
Hyperdense MCA sign
Axial unenhanced CT
images in a proximal
segment of the left MCA in
a 53-year-old man
obtained 2 hours after the
onset of right hemiparesis
and aphasia, show areas
of hyperattenuation (arrow)
suggestive of intravascular
thrombi.
Obscuration of lentiform
nuclei
Axial unenhanced CT
image obtained in a 53-
year-old man shows
hypoattenuation and
obscuration of the left
lentiform nucleus
(arrows), which,
because of acute
ischemia in the
lenticulostriate
distribution, appears
abnormal in comparison
with the right lentiform
nucleus.
Insular ribbon sign
Axial unenhanced CT
image, obtained in a 73-
year-old woman 21/2
hours after the onset of
left hemiparesis, shows
hypoattenuation and
obscuration of the
posterior part of the right
lentiform nucleus (white
arrow) and a loss of gray
matter–white matter
definition in the lateral
margins of the right
insula (black arrows).
The latter feature is
known as the insular
ribbon sign.
Insular ribbon sign
MRI –Hyperacute infarct
 Absence of normal flow void with intra
vascular arterial enhancement
 Anatomic changes in T1WI
◦ Sulcal effacement,
◦ Gyral edema,
◦ Loss of grey white interface
Sulcal effacement
CT- Acute infarct
 Low density basal ganglia
 Sulcal effacement
 Wedge shaphed parenchymal hypo
density area that involves both grey
and white matter
 Increasing mass effect
 Hemorrhagic transformation may
occur -15 to 45% ( basal ganglia and
cortex common site) in 24 to 48 hours
Sulcal effacement
CT scans show subtle
hypoattenuation and sulcal
effacement in the right
MCA territory (arrows)
MRI –Acute infarct
 T2WI-hyperintensity in affected area
 Meningeal enhancement adjacent to
infarct(12 to 24 hours)
 Early parenchymal enhancement
 Hemorrhagic transformation becomes
evident
MRI –Acute infarct
Axial T2-weighted images
show areas with increased
signal intensity.
MRI –Acute infarct
Acute stroke of the
posterior circulation in a
77-year-old man.
Diffusion-weighted MR
image) shows bilateral
areas of increased
signal intensity (arrows)
in the thalami and
occipital lobes.
CT – sub acute infarct
 NECT
 Wedge-shaped area of decreased attenuation involving gray/white
matter in typical vascular distribution
 Mass effect initially increases, then begins to
diminish by 7-10 days
 HT of initially ischemic infarction occurs in 15-20% of MCA
occlusions, usually by 48-72 hrs
 CECT
 Enhancement patterns typically patchy or gyral
 May appear as early as 2-3 days after ictus, persisting up to 8-10
weeks
 "2-2-2" rule = enhancement begins at 2 days, peaks at 2 weeks,
disappears by 2 months
CT – sub acute infarct
Subacute infarct
involving the right
Parieto-occipital region
MRI –Sub acute infarct
 Intravascular and meningeal enhancement begin to diminish
TIWI- edema becomes prominent and appear hypointense with decreasing mass
effect
T1WI Contrast
 Intra vascular , meningeal enhancement disappear
 Striking parenchymal enhancement (patterns typically patchy or gyral)
 May appear as early as 2-3 days after ictus
 Can persist up to 8-10 weeks
 HT: Signal changes of evolving hemorrhage
T2WI
 Hyperintense edema with decreasing mass effect
 Fogging effect- in 2nd week sometime decrease in T2 hyper intensity due to
reduction in edema and leakage of protein from cell lysis
 Early Wallerian degeneration -well-defined hypointense band in corticospinal tract
 If HT occurs, signal changes of evolving hemorrhage are observed
MRI –Sub acute infarct
The MRI showing an area of
high signal within the left corona
radiata and body of the caudate
nucleus (arrow).
CT & MRI –Sub acute infarct
Subacute infarct appears as a hypodensity on a CT scan (Image A)
obtained within 5-6 hours of onset and as a region of hyperintensity on a
T2-weighted MRI (Image B), on a fluid-attenuated inversion recovery
(FLAIR) MRI (Image C), and on a diffusion-weighted MRI (Image D).
CT-chronic infarct
NECT
 Focal, well-delineated low-attenuation
areas in affected vascular distribution
 Adjacent sulci become prominent;
ipsilateral ventricle enlarges
 Dystrophic Ca++ may occur in
infarcted brain but is very rare
CECT
 No enhancement
CT-chronic infarct
Left PCA
territory
(medial
temporal,
occipital) and
MCA territory
(lateral
temporal)
infarcts caused
by two
separate
ischaemic
episodes both
well in the
past.
MRI- chronic infarct
TlWI
 Isointense to CSF in affected areas
 Adjacent sulci become prominent
 Ipsilateral ventricle enlarges
T2WI
 Isointense to CSF in affected areas
 Borders of infarction may show increased
signal secondary to gliosis
FLAIR
 Hyperintense gliotic white matter at margins
 Low signal in encephalomalacic area
MRI- chronic infarct
Chronic infarcts in a 71-year-
old man with a remote history
of multiple strokes. Diffusion-
weighted MR image shows
areas of decreased signal
intensity in the left frontal
lobe.
MRI- chronic infarct
ADC map shows
increased ADC values in
the white matter of the
right frontal lobe
suggestive of chronic
infarction.
CT and MR Angiogram
 Identifies occlusions, stenosis, status of
Collaterals
Cerebral Angiography
 Angiographic signs of acute infarction:
1. Vessel occlusion 45-50%.
2. Slow antegrade flow with delayed arterial
emptying 15%.
3. Collateral retrograde filling 15-25%.
4. Bare non-perfused areas 5-10%.
5. Vascular blush15-25 %.
6. AV shunting with early appearing draining vain10-
15 %.
7. Mass effect 25-50%
Lacunar infarction
 Small, deep cerebral infarcts typically
located in basalganglia (BG),
thalamus
 Multiple & due to embolic, thrombotic
or atheromatous lesions in long single
penetrating end arterioles
 Most not seen in CT
 Tl WI : Rounded or slit like lesions that
are hypointense to brain
 T2WI : Well delineated hyperintense
areas
Cerebral Arterial Territory
 MCA-most of lateral hemisphere,
anterior and lateral temporal lobe,Basal
ganglia, insula,
 ACA-Inferomedial basal
ganglia,ventromedial frontal lobes,
anterior 2/3rd medial cerebral
hemispheres, 1 cm supero medial brain
convexity
 PCA-Thalami, midbrain, posterior 1/3of
medial hemisphere, occipital lobe,
postero medial temporal lobe
 Anterior Choroidal artery
branch of ICA supply part of the
hippocampus, the posterior limb of the
internal capsule
 Medial lenticulostriate arteries
They supply the anterior inferior parts of the
basal nuclei and the anterior limb of the
internal capsule.
 Lateral lenticulostriate arteries
They supply the superior part of the head and
the body of the caudate nucleus, most of the
globus pallidus and putamen and the
posterior limb of the internal capsule
 AICA- lateroinferior part of pons, middle
cerebellar peduncle, floccular region, anterior
petrosal surface of cerebellar hemisphere
 PICA-inferoposterior surface of cerebellar
hemisphere adjacent to occipital bone,
ipsilateral part of inferior vermis, inferior
portion of deep white matter only
 Superior cerebellar artery-superior aspect
of cerebellar hemisphere (tentorial surface),
ipsilateral superior vermis, largest part of
deep white matter including dentate nucleus,
pons
Water shed infarct
THANK YOU

Cerebral Infarcts . pptx

  • 1.
  • 2.
    Pathophysiology  Significantly diminishedblood supply to all parts(global ischemia) or selected areas(regional or focal ischemia) of the brain  Focal ischemia- cerebral infarction  Global ischemia-hypoxic ischemic encephalopathy(HIE), hypotensive cerebral infarction
  • 3.
    Infarct vs pneumbra In the central core of the infarct, the severity of hypoperfusion results in irreversible cellular damage  Around this core, there is a region of decreased flow in which either: ◦ The critical flow threshold for cell death has not reached ◦ Or the duration of ischemia has been insufficient to cause irreversible damage.  Current therapies attempt to rescue these ‘at risk’ cells
  • 5.
    Goal of imaging Exclude hemorrhage  Identify the presence of an underlying structural lesion such as tumour , vascular malformation, subdural hematoma that can mimic stroke  Identify stenosis or occlusion of major extra- and intracranial arteries  Differentiate between irreversibly affected brain tissue and reversibly impaired tissue
  • 6.
    Imaging modalities  CT MRI  Diffusion weighted imaging  MRA  MRS  CT angiography  CT perfusion imaging  Perfusion-weighted MR Imaging  Trans cranial doppler  Cerebral angiography
  • 7.
    Classification  Hyper acuteinfarct (<12 hours)  Acute infarct (12 to 48 hours)  Subacute infarct (2 to 14 days)  Chronic infarct (>2 weeks)  Old infarct (> 8 to 10 weeks)
  • 8.
    CT-Hyperacute infarct  Normalin 50 – 60%  Hyperdense MCA sign-acute intraluminal thrombus  Obscuration of lentiform nulei  Dot sign-occluded MCA branch in sylvian fissure  Insular ribbon sign –grey white interface loss along the lateral insula
  • 9.
    Hyperdense MCA sign Axialunenhanced CT images in a proximal segment of the left MCA in a 53-year-old man obtained 2 hours after the onset of right hemiparesis and aphasia, show areas of hyperattenuation (arrow) suggestive of intravascular thrombi.
  • 10.
    Obscuration of lentiform nuclei Axialunenhanced CT image obtained in a 53- year-old man shows hypoattenuation and obscuration of the left lentiform nucleus (arrows), which, because of acute ischemia in the lenticulostriate distribution, appears abnormal in comparison with the right lentiform nucleus.
  • 11.
    Insular ribbon sign Axialunenhanced CT image, obtained in a 73- year-old woman 21/2 hours after the onset of left hemiparesis, shows hypoattenuation and obscuration of the posterior part of the right lentiform nucleus (white arrow) and a loss of gray matter–white matter definition in the lateral margins of the right insula (black arrows). The latter feature is known as the insular ribbon sign.
  • 12.
  • 13.
    MRI –Hyperacute infarct Absence of normal flow void with intra vascular arterial enhancement  Anatomic changes in T1WI ◦ Sulcal effacement, ◦ Gyral edema, ◦ Loss of grey white interface
  • 14.
  • 15.
    CT- Acute infarct Low density basal ganglia  Sulcal effacement  Wedge shaphed parenchymal hypo density area that involves both grey and white matter  Increasing mass effect  Hemorrhagic transformation may occur -15 to 45% ( basal ganglia and cortex common site) in 24 to 48 hours
  • 16.
    Sulcal effacement CT scansshow subtle hypoattenuation and sulcal effacement in the right MCA territory (arrows)
  • 17.
    MRI –Acute infarct T2WI-hyperintensity in affected area  Meningeal enhancement adjacent to infarct(12 to 24 hours)  Early parenchymal enhancement  Hemorrhagic transformation becomes evident
  • 18.
    MRI –Acute infarct AxialT2-weighted images show areas with increased signal intensity.
  • 19.
    MRI –Acute infarct Acutestroke of the posterior circulation in a 77-year-old man. Diffusion-weighted MR image) shows bilateral areas of increased signal intensity (arrows) in the thalami and occipital lobes.
  • 20.
    CT – subacute infarct  NECT  Wedge-shaped area of decreased attenuation involving gray/white matter in typical vascular distribution  Mass effect initially increases, then begins to diminish by 7-10 days  HT of initially ischemic infarction occurs in 15-20% of MCA occlusions, usually by 48-72 hrs  CECT  Enhancement patterns typically patchy or gyral  May appear as early as 2-3 days after ictus, persisting up to 8-10 weeks  "2-2-2" rule = enhancement begins at 2 days, peaks at 2 weeks, disappears by 2 months
  • 21.
    CT – subacute infarct Subacute infarct involving the right Parieto-occipital region
  • 22.
    MRI –Sub acuteinfarct  Intravascular and meningeal enhancement begin to diminish TIWI- edema becomes prominent and appear hypointense with decreasing mass effect T1WI Contrast  Intra vascular , meningeal enhancement disappear  Striking parenchymal enhancement (patterns typically patchy or gyral)  May appear as early as 2-3 days after ictus  Can persist up to 8-10 weeks  HT: Signal changes of evolving hemorrhage T2WI  Hyperintense edema with decreasing mass effect  Fogging effect- in 2nd week sometime decrease in T2 hyper intensity due to reduction in edema and leakage of protein from cell lysis  Early Wallerian degeneration -well-defined hypointense band in corticospinal tract  If HT occurs, signal changes of evolving hemorrhage are observed
  • 23.
    MRI –Sub acuteinfarct The MRI showing an area of high signal within the left corona radiata and body of the caudate nucleus (arrow).
  • 24.
    CT & MRI–Sub acute infarct Subacute infarct appears as a hypodensity on a CT scan (Image A) obtained within 5-6 hours of onset and as a region of hyperintensity on a T2-weighted MRI (Image B), on a fluid-attenuated inversion recovery (FLAIR) MRI (Image C), and on a diffusion-weighted MRI (Image D).
  • 25.
    CT-chronic infarct NECT  Focal,well-delineated low-attenuation areas in affected vascular distribution  Adjacent sulci become prominent; ipsilateral ventricle enlarges  Dystrophic Ca++ may occur in infarcted brain but is very rare CECT  No enhancement
  • 26.
    CT-chronic infarct Left PCA territory (medial temporal, occipital)and MCA territory (lateral temporal) infarcts caused by two separate ischaemic episodes both well in the past.
  • 27.
    MRI- chronic infarct TlWI Isointense to CSF in affected areas  Adjacent sulci become prominent  Ipsilateral ventricle enlarges T2WI  Isointense to CSF in affected areas  Borders of infarction may show increased signal secondary to gliosis FLAIR  Hyperintense gliotic white matter at margins  Low signal in encephalomalacic area
  • 28.
    MRI- chronic infarct Chronicinfarcts in a 71-year- old man with a remote history of multiple strokes. Diffusion- weighted MR image shows areas of decreased signal intensity in the left frontal lobe.
  • 29.
    MRI- chronic infarct ADCmap shows increased ADC values in the white matter of the right frontal lobe suggestive of chronic infarction.
  • 30.
    CT and MRAngiogram  Identifies occlusions, stenosis, status of Collaterals
  • 31.
    Cerebral Angiography  Angiographicsigns of acute infarction: 1. Vessel occlusion 45-50%. 2. Slow antegrade flow with delayed arterial emptying 15%. 3. Collateral retrograde filling 15-25%. 4. Bare non-perfused areas 5-10%. 5. Vascular blush15-25 %. 6. AV shunting with early appearing draining vain10- 15 %. 7. Mass effect 25-50%
  • 32.
    Lacunar infarction  Small,deep cerebral infarcts typically located in basalganglia (BG), thalamus  Multiple & due to embolic, thrombotic or atheromatous lesions in long single penetrating end arterioles  Most not seen in CT  Tl WI : Rounded or slit like lesions that are hypointense to brain  T2WI : Well delineated hyperintense areas
  • 33.
    Cerebral Arterial Territory MCA-most of lateral hemisphere, anterior and lateral temporal lobe,Basal ganglia, insula,  ACA-Inferomedial basal ganglia,ventromedial frontal lobes, anterior 2/3rd medial cerebral hemispheres, 1 cm supero medial brain convexity  PCA-Thalami, midbrain, posterior 1/3of medial hemisphere, occipital lobe, postero medial temporal lobe
  • 35.
     Anterior Choroidalartery branch of ICA supply part of the hippocampus, the posterior limb of the internal capsule  Medial lenticulostriate arteries They supply the anterior inferior parts of the basal nuclei and the anterior limb of the internal capsule.  Lateral lenticulostriate arteries They supply the superior part of the head and the body of the caudate nucleus, most of the globus pallidus and putamen and the posterior limb of the internal capsule
  • 37.
     AICA- lateroinferiorpart of pons, middle cerebellar peduncle, floccular region, anterior petrosal surface of cerebellar hemisphere  PICA-inferoposterior surface of cerebellar hemisphere adjacent to occipital bone, ipsilateral part of inferior vermis, inferior portion of deep white matter only  Superior cerebellar artery-superior aspect of cerebellar hemisphere (tentorial surface), ipsilateral superior vermis, largest part of deep white matter including dentate nucleus, pons
  • 39.
  • 41.