STROKE IMAGING
Presented by: Dr.Anish Dhakal
Resident
MD Radiodiagnosis, KUSMS
1st
July, 2025
STROKE
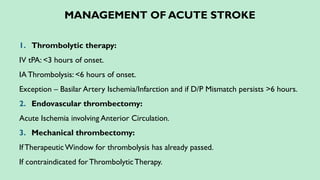
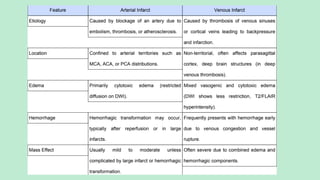
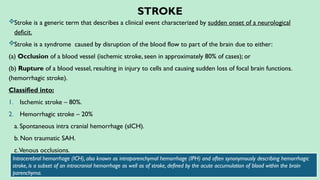
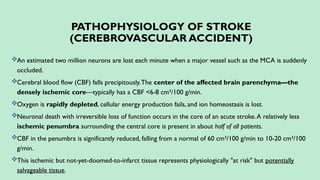
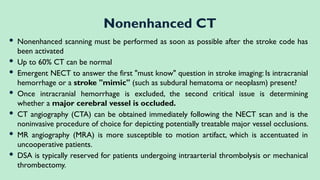
Stroke is a generic term that describes a clinical event characterized by sudden onset of a neurological
deficit.
Stroke is a syndrome caused by disruption of the blood flow to part of the brain due to either:
(a) Occlusion of a blood vessel (ischemic stroke, seen in approximately 80% of cases); or
(b) Rupture of a blood vessel, resulting in injury to cells and causing sudden loss of focal brain functions.
(hemorrhagic stroke).
Classified into:
1. Ischemic stroke – 80%.
2. Hemorrhagic stroke – 20%
a. Spontaneous intra cranial hemorrhage (sICH).
b. Non traumatic SAH.
c.Venous occlusions.
Intracerebral hemorrhage (ICH), also known as intraparenchymal hemorrhage (IPH) and often synonymously describing hemorrhagic
stroke, is a subset of an intracranial hemorrhage as well as of stroke, defined by the acute accumulation of blood within the brain
parenchyma.
ISCHEMIAVS INFARCT
Temporal classification:
1. TIA = Transient ischemic attack
• lasts 5 to 30 minutes + clears within 24 hours
2. RIND = Reversible ischemic neurologic deficit
= fully reversible prolonged ischemic event resulting in minor neurologic dysfunction
• > 24 hours and < 8 weeks with eventual total recovery
Incidence: 16÷100,000 population / year
3. Progressing stroke / intermittent progressive stroke
= stepwise / gradually progressing accumulative neurologic deficit evolving over hours /days
4. Slow stroke
= Rare clinical syndrome presenting as developing neuronal fatigue with
weakness in lower / proximal upper extremity after exercise; occurs in
patients with occluded ICA
5. Completed stroke
= Severe + persistent stable neurologic deficit = cerebral infarction (death
of neuronal tissue) as end stage of prolonged ischemia >21 days
• Level of consciousness correlates well with size of infarct
Third global leading cause of death (after heart disease and cancer);
Risk Factors:
a. Advancing age. b. Hypertension. c. Diabetes.
d. Stress. e. Obesity. f. Hyperlipidemia.
g. Genome Wise Association Studies (GWAS).
PATHOPHYSIOLOGY OF STROKE
(CEREBROVASCULAR ACCIDENT)
An estimated two million neurons are lost each minute when a major vessel such as the MCA is suddenly
occluded.
Cerebral blood flow (CBF) falls precipitously.The center of the affected brain parenchyma—the
densely ischemic core—typically has a CBF <6-8 cm³/100 g/min.
Oxygen is rapidly depleted, cellular energy production fails, and ion homeostasis is lost.
Neuronal death with irreversible loss of function occurs in the core of an acute stroke.A relatively less
ischemic penumbra surrounding the central core is present in about half of all patients.
CBF in the penumbra is significantly reduced, falling from a normal of 60 cm³/100 g/min to 10-20 cm³/100
g/min.
This ischemic but not-yet-doomed-to-infarct tissue represents physiologically "at risk" but potentially
salvageable tissue.
Pathogenesis:
cerebral blood flow(<15-18ml /100gm/min.)
O2 & glucose
ATP
Na –K ATPase
Na influx into cell
Cellular edema(cerebral edema)
Effect of Cerebral edema:
Gyral swelling, sulcal effacement.
Herniation of brain, compression of ventricles.
Increased ICT.
Neurological deficit
Imaging changes:
Hypodensity of overall brain tissue
Loss of grey-white differentiation( obscuration of basal ganglia, insular ribbon sign).
Increased T1 & T2 relaxation time.
Stroke is a clinical diagnosis. Imaging helps to compliment the diagnosis as well as exclude the stroke mimics. Clinical diagnosis
of acute "stroke" is inaccurate in 15-20% of cases.
ARTERIAL ISCHEMIA
Account for majority (80%) of all strokes.
Classified based upon duration or Evolution as:
1. Hyperacute (Onset – 6 hours).
2. Acute (Onset – 48 hours).
2. Subacute (48hours – 2 weeks).
3. Chronic (After 2 weeks).
Causes include:
4. Atherosclerotic vascular disease (ASVD – 45%).
5. SmallVessel disease (15-30%).
6. Cardioembolic disease (15-25%).
7. Others (cryptogenic).
ARTERIAL ISCHEMIA
Cerebral Blood Flow:
Normal – 60cm3
/100 gm/min.
Ischemic Core – 6-8 cm3
/100gm/min.
Penumbra – 10-20 cm3
/100gm/min.
About 2 million neurons die every minute after an ischemic event is vessel like MCA.
Hierarchy of Susceptibility: Hierarchy in Site: Hierarchy inVessel:
1. Neurons 1. Hippocampus. 1. MCA.
2. Astrocytes. 2. Neocortex (III,V andVI). 2. PCA
3. Oligodendrocytes. 3. Neostriatum. 3. Vertebrobasilar.
4. Microglial Cells. 4. ACA.
5. Ependymal Cells.
ACUTE ISCHEMIA/INFARCTS
The four must know Questions:
1. Is there ICH (or a stroke mimic)? – NECT.
2. Is a large vessel occluded? – CTA.
3. Is a part of brain irreversible injured? – pCT.
4. Is an ischemic penumbra present? – pCT.
CT the mainstream of Radiological Investigation. Helps:
5. To differentiate bland/ischemic stroke from ICH.
6. To select/triage patients for possible reperfusion therapies.
STROKE PROTOCOL/CT STROKE
PROTOCOL/CODE STROKE CT
The purpose of this protocol is three-fold:
I. To assess the brain for established infarcts or alternative diagnoses
II. To identify the location and physiological effects of arterial blockage
III. To assess vascular anatomy that may impact endovascular access
To achieve this, stroke protocol CT usually includes 3 concatenated scans :
I. Non-contrast CT (brain)
II. CT perfusion (brain)
III. CT angiography (aortic arch to the vertex of the skull)
 Nonenhanced scanning must be performed as soon as possible after the stroke code has
been activated
 Up to 60% CT can be normal
 Emergent NECT to answer the first "must know" question in stroke imaging: Is intracranial
hemorrhage or a stroke "mimic" (such as subdural hematoma or neoplasm) present?
 Once intracranial hemorrhage is excluded, the second critical issue is determining
whether a major cerebral vessel is occluded.
 CT angiography (CTA) can be obtained immediately following the NECT scan and is the
noninvasive procedure of choice for depicting potentially treatable major vessel occlusions.
 MR angiography (MRA) is more susceptible to motion artifact, which is accentuated in
uncooperative patients.
 DSA is typically reserved for patients undergoing intraarterial thrombolysis or mechanical
thrombectomy.
Nonenhanced CT
STROKEWINDOW
The use of narrow window width (and
therefore high-contrast) CT review
settings i.e. “stroke windows” 40
Window width (WW) and 40 Window
level (WL) as an integral part of the
general evaluation of CT brain
examination helps to increase detection of
subtle, potentially significant lesions.
Effect of window setting:
 Axial unenhanced CT images,
obtained in a 45-year-old man 2
hours after the onset of left
hemiparesis, show obscuration of the right
lentiform nucleus (arrow in b).
 This feature is less visible with the
routine brain imaging window used for a
(window width, 80 HU; center, 35
HU) than width the narrower window
used for b (window width, 10 HU;
center, 28 HU).
ACUTE INFARCTS
Earliest Signs in NECT for Hyperacute Ischemia/Infarcts:
1. DenseVessel Sign:
a. Hyperdense MCA Sign (M1) – Earliest of all (in about 30%). Most specific but
least sensitive. MCA Dot Sign – MCA in the Sylvian Fissure (M2/M3).
b. Other sites are: ICA, BA etc.
Calcified Embolus may be present. Carries 50% risk of re-attack.
2. Blurring and Indistinct GW matter Interface:
a. Insular Ribbon Sign.
b. Disappearing BG Sign.
Seen in about (50-70%) cases in the first 3 hours at the least.
• A "dense MCA" sign is seen in 30% of
cases with documented M1 occlusion (8-
30). Less common sites for a hyperdense
vessel sign are the intracranial internal
carotid artery, basilar artery, and MCA
branches in the sylvian fissure ("dot"
sign).
• False positive hyperdense MCA sign is
due to high hematocrit or calcified
atherosclerotic disease (but is usually
bilateral in these cases) and hypodense
brain parenchyma (e.g. diffuse cerebral
edema).
Uncommon but important NECT findings that
indicate vascular occlusion include a calcified
embolus, most likely from an "at-risk" ulcerated
atherosclerotic plaque in the cervical or cavernous
ICA.
Wedge-shaped parenchymal hypodensity with
indistinct GM-WM borders and cortical sulcal
effacement develops in large territorial occlusions.
If more than one-third of the MCA territory is
initially involved, the likelihood of a "malignant“
MCA infarct with severe brain swelling rises, as
does the risk of hemorrhagic transformation with
attempted revascularization.
Obscuration of the lentiform nucleus so-called
disappearing basal ganglia sign
MCA dot sign
Insular ribbon sign: Hypodensity
and swelling of the insular cortex
ACUTE INFARCTS – QUANTIFICATION
The Alberta Stroke Program Early CT Score (ASPECTS) was proposed in 2001 as a
means of quantitatively assessing acute ischemia on CT images by using a 10-point
topographic scoring
Typical Features in NECT after the Evolution of Infarct:
Wedge shaped parenchymal hypodensity with indistinct GM-WM borders and cortical sulcal
effacement especially in large territorial occlusion.
If >1/3rd
of MCA territory is involved, increased risk of malignant Edema and Hemorrrhagic
Transformation.
ASPECTS:ALBERTA STROKE PROGRAM EARLY CT SCORE
10 scoring is given for various territories and subtracted from 10.
MCA Cortex + Insular Ribbon = 7 points.
Subcortical Structures = 3 points.
Score < or = 7 ---- Increased Risk of HT and poor Outcome.
ASPECTS SCORE
Unenhanced CT
images in a 56-year-old man
with right hemiparesis (a at a
lower level than b)
demonstrate involvement of
the M1region, insular cortex
(I), and lentiform nucleus (L).
Thus,three points are
subtracted from the 10-point
ASPECTS,and the final score is
seven points.
C caudate nucleus,
IC internal capsule.
CECT BRAIN
CECT may show enhancing vessel if slow anterograde flow
or retrograde filling via collaterals is present.
CT ANGIOGRAPHY
Localizes and defines the extent of the intravascular thrombus.
Assess collateral blood flow.
Characterizes the atherosclerotic disease.
Guidance for the interventional neuroradiologist prior to intraarterial
thrombolysis if available.
In intra-arterial thrombolysis higher chances of recanalization is seen in the
occlusion of ICA, MCA stem and basilar artery [differentiating them from
more distal (M2 or M3) occlusions for intravenous, intraarterial, or mixed
(intravenous-intraarterial) treatment planning]
CTA
PERFUSION CT
pCT depicts the effect of vessel occlusion on the brain parenchyma itself,
offering a time-sensitive and practical assessment of cerebral
hemodynamics and parenchymal viability that is key to acute stroke
management
Perfusion CT is obtained by monitoring the first pass of an iodinated
contrast bolus through the cerebral circulation.
As contrast passes through the brain, it causes transient hyperattenuation
that is directly proportional to the amount of contrast in the vessels and blood in
the brain.
pCT
As contrast passes through the brain, it causes transient hyperatteunation that is directly proportional to
the amount of contrast in the vessels and blood in the brain.
Parameters of pCT:
1. CBV (Cerebral BloodVolume): Volume of blood flowing in given volume of brain.
2. CBF (Cerebral Blood Flow): Volume of blood flowing through the given volume of brain in a time.
3. MTT (MeanTransitTime): Average time it takes the blood to transit through a given volume of
brain. MTT=CBV/CBF.
4. TTP (Time to Peak): Opposite of CBF. Time from the beginning of contrast material injection to the
maximum concentration of contrast material within a region of interest. Slow flow means more time to
reach the peak.
Red/Yellow/Green – Increased perfusion.
Blue/Purple/Black – Decreased perfusion.
pCT
pCT inVarious Areas of Brain: MTT:
Grey Matter (BG and Cortex) – Red/Yellow. Slow – Red.
White Matter – Blue. Normal – Blue.
Ischemia – Blue/Purple and Infarct/CSF – Black.
Infarct Core (Irreversibly Damaged Brain):
a. Matched Perfusion (CBV and CBF – both decrease).
b. Increased MTT.
Ischemic Penumbra:
c. Perfusion Mismatch (Normal CBV, decreased CBF).
Penumbra = CBV – CBF.
Prolonged MTT (145%) beyond infarct core i.e. CBV/MTT mismatch = Penumbra.
FLAIR – DWI Mismatch = Penumbra.
DECODINGTHE COLOR CODES
Knowing color scale is key.
• For CBF, higher scale (red) means faster flow (good), and
lower scale (blue) means less flow (bad).
• For CBV, higher scale (red) means more volume (good),
and lower scale less volume (bad)
• For TTP, higher scale (red) means longer TTP (bad), and lower scale (blue)
means shorter TTP (good).
An ischemic penumbra with potentially salvageable tissue is seen as a
"mismatch" between markedly reduced CBV in the infarcted core and a
surrounding area (penumbra) characterized by decreased CBF with normal
or even transiently increased CBV (due to autoregulatory vasodilatation).
 Thus the potentially salvageable brain tissue is equivalent to CBV
minus CBF (hypoperfused tissue but viable).
Prolonged MTT over 145% that extends beyond the core infarct area
(so-called CBV/MTT mismatch) also characterizes the ischemic
penumbra.
Individuals in whom the area of infarction matches the area of
abnormal perfusion should not be treated regardless of other
factors (time from onset of symptoms, extent of infarcted brain)
because there is no brain tissue to protect.
On the other hand, in patients where volume of brain at risk is
greater than the already infarcted brain by more than 20%, treatment
may result in improved outcome.
More recent data indicate that the extent of collateralization of distal
branches beyond the occlusion has a major impact on outcome as
well (the better the collaterals, the better the prognosis), and must
also be taken into consideration when triaging patients for
recanalization.
Perfusion imaging shows the area of reduced blood flow, while diffusion-weighted imaging (DWI) shows the area
of restricted water movement (which can indicate cell damage). A PDM exists when the perfusion deficit is larger
than the DWI lesion, indicating the presence of potentially salvageable tissue.
 The clinical application of CT perfusion imaging in acute stroke is based on
the hypothesis that the penumbra shows
Either:
(a) Increased mean transit time with moderately decreased cerebral blood flow
(60%) and normal or increased cerebral blood volume (80%–100% or
higher) secondary to autoregulatory mechanisms; or
(b) Increased mean transit time with markedly reduced cerebral blood flow
(30%) and moderately reduced cerebral blood volume (60%), whereas
infarcted tissue shows severely decreased cerebral blood flow (30%) and
cerebral blood volume (40%) with increased mean transit time.
 The penumbra will benefit from the therapy.The infarcted brain will not.
 CT perfusion maps
of cerebral blood volume
(a) and cerebral blood flow (b)
show, in the left hemisphere,
a region of decreased blood
volume (white oval) that corresponds
to the ischemic core
and a larger region of decreased
blood flow (black oval
in b) that includes the ischemic
core and a peripheral
region of salvageable tissue.
The difference between the
two maps (black oval white
oval) is the penumbra.
Ischemic core Region of dec. blood
Penumbra
Well perfused area
pCT
pCT
pCT
 Conventional spin-echo MR imaging is more sensitive and more specific than
CT for the detection of acute cerebral ischemia within the first few hours
after the onset of stroke.
 It has the additional benefit of depicting the pathologic entity (stroke and its
mimics) in multiple planes.
 The MR sequences typically used in the evaluation of acute stroke include T1-
weighted spin-echo,T2- weighted fast spin-echo, fluid-attenuated inversion
recovery,T2*-weighted gradient-echo, and gadolinium-enhanced T1-weighted
spin-echo sequences.
 Conventional MR imaging is less sensitive than diffusion-weighted MR
imaging in the first few hours after a stroke (hyperacute phase) and may result
in false-negative findings.
Conventional MR Imaging
 The principle of diffusion imaging is based on the integration of two diffusion-
sensitive gradient pulses in a standard pulse sequence.
 When the first gradient pulse is switched on, the different precession frequencies
of the spin phases at different positions in the gradient field will lead to spin
dephasing.
 A second ‘opposite’ gradient pulse refocuses the different spin phases.
 However, due to the additional molecular movement of the protons within a
voxel, the phase cannot be completely refocused, resulting in a reduction in the
MR signal
 The actual diffusion coefficient cannot be measured by using diffusion-
weighted MR imaging, for a number of reasons (including the inability of diffusion-
weighted imaging to depict the difference between molecular motion due to
concentration gradients and molecular motion due to thermal or pressure gradients or
ionic interactions)
 Hence, the diffusion coefficient obtained from orthogonal diffusion-weighted MR
images in all three planes is called the apparent diffusion coefficient (ADC).
 In humans, diffusion restriction with
reduced ADC has been observed as early
as 30 minutes after the onset of
ischemia.
 The ADC continues to decrease further
and reaches a nadir at approximately 3–5
days.
 Thereafter, the ADC starts to increase
again, and it returns to the baseline value at
approximately 1–4 weeks.
 This is likely due to the development of
vasogenic edema along with the
persistence of cytotoxic edema.
 In a few weeks to months, gliosis develops,
with a resultant increase in the quantity of
extracellular water
 This same pattern of change can be observed in the
diffusion-weighted MR imaging appearance of
ischemic human brain tissue during the evolution of
acute stroke.
 Hyperintense signal is seen with reduced ADC
values from approximately 30 minutes to 5 days after
the onset of symptoms ;
 Mildly hyperintense signal is seen with pseudonormal
ADC values at 1–4 weeks; and variable signal intensity
(because ofT2 characteristics) is seen with increased ADC
values several weeks to months after symptom onset
 The signal intensity in areas affected by acute stroke
on diffusion-weighted images, thus, increases during
the 1st week after symptom onset and decreases
thereafter; however, the signal may remain
hyperintense for a longer period.
 Increased intensity of the diffusion-weighted imaging
signal in the initial few days is due to restricted
diffusion and thereafter is due to an increase of the
T2 signal (T2 shine-through) from the infarcted
tissue.
MRI FINDINGS
Highly specific predictor for malignant MCA infarct is threshold core volume of more then 82 cc.
While diffusion-weighted MR imaging is most useful for detecting
irreversibly infarcted tissue,perfusion-weighted imaging may be used
to identify areas of reversible ischemia as well typically
susceptibility based and depend on T2* effects, but they may beT1
weighted instead.
Dynamic susceptibility-weighted (T2*-weighted) sequences probably
are most commonly used in acute stroke evaluation, while the other
MR perfusion imaging techniques are more commonly used in tumor
evaluation or other applications
Perfusion-weighted MR Imaging
 The passage of an intravascular MR
contrast agent through the brain capillaries
causes a transient loss of signal because
of the T2* effects of the contrast agent.
 The dynamic contrast-enhanced MR
perfusion imaging technique involves
tracking of the tissue signal changes caused
by susceptibility (T2*) effects to create a
hemodynamic time–signal intensity curve.
 As in dynamic CT perfusion imaging,
perfusion maps of cerebral blood volume
and mean transit time can be calculated
from this curve by using a deconvolution
technique
Underlying Principles
 The lesion appears smaller on the diffusion weighted images than on the
perfusion-weighted images.This is typically observed in large-vessel
strokes .
 In the acute stroke setting, a region that shows both diffusion and
perfusion abnormalities is thought to represent irreversibly infarcted
tissue. Same size on diffusion weighted images and perfusion-weighted
images (no penumbra).
 While a region that shows only perfusion abnormalities and has
normal diffusion likely represents viable ischemic tissue, or a penumbra
Comparison of Diffusion and Perfusion
Abnormalities
MRI FEATURES OF
ACUTE ISCHEMIA/
INFARCTION
DSA IN ACUTE ISCHEMIA/INFARCTION
Used if planned for:
1. Intra-arterial thrombolyis.
2. Mechanical thrombectomy
Done if:
3. Patient arrives beyond
therapeutic window.
4. CI to Thrombolytic Therapy.
DSA IN ACUTE ISCHEMIA/INFARCTION
MANAGEMENT OF ACUTE STROKE
1. Thrombolytic therapy:
IV tPA: <3 hours of onset.
IAThrombolysis: <6 hours of onset.
Exception – Basilar Artery Ischemia/Infarction and if D/P Mismatch persists >6 hours.
2. Endovascular thrombectomy:
Acute Ischemia involving Anterior Circulation.
3. Mechanical thrombectomy:
If TherapeuticWindow for thrombolysis has already passed.
If contraindicated forThrombolyticTherapy.
Time clock vs.Tissue clock
THROMBOLYTICTHERAPY (IVTHROMBOLYTICS)
© 2025 UpToDate, Inc.
THROMBOLYSIS UPDATED GUIDELINES
Intravenous fibrinolytic therapy at the cerebral circulation dose within the first 3 hours of ischemic stroke
onset offers substantial net benefits for virtually all patients with potentially disabling deficits.
Intravenous fibrinolytic therapy at the cerebral circulation dose within 3-4.5 hours offers moderate net
benefits when applied to all patients with potentially disabling deficits.
MRI of the extent of the infarct core (already irreversibly injured tissue) and the penumbra (tissue at risk but still
salvageable) can likely increase the therapeutic yield of lytic therapy, especially in the 3- to 9-hour window.
Intra-arterial fibrinolytic therapy in the 3- to 6-hour window offers moderate net benefits when applied to
all patients with potentially disabling deficits and large artery cerebral thrombotic occlusions.
Classic thrombolysis drugs, also known as clot-busting drugs, include alteplase, reteplase, streptokinase, and
urokinase.
Newer thrombolytic drugs, like tenecteplase, are emerging as potential replacements for alteplase in treating
acute ischemic stroke, offering benefits like ease of administration and potentially improved efficacy
© 2025 UpToDate, Inc.
The recommended dose is 0.9 mg/kg (maximum 90 mg total dose), 10% of the total dose is administered as an initial IV
bolus over one minute, and the remaining dose is infused over 60 minutes. Much lower total dose (10-30 mg) in
intraarterial therapy.
SUBACUTE INFARCT
 Strokes that are between 48 hrs to 2 wks duration.
 Characterized by marked edema and hemorrhagic transformation.
Increased mass effect (maximum in 3-4 days).
Frank tissue necrosis with progressive influx of microglia and macrophages around vessels ensues with
reactive astrocytosis around the perimeter of the stroke. Brain softening and then cavitation proceeds
over the next 2 weeks.
HemorrhagicTransformation (about 20-25% cases) – Between 2 days to 1week.
Presence of Fogging Phenomenon.
 NCCT findings:
 More sharply defined wedge shaped decreased attenuation. Mass effect initially increase and begins to
decrease by 7- 10 days.
 Cases with hemorrhagic transformation shows gyriform cortical and basal ganglia hyperdensity.
 CECT shows: Patchy gyriform enhancement appearing as early as two days with peak at two weeks and
disappearing by two month (Rule of 2 in subacute Infarcts)
MR findings (depends on time since
ictus and hemorrhagic transformation):
1.T1WI: Non hemorrhagic infarct shows
hypointensity with moderate mass effect and
sulcal effacement. However, the hemorrhagic
transformation shows the iso signal intensity
with cortex initially followed by
hyperintensity.
2.T2WI: Initially hyperintense, with time the
signal intensity decreases reaching iso at the
one to two weeks known as “T2 fogging
effect”.
These infarcts shows hyperintesity on FLAIR images. Final infarct volume
corresponds to FLAIR defined abnormality after one week.
T2* gradient echo images show the hemorrhagic transformation as petechial
or gyriform blooming foci. However in basal ganglia it can be petechial or
confluent.
DWI shows hyperintensity with hypointensity on ADC map for first
several days,which then gradually reverse subsequently.
T1 contrast images shows intravascular enhancement in first 48 hrs which is
replaced by leptomemingeal enhacement caused by persisting pial collateral
blood flow after three to four days. Patchy and gyriform enhancement occurs
as early as two to three days and may persist for two to three months.
SUBACUTE INFARCTS
HEMORRHAGICTRANSFORMATION
Can be either Petechial and rarely Lobar.
Occur in about (20-25%) cases of Ischemic Strokes.
Occurs between (2-7 days).
Can be spontaneous or After IV tPA therapy.
Predictors after tPA are:
1. Severe strokes.
2. Proximal MCA occlusion.
3. >1/3rd
territory of MCA affected.
4.Absence collateral or delayed recanalization.
5. Gray matter infarction
European Cooperative Acute Stroke Study classification:
Figure . Drawings (top) illustrate the territories
(blue) of the ACA, middle cerebral artery (MCA) , and
posterior cerebral artery. CT scans (bottom) show es-
tablished infarctions of these arteries
 European Cooperative Acute Stroke Study trial: Involvement of more than one-third of the MCA
territory depicted at unenhanced CT was a criterion for the exclusion of patients from
thrombolytic therapy because of a potential increase in the risk for hemorrhage
FOGGING PHENOMENON
Transient return of the infarcted cortex to a near normal appearance in the
evolution of stroke is called the Fogging Phenomenon.
Occurs in about 50% cases between (2-3 weeks).
Causes:
1. Lipid laden macrophages migration.
2. Proliferation of capillaries.
3. Reduced edema and
4. Cortical laminar necrosis.
CECT will show vivid ribbon like cortical enhancement.
FOGGING PHENOMENON
CHRONIC INFARCTS
Also called post infarction encephalomalacia.
NECT:
Sharply well-delineated wedge shaped hypodense area
that involves both GWM and is confined to a specific vascular
territory.
Features of volume loss are evident.
Depression in function, metabolism, and perfusion affecting a
cerebellar hemisphere occurring as a result of a contralateral focal
supratentorial infarct (cerebellar diachisis)
MRI:
Cystic encephalomalacia with CSF equivalent signal intensity
on all sequences.
DWI shows increased diffusivity and hyperintense on ADC.
IMAGING DIFFERENCES:
ARTERIALVS.VENOUS INFARCTS
MULTIPLE EMBOLIC INFARCTS
Brain emboli are less common but important causes of stroke. Most
consist of clots containing fibrin, platelets, and RBCs.
Less common emboli include air, fat, calcium, tumor, and foreign
bodies (e.g.,debris from metallic heart valves).
MULTIPLE EMBOLIC INFARCTS
The differentials of multiple embolic infarcts are:
1. Cardio-embolic infarcts.
2. Fat embolism.
3. Gas embolism.
CARDIAC AND ATHEROMATOUS EMBOLI
Hallmark: Small acute infarct in
multiple different vascular
distributions.
Peripheral signs: Splinter hemorrhage
Echo:Valvular vegetations, intra cardiac
filling defects
Tend to involve terminal cortical branches
CT SCAN
In contrast to large artery territorial strokes, embolic
infarcts tend to involve terminal cortical branches. The
GM-WM interface is most commonly affected.
NECT: Low-attenuation foci, often in a wedge-shaped
distribution.
Atherosclerotic emboli occasionally demonstrate
calcification. Septic emboli are often hemorrhagic.
CECT scans: May demonstrate multiple punctate or
ring-enhancing lesions.
MRI
MRI: Multifocal peripheralT2/FLAIR hyperintensities. Hemorrhagic emboli
cause "blooming" onT2* sequences (most sensitive sequence: DWI).
Typical finding in multiple emboli infarcts: Small peripheral foci of
diffusion restriction in several different vascular distributions.
T1 C+ imaging may show multiple punctate enhancing foci.
Septic emboli often demonstrate ring enhancement, resembling
microabscesses.
The differentials are:
1. Hypotensive cerebral infarction
Has hemodynamic compromise and tend to involve deep internal
watershed zones.
2. Parenchymal metastasis: Have predilection for GM WM interface but do
not restrict on DWI.
FAT EMBOLI
Hypoxia/neurological symptoms with petechial rash
in setting of severely displaced lower extremity
long bone fractures (most commonly femoral
neck fractures)
The term "cerebral fat emboli" (CFE) refers
to the neurologic manifestations of FES.
Etiology:
Small vessel occlusion from
fat particles
Inflammatory changes in
surrounding tissue initiated
by breakdown of fat into free
fatty acids and other
metabolic byproducts.
CEREBRAL FAT EMBOLI (FES)
Hallmarks is:
Arteriolar fat emboli with perivascular
microhemorrhages.
Imaging findings reflect the effects of the fat
emboli (i.e., multifocal tiny strokes and
microhemorrhages) on brain tissue, not the
fat itself.
NECT scan: Generally normal
MRI: MR shows numerous (average = 50) punctate or confluent
hyperintensities in the cerebellum, basal ganglia, periventricularWM, and GM-
WM junctions on T2/FLAIR.
DWI shows innumerable tiny punctate foci of diffusion restriction in multiple
vascular distributions, the "star field“ pattern.
The deep watershed border zones are commonly involved.
Solitary or multiple small hypointense "blooming" foci can be identified in up
to one-third of all FES cases onT2* GRE. SWI discloses innumerable (>200)
tiny "black dots" in the majority of patients.
The differentials are:
Cardiac Emboli: Multiple cardiac or atheromatous embolic infarcts
rarely produce the dozens or even hundreds of lesions seen with CFE.
Lesions tend to involve the basal ganglia and corticomedullary junctions
more than the white matter.
DAI/DVI: Tend to have linear as well as punctate microbleeds. Multifocal
"blooming" hypointensities onT2* can be seen with severe diffuse axonal
injury (DAI) or diffuse vascular injury (DVI).
CEREBRAL GAS EMBOLISM
Causes include:
1. IV catheter
2. CV line
3. Lung biopsy
4. Craniotomy
5. Decompression sickness
6. Hydrogen peroxide ingestion
IMAGING FEATURES OF CEREBRAL GAS
EMBOLISM
Asymptomatic air following intravenous catheter placement is most
commonly observed as an incidental finding, typically as dots of air in the
cavernous sinus.
Intracranial air bubbles can be identified in 70% of symptomatic CGE cases,
appearing on NECT as transient small intravascular rounded or curvilinear
hypodensities, typically located at the depths of sulci.
Intraparenchymal air is less common.
Air is quickly absorbed and can rapidly disappear. If massive air embolism
occurs, cerebral ischemia or diffuse brain swelling typically ensues.
CEREBRAL GAS EMBOLISM
LACUNAR INFARCTS
LACUNAR INFARCTS
Also termed as Subclinical Strokes or Silent Strokes.
Lacuna – (3-15 mm) CSF filled cavities in the BG
and deep white matter which are pale, small,
irregular but well-delineated.
25% of Ischemic strokes are lacunar.
Lacunae are sometimes called "silent" strokes, a
misnomer as subtle neuropsychologic impairment is
common in these patients.
Between 20-30% of patients with lacunar stroke
experience neurological deterioration hours or even
days after the initial event.
Lacunae are considered macroscopic markers of cerebral small vessel
("microvascular") disease.
There are two major vascular pathologies involving small penetrating arteries
and arterioles:
(1)Thickening of the arterial media by lipohyalinosis, fibrinoid necrosis,
and atherosclerosis causing luminal narrowing and
(2)Obstruction of penetrating arteries at their origin by large intimal plaques
in the parent arteries.
The MTHFR C677T genotype is correlated with lacunar stroke.
Penetrating branches that arise from the
circle of Willis and peripheral cortical
arteries are small end-arteries with few
collaterals, so lacunar infarcts are most
common in the basal ganglia (putamen, globus
pallidus, caudate nucleus), thalami, internal
capsule, deep cerebral white matter, and pons.
Lacunae are, by definition, 15 mm or less
in diameter.
Multiple lesions are common. Between
13-15% of patients have multiple
simultaneous acute lacunar infarcts.
ACUTE LACUNAR INFARCTS
NECT scans: Mostly invisible
Acute lacunar infarcts are hyperintense onT2/FLAIR and may be
difficult to distinguish from foci of coexisting chronic microvascular disease.
 Acute and early subacute lacunae restrict on DWI and also usually
enhance onT1 C+.
DWI overestimates the eventual size of lacunar infarcts. Cavitation and
lesion shrinkage are seen in more than 95% of deep symptomatic lacunar
infarcts on follow-up imaging.
CHRONIC LACUNAR INFARCTS
Old lacunae appear as well-defined but often somewhat irregular CSF-
like "holes" in the brain parenchyma on NECT scans.
Chronic lacunar infarcts are hypointense onT1WI and
hyperintense onT2WI.
The fluid in the cavity suppresses on FLAIR, whereas the gliotic periphery
remains hyperintense. Multifocal white matter disease, seen as WMHs, is
also common in patients with frank lacunar infarcts.
Most lacunae are nonhemorrhagic and do not "bloom" on T2* sequences.
However, parenchymal microbleeds—multifocal "blooming black dots"
on T2* (GRE, SWI)—are common comorbidities in patients with
lacunar infarcts and chronic hypertension.
DIFFERENTIAL DIAGNOSIS
Major D/D: Prominent perivascular spaces (PVSs) aka
Virchow-Robin spaces, prominent PVSs are pialined, interstitial
fluid-filled spaces (increase in size and frequency with age).
The most common locations for PVSs are the inferior third of the
basal ganglia (clustered around the anterior commissure), subcortical
white matter (including the external capsule), and the midbrain
PVSs are sharply marginated and ovoid, linear, or round.
Lacunae tend to be more irregularly shaped.
PVSs faithfully follow CSF signal intensity on all MR sequences and
suppress completely on FLAIR.
The adjacent brain is typically normal although a thin rim of
FLAIR hyperintensity around the PVSs is present in 25% of cases.
Embolic infarcts: Typically peripheral (cortical/subcortical) rather than the usual
central and deep location of typical lacunae.
Watershed or "border zone" infarcts: Occur in specific locations—along the
cortical and subcortical white matter watershed zones—whereas lacunae are more
randomly scattered lesions that primarily affect the basal ganglia, thalami, and deep
periventricular white matter.
WMHs associated with microvascular disease (primarily lipohyalinosis and
arteriolosclerosis): Less well defined and usually more patchy or confluent than the
small (<15 mm) lesions that represent true lacunar infarcts.WMHs tend to cluster
around the occipital horns and periventricular white matter, not the basal ganglia and
thalami.
A few scatteredT2/FLAIR hyperintensities are common in the normal aging brain.A general guideline is "one white spot
per decade" until the age of 50, after which the number and size ofWMHs increase at accelerated rates.
WATERSHED INFARCTS
WATERSHED INFARCTS
Comprise (10-12%) of infarcts.
Two types ofWatershed Areas:
1. External
2. Internal.
The two major external WS zones lie in the
frontal cortex (between the ACA and MCA)
and parietooccipital cortex (between the MCA
and PCA). A strip of paramedian subcortical
white matter near the vertex of the cerebral
hemispheres is also considered part of the
externalWS.
The internal WS zones represent the
junctions between penetrating branches (e.g.,
lenticulostriate arteries, medullary white
matter perforating arteries, and anterior
choroidal branches) and the major cerebral
vessels (MCA ,ACA, and PCA).
ETIOLOGY
Terminal vascular distributions normally have lower perfusion pressure than
main arterial trunks. Maximal vulnerability to hypoperfusion is greatest
where two distal arterial fields meet together.
Hypotension with or without severe arterial stenosis or occlusion can result in
hemodynamic compromise.
Flow in the affected WS zone can be critically lowered, resulting in ischemia
or frank infarction.
The most susceptible "border zone" is the "triple watershed" where the
ACA, MCA, and PCA all converge.
External WS infarcts are the more common type. Most external WS
infarcts are embolic.
Anterior cortical WS embolic infarcts often occur in concert with
internal carotid atherosclerosis.
External WS infarcts in all three "border zones" are less common and
usually reflect global hypoperfusion.
Internal WS infarcts are rarely embolic.They represent 35-40% of all WS
infarcts and are most often caused by regional hypoperfusion secondary to
hemodynamic compromise (e.g., ipsilateral carotid stenosis).
Internal WS infarcts tend to "line up" in the white matter, parallel to and slightly above the
lateral ventricles.
CerebellarWS infarcts occur at the borders between the posterior inferior, anterior
inferior, and superior cerebellar arteries.
External (cortical) WS infarcts show a bimodal spatial distribution.Anteriorly, they
center in the posterior frontal lobe near the junction of the frontal sulcus with the
precentral sulcus.
PosteriorWS infarcts center in the superior parietal lobule posterolateral to the
postcentral sulcus. The prevalence of WS infarcts decreases between these two areas.
WS infarcts spare the medial cortex
Bilateral lesions are often related to global reduction in perfusion pressure, usually an
acute hypotensive event.
GOALS OF IMAGING IN WATERSHED
INFARCT
(1)To determine whether hemodynamic impairment (i.e., vascular stenosis)
is present and, if present,
(2)To assess its severity.
Internal "border zone" infarcts can be
confluent or partial. Confluent
infarcts are large, cigar-shaped lesions
that lie alongside or just above the
lateral ventricles.
Partial infarcts are more discrete,
rosary-like lesions.They resemble a
line of beads extending from front to
back in the deep white matter.
Stenosis or occlusion of the ipsilateral
internal carotid artery or MCA is
common with unilateral lesions
Cortical (external)WS infarcts are
wedge- or gyriform-shaped
CerebellarWS infarct: Occur at border
between posteroinferior, anteroinferior
and superior cerebellar arteries
DIFFERENTIAL DIAGNOSIS OF WS INFARCT
Lacunar infarcts: Typically involve the basal ganglia, thalami, and pons and appear
randomly scattered.
Multiple embolic infarcts: Emboli are often bilateral and multiterritorial but can also
occur at vascular "border zones."
Posterior reversible encephalopathy syndrome (PRES): Typically occurs in
the setting of acute hypertension. The cortex/subcortical white matter in the PCA
distribution is most commonly affected although PRES can also involve "border
zones" and the basal ganglia. PRES rarely restricts on DWI (vasogenic edema),
whereas "border zone" infarcts with cytotoxic edema show acute restriction.
STROKES IN UNUSUALVASCULAR
DISTRIBUTIONS
ARTERY OF PERCHERON (AOP) INFARCTION
The artery of Percheron (AOP) is a vascular variant in which a single
large midbrain perforating artery arises from the P1 PCA
segment to supply the midbrain and medial thalami.
 AOP occlusion can cause obtundation, oculomotor and pupillary deficits,
vertical gaze palsy, ptosis, and lid retraction.
IMAGING IN AOP INFATRCTION
NECT scans in early acute AOP occlusion: Usually normal.
Hypodense areas in both thalami extending into the central
midbrain may develop later.
Procedure of choice: MR with DWI .T2/FLAIR scans show
round or ovoid hyperintensities in the medial thalami, just
lateral to the third ventricle.
In slightly more than half of all cases, aV-shaped hyperintensity
involves the medial surfaces of the cerebral peduncles and
rostral midbrain.
DWI shows diffusion restriction in the affected areas.
ARTERY OF PERCHERON INFARCTION
DIFFERENTIAL DIAGNOSIS
Top of the basilar infarct: "Top of the basilar" infarcts are much
more extensive, involving part or all of the rostral midbrain, occipital
lobes, superior vermis, and thalami.
Deep cerebral (galenic) venous occlusions: Involve the basal
ganglia, posterior limb of internal capsules, and typically the entire
thalami. T2* (GRE, SWI) scans demonstrate "blooming" clots in the
internal cerebral vein, vein of Galen, and straight sinus.
TOP OF BASILAR INFARCTION
"Top of the basilar" infarct is a clinically recognizable syndrome characterized by
visual, oculomotor, and behavioral abnormalities caused by thrombosis of the distal
basilar artery.
"Locked-in" syndrome is a rare but devastating manifestation of top of the basilar
thrombosis.
Thrombus typically occludes both proximal PCAs as well as distal perforators that
supply the rostral midbrain and thalami. Both occipital lobes are usually infarcted.
Depending on the inferior extent of the clot, pontine perforators and one or more
superior cerebellar artery territories may also be affected
NECT scans: Dense basilar artery sign.
Hypodensity in the occipital lobes and/or
thalami may be apparent.
MRI: Depending on thrombus extent and
vascular supply to the distal PCAs.
T2/FLAIR hyperintensity and diffusion
restriction in the midbrain, thalami, upper
pons, and superior cerebellar hemispheres
are common.
TOP OF BASILAR INFARCTION
MISCELLANEOUS STROKES
CEREBRAL HYPERPERFUSION SYNDROME:
Cerebral hyperperfusion syndrome (CHS) is a rare but potentially devastating
disorder.
CHS is sometimes called luxury perfusion or postcarotid
endarterectomy hyperperfusion and is defined as a major increase in
cerebral blood flow well above normal metabolic demands.
CHS most often occurs as a complication of carotid reperfusion procedures
(i.e., endarterectomy, angioplasty, stenting, or thrombolysis).
Critical carotid stenosis with chronic cerebral ischemia causes endothelial
dysfunction and impaired arterial autoregulation.
Loss of normal vasoconstriction results in chronic dilatation of the
brain "resistance" vessels.
When normal perfusion is restored, this can result in rapidly increased
cerebral blood flow (CBF) in the previously underperfused hemisphere.
Patients typically present within a few hours following carotid
endarterectomy (CEA), usually with unilateral headache, face or eye pain,
cognitive impairment, and variable neurologic deficits.
IMAGING
NECT scan: May show only mild gyral swelling.
CTA/pCT: Show congested, dilated vessels with elevated blood flow and
decreased MTT/TTP
MR Findings:T2/FLAIR scans show gyral swelling, hyperintensity, and
sulcal effacement in the internal carotid distribution.
T1 C+ scans may be normal or show mildly increased intravascular
enhancement.
DWI is typically negative, as the edema is vasogenic rather than cytotoxic.
pMR shows elevated CBF and cerebral blood volume with decreased
(shortened) MTT.
Postprocedure CHS on TOF-MRA is seen as an increase in the
change ratio of signal intensity more than 1.5x the preoperative level.
Nuclear Medicine: Single-photon emission computed tomography
(SPECT) has demonstrated focal hyperperfusion at the
revascularization
DIFFERENTIAL DIAGNOSIS
Acute cerebral ischemia-infarction: MTT is prolonged (not decreased), and DWI
typically shows restricted diffusion
Acute hypertensive encephalopathy (PRES): Dysautoregulatory disorder with a
predilection for the posterior circulation. Lesions are typically bilateral, not unilateral as
with post-CEA CHS.
Status epilepticus: Cortex is usually more selectively involved than the white matter.The
stroke-like episodes in MELAS (Mitochondrial Encephalomyopathy, Lactic Acidosis) are
related to vasogenic edema, hyperperfusion, and neuronal damage. Cortical hyperintensity
on T2/FLAIR can resemble CHS, but MRS in "normal-appearing" brain shows a
characteristically elevated lactate peak.
REFERENCES:
• Osborn's brain, Imaging, Pathology, and Anatomy, 2nd
edition
• Srinivasan A, Goyal M,Al Azri F, Lum C. State-of-the-art imaging of acute stroke.
Radiographics.;26 Suppl 1:S75-95. doi: 10.1148/rg.26si065501. PMID: 17050521.
THANKYOU

Stroke Imaging: Fundamental principles and concepts

  • 1.
    STROKE IMAGING Presented by:Dr.Anish Dhakal Resident MD Radiodiagnosis, KUSMS 1st July, 2025
  • 2.
    STROKE Stroke is ageneric term that describes a clinical event characterized by sudden onset of a neurological deficit. Stroke is a syndrome caused by disruption of the blood flow to part of the brain due to either: (a) Occlusion of a blood vessel (ischemic stroke, seen in approximately 80% of cases); or (b) Rupture of a blood vessel, resulting in injury to cells and causing sudden loss of focal brain functions. (hemorrhagic stroke). Classified into: 1. Ischemic stroke – 80%. 2. Hemorrhagic stroke – 20% a. Spontaneous intra cranial hemorrhage (sICH). b. Non traumatic SAH. c.Venous occlusions. Intracerebral hemorrhage (ICH), also known as intraparenchymal hemorrhage (IPH) and often synonymously describing hemorrhagic stroke, is a subset of an intracranial hemorrhage as well as of stroke, defined by the acute accumulation of blood within the brain parenchyma.
  • 3.
    ISCHEMIAVS INFARCT Temporal classification: 1.TIA = Transient ischemic attack • lasts 5 to 30 minutes + clears within 24 hours 2. RIND = Reversible ischemic neurologic deficit = fully reversible prolonged ischemic event resulting in minor neurologic dysfunction • > 24 hours and < 8 weeks with eventual total recovery Incidence: 16÷100,000 population / year 3. Progressing stroke / intermittent progressive stroke = stepwise / gradually progressing accumulative neurologic deficit evolving over hours /days
  • 4.
    4. Slow stroke =Rare clinical syndrome presenting as developing neuronal fatigue with weakness in lower / proximal upper extremity after exercise; occurs in patients with occluded ICA 5. Completed stroke = Severe + persistent stable neurologic deficit = cerebral infarction (death of neuronal tissue) as end stage of prolonged ischemia >21 days • Level of consciousness correlates well with size of infarct
  • 5.
    Third global leadingcause of death (after heart disease and cancer); Risk Factors: a. Advancing age. b. Hypertension. c. Diabetes. d. Stress. e. Obesity. f. Hyperlipidemia. g. Genome Wise Association Studies (GWAS).
  • 6.
    PATHOPHYSIOLOGY OF STROKE (CEREBROVASCULARACCIDENT) An estimated two million neurons are lost each minute when a major vessel such as the MCA is suddenly occluded. Cerebral blood flow (CBF) falls precipitously.The center of the affected brain parenchyma—the densely ischemic core—typically has a CBF <6-8 cm³/100 g/min. Oxygen is rapidly depleted, cellular energy production fails, and ion homeostasis is lost. Neuronal death with irreversible loss of function occurs in the core of an acute stroke.A relatively less ischemic penumbra surrounding the central core is present in about half of all patients. CBF in the penumbra is significantly reduced, falling from a normal of 60 cm³/100 g/min to 10-20 cm³/100 g/min. This ischemic but not-yet-doomed-to-infarct tissue represents physiologically "at risk" but potentially salvageable tissue.
  • 7.
    Pathogenesis: cerebral blood flow(<15-18ml/100gm/min.) O2 & glucose ATP Na –K ATPase Na influx into cell Cellular edema(cerebral edema)
  • 8.
    Effect of Cerebraledema: Gyral swelling, sulcal effacement. Herniation of brain, compression of ventricles. Increased ICT. Neurological deficit Imaging changes: Hypodensity of overall brain tissue Loss of grey-white differentiation( obscuration of basal ganglia, insular ribbon sign). Increased T1 & T2 relaxation time.
  • 9.
    Stroke is aclinical diagnosis. Imaging helps to compliment the diagnosis as well as exclude the stroke mimics. Clinical diagnosis of acute "stroke" is inaccurate in 15-20% of cases.
  • 10.
    ARTERIAL ISCHEMIA Account formajority (80%) of all strokes. Classified based upon duration or Evolution as: 1. Hyperacute (Onset – 6 hours). 2. Acute (Onset – 48 hours). 2. Subacute (48hours – 2 weeks). 3. Chronic (After 2 weeks). Causes include: 4. Atherosclerotic vascular disease (ASVD – 45%). 5. SmallVessel disease (15-30%). 6. Cardioembolic disease (15-25%). 7. Others (cryptogenic).
  • 11.
    ARTERIAL ISCHEMIA Cerebral BloodFlow: Normal – 60cm3 /100 gm/min. Ischemic Core – 6-8 cm3 /100gm/min. Penumbra – 10-20 cm3 /100gm/min. About 2 million neurons die every minute after an ischemic event is vessel like MCA. Hierarchy of Susceptibility: Hierarchy in Site: Hierarchy inVessel: 1. Neurons 1. Hippocampus. 1. MCA. 2. Astrocytes. 2. Neocortex (III,V andVI). 2. PCA 3. Oligodendrocytes. 3. Neostriatum. 3. Vertebrobasilar. 4. Microglial Cells. 4. ACA. 5. Ependymal Cells.
  • 12.
    ACUTE ISCHEMIA/INFARCTS The fourmust know Questions: 1. Is there ICH (or a stroke mimic)? – NECT. 2. Is a large vessel occluded? – CTA. 3. Is a part of brain irreversible injured? – pCT. 4. Is an ischemic penumbra present? – pCT. CT the mainstream of Radiological Investigation. Helps: 5. To differentiate bland/ischemic stroke from ICH. 6. To select/triage patients for possible reperfusion therapies.
  • 13.
    STROKE PROTOCOL/CT STROKE PROTOCOL/CODESTROKE CT The purpose of this protocol is three-fold: I. To assess the brain for established infarcts or alternative diagnoses II. To identify the location and physiological effects of arterial blockage III. To assess vascular anatomy that may impact endovascular access To achieve this, stroke protocol CT usually includes 3 concatenated scans : I. Non-contrast CT (brain) II. CT perfusion (brain) III. CT angiography (aortic arch to the vertex of the skull)
  • 14.
     Nonenhanced scanningmust be performed as soon as possible after the stroke code has been activated  Up to 60% CT can be normal  Emergent NECT to answer the first "must know" question in stroke imaging: Is intracranial hemorrhage or a stroke "mimic" (such as subdural hematoma or neoplasm) present?  Once intracranial hemorrhage is excluded, the second critical issue is determining whether a major cerebral vessel is occluded.  CT angiography (CTA) can be obtained immediately following the NECT scan and is the noninvasive procedure of choice for depicting potentially treatable major vessel occlusions.  MR angiography (MRA) is more susceptible to motion artifact, which is accentuated in uncooperative patients.  DSA is typically reserved for patients undergoing intraarterial thrombolysis or mechanical thrombectomy. Nonenhanced CT
  • 16.
    STROKEWINDOW The use ofnarrow window width (and therefore high-contrast) CT review settings i.e. “stroke windows” 40 Window width (WW) and 40 Window level (WL) as an integral part of the general evaluation of CT brain examination helps to increase detection of subtle, potentially significant lesions.
  • 17.
    Effect of windowsetting:  Axial unenhanced CT images, obtained in a 45-year-old man 2 hours after the onset of left hemiparesis, show obscuration of the right lentiform nucleus (arrow in b).  This feature is less visible with the routine brain imaging window used for a (window width, 80 HU; center, 35 HU) than width the narrower window used for b (window width, 10 HU; center, 28 HU).
  • 18.
    ACUTE INFARCTS Earliest Signsin NECT for Hyperacute Ischemia/Infarcts: 1. DenseVessel Sign: a. Hyperdense MCA Sign (M1) – Earliest of all (in about 30%). Most specific but least sensitive. MCA Dot Sign – MCA in the Sylvian Fissure (M2/M3). b. Other sites are: ICA, BA etc. Calcified Embolus may be present. Carries 50% risk of re-attack. 2. Blurring and Indistinct GW matter Interface: a. Insular Ribbon Sign. b. Disappearing BG Sign. Seen in about (50-70%) cases in the first 3 hours at the least.
  • 19.
    • A "denseMCA" sign is seen in 30% of cases with documented M1 occlusion (8- 30). Less common sites for a hyperdense vessel sign are the intracranial internal carotid artery, basilar artery, and MCA branches in the sylvian fissure ("dot" sign). • False positive hyperdense MCA sign is due to high hematocrit or calcified atherosclerotic disease (but is usually bilateral in these cases) and hypodense brain parenchyma (e.g. diffuse cerebral edema).
  • 20.
    Uncommon but importantNECT findings that indicate vascular occlusion include a calcified embolus, most likely from an "at-risk" ulcerated atherosclerotic plaque in the cervical or cavernous ICA. Wedge-shaped parenchymal hypodensity with indistinct GM-WM borders and cortical sulcal effacement develops in large territorial occlusions. If more than one-third of the MCA territory is initially involved, the likelihood of a "malignant“ MCA infarct with severe brain swelling rises, as does the risk of hemorrhagic transformation with attempted revascularization.
  • 21.
    Obscuration of thelentiform nucleus so-called disappearing basal ganglia sign MCA dot sign
  • 22.
    Insular ribbon sign:Hypodensity and swelling of the insular cortex
  • 23.
    ACUTE INFARCTS –QUANTIFICATION The Alberta Stroke Program Early CT Score (ASPECTS) was proposed in 2001 as a means of quantitatively assessing acute ischemia on CT images by using a 10-point topographic scoring Typical Features in NECT after the Evolution of Infarct: Wedge shaped parenchymal hypodensity with indistinct GM-WM borders and cortical sulcal effacement especially in large territorial occlusion. If >1/3rd of MCA territory is involved, increased risk of malignant Edema and Hemorrrhagic Transformation. ASPECTS:ALBERTA STROKE PROGRAM EARLY CT SCORE 10 scoring is given for various territories and subtracted from 10. MCA Cortex + Insular Ribbon = 7 points. Subcortical Structures = 3 points. Score < or = 7 ---- Increased Risk of HT and poor Outcome.
  • 24.
  • 25.
    Unenhanced CT images ina 56-year-old man with right hemiparesis (a at a lower level than b) demonstrate involvement of the M1region, insular cortex (I), and lentiform nucleus (L). Thus,three points are subtracted from the 10-point ASPECTS,and the final score is seven points. C caudate nucleus, IC internal capsule.
  • 26.
    CECT BRAIN CECT mayshow enhancing vessel if slow anterograde flow or retrograde filling via collaterals is present.
  • 27.
    CT ANGIOGRAPHY Localizes anddefines the extent of the intravascular thrombus. Assess collateral blood flow. Characterizes the atherosclerotic disease. Guidance for the interventional neuroradiologist prior to intraarterial thrombolysis if available. In intra-arterial thrombolysis higher chances of recanalization is seen in the occlusion of ICA, MCA stem and basilar artery [differentiating them from more distal (M2 or M3) occlusions for intravenous, intraarterial, or mixed (intravenous-intraarterial) treatment planning]
  • 28.
  • 31.
    PERFUSION CT pCT depictsthe effect of vessel occlusion on the brain parenchyma itself, offering a time-sensitive and practical assessment of cerebral hemodynamics and parenchymal viability that is key to acute stroke management Perfusion CT is obtained by monitoring the first pass of an iodinated contrast bolus through the cerebral circulation. As contrast passes through the brain, it causes transient hyperattenuation that is directly proportional to the amount of contrast in the vessels and blood in the brain.
  • 32.
    pCT As contrast passesthrough the brain, it causes transient hyperatteunation that is directly proportional to the amount of contrast in the vessels and blood in the brain. Parameters of pCT: 1. CBV (Cerebral BloodVolume): Volume of blood flowing in given volume of brain. 2. CBF (Cerebral Blood Flow): Volume of blood flowing through the given volume of brain in a time. 3. MTT (MeanTransitTime): Average time it takes the blood to transit through a given volume of brain. MTT=CBV/CBF. 4. TTP (Time to Peak): Opposite of CBF. Time from the beginning of contrast material injection to the maximum concentration of contrast material within a region of interest. Slow flow means more time to reach the peak. Red/Yellow/Green – Increased perfusion. Blue/Purple/Black – Decreased perfusion.
  • 33.
    pCT pCT inVarious Areasof Brain: MTT: Grey Matter (BG and Cortex) – Red/Yellow. Slow – Red. White Matter – Blue. Normal – Blue. Ischemia – Blue/Purple and Infarct/CSF – Black. Infarct Core (Irreversibly Damaged Brain): a. Matched Perfusion (CBV and CBF – both decrease). b. Increased MTT. Ischemic Penumbra: c. Perfusion Mismatch (Normal CBV, decreased CBF). Penumbra = CBV – CBF. Prolonged MTT (145%) beyond infarct core i.e. CBV/MTT mismatch = Penumbra. FLAIR – DWI Mismatch = Penumbra.
  • 34.
    DECODINGTHE COLOR CODES Knowingcolor scale is key. • For CBF, higher scale (red) means faster flow (good), and lower scale (blue) means less flow (bad). • For CBV, higher scale (red) means more volume (good), and lower scale less volume (bad) • For TTP, higher scale (red) means longer TTP (bad), and lower scale (blue) means shorter TTP (good).
  • 35.
    An ischemic penumbrawith potentially salvageable tissue is seen as a "mismatch" between markedly reduced CBV in the infarcted core and a surrounding area (penumbra) characterized by decreased CBF with normal or even transiently increased CBV (due to autoregulatory vasodilatation).  Thus the potentially salvageable brain tissue is equivalent to CBV minus CBF (hypoperfused tissue but viable). Prolonged MTT over 145% that extends beyond the core infarct area (so-called CBV/MTT mismatch) also characterizes the ischemic penumbra.
  • 39.
    Individuals in whomthe area of infarction matches the area of abnormal perfusion should not be treated regardless of other factors (time from onset of symptoms, extent of infarcted brain) because there is no brain tissue to protect. On the other hand, in patients where volume of brain at risk is greater than the already infarcted brain by more than 20%, treatment may result in improved outcome. More recent data indicate that the extent of collateralization of distal branches beyond the occlusion has a major impact on outcome as well (the better the collaterals, the better the prognosis), and must also be taken into consideration when triaging patients for recanalization.
  • 40.
    Perfusion imaging showsthe area of reduced blood flow, while diffusion-weighted imaging (DWI) shows the area of restricted water movement (which can indicate cell damage). A PDM exists when the perfusion deficit is larger than the DWI lesion, indicating the presence of potentially salvageable tissue.
  • 41.
     The clinicalapplication of CT perfusion imaging in acute stroke is based on the hypothesis that the penumbra shows Either: (a) Increased mean transit time with moderately decreased cerebral blood flow (60%) and normal or increased cerebral blood volume (80%–100% or higher) secondary to autoregulatory mechanisms; or (b) Increased mean transit time with markedly reduced cerebral blood flow (30%) and moderately reduced cerebral blood volume (60%), whereas infarcted tissue shows severely decreased cerebral blood flow (30%) and cerebral blood volume (40%) with increased mean transit time.  The penumbra will benefit from the therapy.The infarcted brain will not.
  • 42.
     CT perfusionmaps of cerebral blood volume (a) and cerebral blood flow (b) show, in the left hemisphere, a region of decreased blood volume (white oval) that corresponds to the ischemic core and a larger region of decreased blood flow (black oval in b) that includes the ischemic core and a peripheral region of salvageable tissue. The difference between the two maps (black oval white oval) is the penumbra. Ischemic core Region of dec. blood Penumbra Well perfused area
  • 44.
  • 45.
  • 46.
  • 47.
     Conventional spin-echoMR imaging is more sensitive and more specific than CT for the detection of acute cerebral ischemia within the first few hours after the onset of stroke.  It has the additional benefit of depicting the pathologic entity (stroke and its mimics) in multiple planes.  The MR sequences typically used in the evaluation of acute stroke include T1- weighted spin-echo,T2- weighted fast spin-echo, fluid-attenuated inversion recovery,T2*-weighted gradient-echo, and gadolinium-enhanced T1-weighted spin-echo sequences.  Conventional MR imaging is less sensitive than diffusion-weighted MR imaging in the first few hours after a stroke (hyperacute phase) and may result in false-negative findings. Conventional MR Imaging
  • 48.
     The principleof diffusion imaging is based on the integration of two diffusion- sensitive gradient pulses in a standard pulse sequence.  When the first gradient pulse is switched on, the different precession frequencies of the spin phases at different positions in the gradient field will lead to spin dephasing.  A second ‘opposite’ gradient pulse refocuses the different spin phases.  However, due to the additional molecular movement of the protons within a voxel, the phase cannot be completely refocused, resulting in a reduction in the MR signal  The actual diffusion coefficient cannot be measured by using diffusion- weighted MR imaging, for a number of reasons (including the inability of diffusion- weighted imaging to depict the difference between molecular motion due to concentration gradients and molecular motion due to thermal or pressure gradients or ionic interactions)  Hence, the diffusion coefficient obtained from orthogonal diffusion-weighted MR images in all three planes is called the apparent diffusion coefficient (ADC).
  • 49.
     In humans,diffusion restriction with reduced ADC has been observed as early as 30 minutes after the onset of ischemia.  The ADC continues to decrease further and reaches a nadir at approximately 3–5 days.  Thereafter, the ADC starts to increase again, and it returns to the baseline value at approximately 1–4 weeks.  This is likely due to the development of vasogenic edema along with the persistence of cytotoxic edema.  In a few weeks to months, gliosis develops, with a resultant increase in the quantity of extracellular water
  • 50.
     This samepattern of change can be observed in the diffusion-weighted MR imaging appearance of ischemic human brain tissue during the evolution of acute stroke.  Hyperintense signal is seen with reduced ADC values from approximately 30 minutes to 5 days after the onset of symptoms ;  Mildly hyperintense signal is seen with pseudonormal ADC values at 1–4 weeks; and variable signal intensity (because ofT2 characteristics) is seen with increased ADC values several weeks to months after symptom onset  The signal intensity in areas affected by acute stroke on diffusion-weighted images, thus, increases during the 1st week after symptom onset and decreases thereafter; however, the signal may remain hyperintense for a longer period.  Increased intensity of the diffusion-weighted imaging signal in the initial few days is due to restricted diffusion and thereafter is due to an increase of the T2 signal (T2 shine-through) from the infarcted tissue.
  • 53.
    MRI FINDINGS Highly specificpredictor for malignant MCA infarct is threshold core volume of more then 82 cc.
  • 54.
    While diffusion-weighted MRimaging is most useful for detecting irreversibly infarcted tissue,perfusion-weighted imaging may be used to identify areas of reversible ischemia as well typically susceptibility based and depend on T2* effects, but they may beT1 weighted instead. Dynamic susceptibility-weighted (T2*-weighted) sequences probably are most commonly used in acute stroke evaluation, while the other MR perfusion imaging techniques are more commonly used in tumor evaluation or other applications Perfusion-weighted MR Imaging
  • 55.
     The passageof an intravascular MR contrast agent through the brain capillaries causes a transient loss of signal because of the T2* effects of the contrast agent.  The dynamic contrast-enhanced MR perfusion imaging technique involves tracking of the tissue signal changes caused by susceptibility (T2*) effects to create a hemodynamic time–signal intensity curve.  As in dynamic CT perfusion imaging, perfusion maps of cerebral blood volume and mean transit time can be calculated from this curve by using a deconvolution technique Underlying Principles
  • 56.
     The lesionappears smaller on the diffusion weighted images than on the perfusion-weighted images.This is typically observed in large-vessel strokes .  In the acute stroke setting, a region that shows both diffusion and perfusion abnormalities is thought to represent irreversibly infarcted tissue. Same size on diffusion weighted images and perfusion-weighted images (no penumbra).  While a region that shows only perfusion abnormalities and has normal diffusion likely represents viable ischemic tissue, or a penumbra Comparison of Diffusion and Perfusion Abnormalities
  • 59.
    MRI FEATURES OF ACUTEISCHEMIA/ INFARCTION
  • 60.
    DSA IN ACUTEISCHEMIA/INFARCTION Used if planned for: 1. Intra-arterial thrombolyis. 2. Mechanical thrombectomy Done if: 3. Patient arrives beyond therapeutic window. 4. CI to Thrombolytic Therapy.
  • 61.
    DSA IN ACUTEISCHEMIA/INFARCTION
  • 62.
    DSA IN ACUTEISCHEMIA/INFARCTION
  • 63.
    DSA IN ACUTEISCHEMIA/INFARCTION
  • 64.
    MANAGEMENT OF ACUTESTROKE 1. Thrombolytic therapy: IV tPA: <3 hours of onset. IAThrombolysis: <6 hours of onset. Exception – Basilar Artery Ischemia/Infarction and if D/P Mismatch persists >6 hours. 2. Endovascular thrombectomy: Acute Ischemia involving Anterior Circulation. 3. Mechanical thrombectomy: If TherapeuticWindow for thrombolysis has already passed. If contraindicated forThrombolyticTherapy.
  • 65.
  • 66.
  • 67.
    © 2025 UpToDate,Inc. © 2025 UpToDate, Inc.
  • 68.
    THROMBOLYSIS UPDATED GUIDELINES Intravenousfibrinolytic therapy at the cerebral circulation dose within the first 3 hours of ischemic stroke onset offers substantial net benefits for virtually all patients with potentially disabling deficits. Intravenous fibrinolytic therapy at the cerebral circulation dose within 3-4.5 hours offers moderate net benefits when applied to all patients with potentially disabling deficits. MRI of the extent of the infarct core (already irreversibly injured tissue) and the penumbra (tissue at risk but still salvageable) can likely increase the therapeutic yield of lytic therapy, especially in the 3- to 9-hour window. Intra-arterial fibrinolytic therapy in the 3- to 6-hour window offers moderate net benefits when applied to all patients with potentially disabling deficits and large artery cerebral thrombotic occlusions. Classic thrombolysis drugs, also known as clot-busting drugs, include alteplase, reteplase, streptokinase, and urokinase. Newer thrombolytic drugs, like tenecteplase, are emerging as potential replacements for alteplase in treating acute ischemic stroke, offering benefits like ease of administration and potentially improved efficacy © 2025 UpToDate, Inc.
  • 69.
    The recommended doseis 0.9 mg/kg (maximum 90 mg total dose), 10% of the total dose is administered as an initial IV bolus over one minute, and the remaining dose is infused over 60 minutes. Much lower total dose (10-30 mg) in intraarterial therapy.
  • 70.
    SUBACUTE INFARCT  Strokesthat are between 48 hrs to 2 wks duration.  Characterized by marked edema and hemorrhagic transformation. Increased mass effect (maximum in 3-4 days). Frank tissue necrosis with progressive influx of microglia and macrophages around vessels ensues with reactive astrocytosis around the perimeter of the stroke. Brain softening and then cavitation proceeds over the next 2 weeks. HemorrhagicTransformation (about 20-25% cases) – Between 2 days to 1week. Presence of Fogging Phenomenon.  NCCT findings:  More sharply defined wedge shaped decreased attenuation. Mass effect initially increase and begins to decrease by 7- 10 days.  Cases with hemorrhagic transformation shows gyriform cortical and basal ganglia hyperdensity.  CECT shows: Patchy gyriform enhancement appearing as early as two days with peak at two weeks and disappearing by two month (Rule of 2 in subacute Infarcts)
  • 71.
    MR findings (dependson time since ictus and hemorrhagic transformation): 1.T1WI: Non hemorrhagic infarct shows hypointensity with moderate mass effect and sulcal effacement. However, the hemorrhagic transformation shows the iso signal intensity with cortex initially followed by hyperintensity. 2.T2WI: Initially hyperintense, with time the signal intensity decreases reaching iso at the one to two weeks known as “T2 fogging effect”.
  • 73.
    These infarcts showshyperintesity on FLAIR images. Final infarct volume corresponds to FLAIR defined abnormality after one week. T2* gradient echo images show the hemorrhagic transformation as petechial or gyriform blooming foci. However in basal ganglia it can be petechial or confluent. DWI shows hyperintensity with hypointensity on ADC map for first several days,which then gradually reverse subsequently. T1 contrast images shows intravascular enhancement in first 48 hrs which is replaced by leptomemingeal enhacement caused by persisting pial collateral blood flow after three to four days. Patchy and gyriform enhancement occurs as early as two to three days and may persist for two to three months.
  • 74.
  • 75.
    HEMORRHAGICTRANSFORMATION Can be eitherPetechial and rarely Lobar. Occur in about (20-25%) cases of Ischemic Strokes. Occurs between (2-7 days). Can be spontaneous or After IV tPA therapy. Predictors after tPA are: 1. Severe strokes. 2. Proximal MCA occlusion. 3. >1/3rd territory of MCA affected. 4.Absence collateral or delayed recanalization. 5. Gray matter infarction
  • 76.
    European Cooperative AcuteStroke Study classification:
  • 77.
    Figure . Drawings(top) illustrate the territories (blue) of the ACA, middle cerebral artery (MCA) , and posterior cerebral artery. CT scans (bottom) show es- tablished infarctions of these arteries  European Cooperative Acute Stroke Study trial: Involvement of more than one-third of the MCA territory depicted at unenhanced CT was a criterion for the exclusion of patients from thrombolytic therapy because of a potential increase in the risk for hemorrhage
  • 80.
    FOGGING PHENOMENON Transient returnof the infarcted cortex to a near normal appearance in the evolution of stroke is called the Fogging Phenomenon. Occurs in about 50% cases between (2-3 weeks). Causes: 1. Lipid laden macrophages migration. 2. Proliferation of capillaries. 3. Reduced edema and 4. Cortical laminar necrosis. CECT will show vivid ribbon like cortical enhancement.
  • 81.
  • 83.
    CHRONIC INFARCTS Also calledpost infarction encephalomalacia. NECT: Sharply well-delineated wedge shaped hypodense area that involves both GWM and is confined to a specific vascular territory. Features of volume loss are evident. Depression in function, metabolism, and perfusion affecting a cerebellar hemisphere occurring as a result of a contralateral focal supratentorial infarct (cerebellar diachisis) MRI: Cystic encephalomalacia with CSF equivalent signal intensity on all sequences. DWI shows increased diffusivity and hyperintense on ADC.
  • 85.
  • 88.
  • 89.
    Brain emboli areless common but important causes of stroke. Most consist of clots containing fibrin, platelets, and RBCs. Less common emboli include air, fat, calcium, tumor, and foreign bodies (e.g.,debris from metallic heart valves).
  • 90.
    MULTIPLE EMBOLIC INFARCTS Thedifferentials of multiple embolic infarcts are: 1. Cardio-embolic infarcts. 2. Fat embolism. 3. Gas embolism.
  • 91.
    CARDIAC AND ATHEROMATOUSEMBOLI Hallmark: Small acute infarct in multiple different vascular distributions. Peripheral signs: Splinter hemorrhage Echo:Valvular vegetations, intra cardiac filling defects Tend to involve terminal cortical branches
  • 92.
    CT SCAN In contrastto large artery territorial strokes, embolic infarcts tend to involve terminal cortical branches. The GM-WM interface is most commonly affected. NECT: Low-attenuation foci, often in a wedge-shaped distribution. Atherosclerotic emboli occasionally demonstrate calcification. Septic emboli are often hemorrhagic. CECT scans: May demonstrate multiple punctate or ring-enhancing lesions.
  • 93.
    MRI MRI: Multifocal peripheralT2/FLAIRhyperintensities. Hemorrhagic emboli cause "blooming" onT2* sequences (most sensitive sequence: DWI). Typical finding in multiple emboli infarcts: Small peripheral foci of diffusion restriction in several different vascular distributions. T1 C+ imaging may show multiple punctate enhancing foci. Septic emboli often demonstrate ring enhancement, resembling microabscesses.
  • 96.
    The differentials are: 1.Hypotensive cerebral infarction Has hemodynamic compromise and tend to involve deep internal watershed zones. 2. Parenchymal metastasis: Have predilection for GM WM interface but do not restrict on DWI.
  • 97.
    FAT EMBOLI Hypoxia/neurological symptomswith petechial rash in setting of severely displaced lower extremity long bone fractures (most commonly femoral neck fractures) The term "cerebral fat emboli" (CFE) refers to the neurologic manifestations of FES.
  • 98.
    Etiology: Small vessel occlusionfrom fat particles Inflammatory changes in surrounding tissue initiated by breakdown of fat into free fatty acids and other metabolic byproducts.
  • 99.
    CEREBRAL FAT EMBOLI(FES) Hallmarks is: Arteriolar fat emboli with perivascular microhemorrhages. Imaging findings reflect the effects of the fat emboli (i.e., multifocal tiny strokes and microhemorrhages) on brain tissue, not the fat itself.
  • 100.
    NECT scan: Generallynormal MRI: MR shows numerous (average = 50) punctate or confluent hyperintensities in the cerebellum, basal ganglia, periventricularWM, and GM- WM junctions on T2/FLAIR. DWI shows innumerable tiny punctate foci of diffusion restriction in multiple vascular distributions, the "star field“ pattern. The deep watershed border zones are commonly involved. Solitary or multiple small hypointense "blooming" foci can be identified in up to one-third of all FES cases onT2* GRE. SWI discloses innumerable (>200) tiny "black dots" in the majority of patients.
  • 103.
    The differentials are: CardiacEmboli: Multiple cardiac or atheromatous embolic infarcts rarely produce the dozens or even hundreds of lesions seen with CFE. Lesions tend to involve the basal ganglia and corticomedullary junctions more than the white matter. DAI/DVI: Tend to have linear as well as punctate microbleeds. Multifocal "blooming" hypointensities onT2* can be seen with severe diffuse axonal injury (DAI) or diffuse vascular injury (DVI).
  • 104.
    CEREBRAL GAS EMBOLISM Causesinclude: 1. IV catheter 2. CV line 3. Lung biopsy 4. Craniotomy 5. Decompression sickness 6. Hydrogen peroxide ingestion
  • 105.
    IMAGING FEATURES OFCEREBRAL GAS EMBOLISM Asymptomatic air following intravenous catheter placement is most commonly observed as an incidental finding, typically as dots of air in the cavernous sinus. Intracranial air bubbles can be identified in 70% of symptomatic CGE cases, appearing on NECT as transient small intravascular rounded or curvilinear hypodensities, typically located at the depths of sulci. Intraparenchymal air is less common. Air is quickly absorbed and can rapidly disappear. If massive air embolism occurs, cerebral ischemia or diffuse brain swelling typically ensues.
  • 107.
  • 109.
  • 110.
    LACUNAR INFARCTS Also termedas Subclinical Strokes or Silent Strokes. Lacuna – (3-15 mm) CSF filled cavities in the BG and deep white matter which are pale, small, irregular but well-delineated. 25% of Ischemic strokes are lacunar. Lacunae are sometimes called "silent" strokes, a misnomer as subtle neuropsychologic impairment is common in these patients. Between 20-30% of patients with lacunar stroke experience neurological deterioration hours or even days after the initial event.
  • 111.
    Lacunae are consideredmacroscopic markers of cerebral small vessel ("microvascular") disease. There are two major vascular pathologies involving small penetrating arteries and arterioles: (1)Thickening of the arterial media by lipohyalinosis, fibrinoid necrosis, and atherosclerosis causing luminal narrowing and (2)Obstruction of penetrating arteries at their origin by large intimal plaques in the parent arteries. The MTHFR C677T genotype is correlated with lacunar stroke.
  • 112.
    Penetrating branches thatarise from the circle of Willis and peripheral cortical arteries are small end-arteries with few collaterals, so lacunar infarcts are most common in the basal ganglia (putamen, globus pallidus, caudate nucleus), thalami, internal capsule, deep cerebral white matter, and pons. Lacunae are, by definition, 15 mm or less in diameter. Multiple lesions are common. Between 13-15% of patients have multiple simultaneous acute lacunar infarcts.
  • 113.
    ACUTE LACUNAR INFARCTS NECTscans: Mostly invisible Acute lacunar infarcts are hyperintense onT2/FLAIR and may be difficult to distinguish from foci of coexisting chronic microvascular disease.  Acute and early subacute lacunae restrict on DWI and also usually enhance onT1 C+. DWI overestimates the eventual size of lacunar infarcts. Cavitation and lesion shrinkage are seen in more than 95% of deep symptomatic lacunar infarcts on follow-up imaging.
  • 116.
    CHRONIC LACUNAR INFARCTS Oldlacunae appear as well-defined but often somewhat irregular CSF- like "holes" in the brain parenchyma on NECT scans. Chronic lacunar infarcts are hypointense onT1WI and hyperintense onT2WI. The fluid in the cavity suppresses on FLAIR, whereas the gliotic periphery remains hyperintense. Multifocal white matter disease, seen as WMHs, is also common in patients with frank lacunar infarcts. Most lacunae are nonhemorrhagic and do not "bloom" on T2* sequences. However, parenchymal microbleeds—multifocal "blooming black dots" on T2* (GRE, SWI)—are common comorbidities in patients with lacunar infarcts and chronic hypertension.
  • 117.
    DIFFERENTIAL DIAGNOSIS Major D/D:Prominent perivascular spaces (PVSs) aka Virchow-Robin spaces, prominent PVSs are pialined, interstitial fluid-filled spaces (increase in size and frequency with age). The most common locations for PVSs are the inferior third of the basal ganglia (clustered around the anterior commissure), subcortical white matter (including the external capsule), and the midbrain PVSs are sharply marginated and ovoid, linear, or round. Lacunae tend to be more irregularly shaped. PVSs faithfully follow CSF signal intensity on all MR sequences and suppress completely on FLAIR. The adjacent brain is typically normal although a thin rim of FLAIR hyperintensity around the PVSs is present in 25% of cases.
  • 118.
    Embolic infarcts: Typicallyperipheral (cortical/subcortical) rather than the usual central and deep location of typical lacunae. Watershed or "border zone" infarcts: Occur in specific locations—along the cortical and subcortical white matter watershed zones—whereas lacunae are more randomly scattered lesions that primarily affect the basal ganglia, thalami, and deep periventricular white matter. WMHs associated with microvascular disease (primarily lipohyalinosis and arteriolosclerosis): Less well defined and usually more patchy or confluent than the small (<15 mm) lesions that represent true lacunar infarcts.WMHs tend to cluster around the occipital horns and periventricular white matter, not the basal ganglia and thalami. A few scatteredT2/FLAIR hyperintensities are common in the normal aging brain.A general guideline is "one white spot per decade" until the age of 50, after which the number and size ofWMHs increase at accelerated rates.
  • 120.
  • 121.
    WATERSHED INFARCTS Comprise (10-12%)of infarcts. Two types ofWatershed Areas: 1. External 2. Internal.
  • 122.
    The two majorexternal WS zones lie in the frontal cortex (between the ACA and MCA) and parietooccipital cortex (between the MCA and PCA). A strip of paramedian subcortical white matter near the vertex of the cerebral hemispheres is also considered part of the externalWS. The internal WS zones represent the junctions between penetrating branches (e.g., lenticulostriate arteries, medullary white matter perforating arteries, and anterior choroidal branches) and the major cerebral vessels (MCA ,ACA, and PCA).
  • 123.
    ETIOLOGY Terminal vascular distributionsnormally have lower perfusion pressure than main arterial trunks. Maximal vulnerability to hypoperfusion is greatest where two distal arterial fields meet together. Hypotension with or without severe arterial stenosis or occlusion can result in hemodynamic compromise. Flow in the affected WS zone can be critically lowered, resulting in ischemia or frank infarction. The most susceptible "border zone" is the "triple watershed" where the ACA, MCA, and PCA all converge.
  • 125.
    External WS infarctsare the more common type. Most external WS infarcts are embolic. Anterior cortical WS embolic infarcts often occur in concert with internal carotid atherosclerosis. External WS infarcts in all three "border zones" are less common and usually reflect global hypoperfusion. Internal WS infarcts are rarely embolic.They represent 35-40% of all WS infarcts and are most often caused by regional hypoperfusion secondary to hemodynamic compromise (e.g., ipsilateral carotid stenosis).
  • 126.
    Internal WS infarctstend to "line up" in the white matter, parallel to and slightly above the lateral ventricles. CerebellarWS infarcts occur at the borders between the posterior inferior, anterior inferior, and superior cerebellar arteries. External (cortical) WS infarcts show a bimodal spatial distribution.Anteriorly, they center in the posterior frontal lobe near the junction of the frontal sulcus with the precentral sulcus. PosteriorWS infarcts center in the superior parietal lobule posterolateral to the postcentral sulcus. The prevalence of WS infarcts decreases between these two areas. WS infarcts spare the medial cortex Bilateral lesions are often related to global reduction in perfusion pressure, usually an acute hypotensive event.
  • 127.
    GOALS OF IMAGINGIN WATERSHED INFARCT (1)To determine whether hemodynamic impairment (i.e., vascular stenosis) is present and, if present, (2)To assess its severity.
  • 129.
    Internal "border zone"infarcts can be confluent or partial. Confluent infarcts are large, cigar-shaped lesions that lie alongside or just above the lateral ventricles. Partial infarcts are more discrete, rosary-like lesions.They resemble a line of beads extending from front to back in the deep white matter. Stenosis or occlusion of the ipsilateral internal carotid artery or MCA is common with unilateral lesions
  • 131.
    Cortical (external)WS infarctsare wedge- or gyriform-shaped CerebellarWS infarct: Occur at border between posteroinferior, anteroinferior and superior cerebellar arteries
  • 133.
    DIFFERENTIAL DIAGNOSIS OFWS INFARCT Lacunar infarcts: Typically involve the basal ganglia, thalami, and pons and appear randomly scattered. Multiple embolic infarcts: Emboli are often bilateral and multiterritorial but can also occur at vascular "border zones." Posterior reversible encephalopathy syndrome (PRES): Typically occurs in the setting of acute hypertension. The cortex/subcortical white matter in the PCA distribution is most commonly affected although PRES can also involve "border zones" and the basal ganglia. PRES rarely restricts on DWI (vasogenic edema), whereas "border zone" infarcts with cytotoxic edema show acute restriction.
  • 135.
  • 136.
    ARTERY OF PERCHERON(AOP) INFARCTION The artery of Percheron (AOP) is a vascular variant in which a single large midbrain perforating artery arises from the P1 PCA segment to supply the midbrain and medial thalami.  AOP occlusion can cause obtundation, oculomotor and pupillary deficits, vertical gaze palsy, ptosis, and lid retraction.
  • 137.
    IMAGING IN AOPINFATRCTION NECT scans in early acute AOP occlusion: Usually normal. Hypodense areas in both thalami extending into the central midbrain may develop later. Procedure of choice: MR with DWI .T2/FLAIR scans show round or ovoid hyperintensities in the medial thalami, just lateral to the third ventricle. In slightly more than half of all cases, aV-shaped hyperintensity involves the medial surfaces of the cerebral peduncles and rostral midbrain. DWI shows diffusion restriction in the affected areas.
  • 138.
  • 139.
    DIFFERENTIAL DIAGNOSIS Top ofthe basilar infarct: "Top of the basilar" infarcts are much more extensive, involving part or all of the rostral midbrain, occipital lobes, superior vermis, and thalami. Deep cerebral (galenic) venous occlusions: Involve the basal ganglia, posterior limb of internal capsules, and typically the entire thalami. T2* (GRE, SWI) scans demonstrate "blooming" clots in the internal cerebral vein, vein of Galen, and straight sinus.
  • 140.
    TOP OF BASILARINFARCTION "Top of the basilar" infarct is a clinically recognizable syndrome characterized by visual, oculomotor, and behavioral abnormalities caused by thrombosis of the distal basilar artery. "Locked-in" syndrome is a rare but devastating manifestation of top of the basilar thrombosis. Thrombus typically occludes both proximal PCAs as well as distal perforators that supply the rostral midbrain and thalami. Both occipital lobes are usually infarcted. Depending on the inferior extent of the clot, pontine perforators and one or more superior cerebellar artery territories may also be affected
  • 141.
    NECT scans: Densebasilar artery sign. Hypodensity in the occipital lobes and/or thalami may be apparent. MRI: Depending on thrombus extent and vascular supply to the distal PCAs. T2/FLAIR hyperintensity and diffusion restriction in the midbrain, thalami, upper pons, and superior cerebellar hemispheres are common.
  • 142.
    TOP OF BASILARINFARCTION
  • 144.
  • 145.
    CEREBRAL HYPERPERFUSION SYNDROME: Cerebralhyperperfusion syndrome (CHS) is a rare but potentially devastating disorder. CHS is sometimes called luxury perfusion or postcarotid endarterectomy hyperperfusion and is defined as a major increase in cerebral blood flow well above normal metabolic demands. CHS most often occurs as a complication of carotid reperfusion procedures (i.e., endarterectomy, angioplasty, stenting, or thrombolysis). Critical carotid stenosis with chronic cerebral ischemia causes endothelial dysfunction and impaired arterial autoregulation.
  • 146.
    Loss of normalvasoconstriction results in chronic dilatation of the brain "resistance" vessels. When normal perfusion is restored, this can result in rapidly increased cerebral blood flow (CBF) in the previously underperfused hemisphere. Patients typically present within a few hours following carotid endarterectomy (CEA), usually with unilateral headache, face or eye pain, cognitive impairment, and variable neurologic deficits.
  • 147.
    IMAGING NECT scan: Mayshow only mild gyral swelling. CTA/pCT: Show congested, dilated vessels with elevated blood flow and decreased MTT/TTP MR Findings:T2/FLAIR scans show gyral swelling, hyperintensity, and sulcal effacement in the internal carotid distribution. T1 C+ scans may be normal or show mildly increased intravascular enhancement. DWI is typically negative, as the edema is vasogenic rather than cytotoxic.
  • 148.
    pMR shows elevatedCBF and cerebral blood volume with decreased (shortened) MTT. Postprocedure CHS on TOF-MRA is seen as an increase in the change ratio of signal intensity more than 1.5x the preoperative level. Nuclear Medicine: Single-photon emission computed tomography (SPECT) has demonstrated focal hyperperfusion at the revascularization
  • 151.
    DIFFERENTIAL DIAGNOSIS Acute cerebralischemia-infarction: MTT is prolonged (not decreased), and DWI typically shows restricted diffusion Acute hypertensive encephalopathy (PRES): Dysautoregulatory disorder with a predilection for the posterior circulation. Lesions are typically bilateral, not unilateral as with post-CEA CHS. Status epilepticus: Cortex is usually more selectively involved than the white matter.The stroke-like episodes in MELAS (Mitochondrial Encephalomyopathy, Lactic Acidosis) are related to vasogenic edema, hyperperfusion, and neuronal damage. Cortical hyperintensity on T2/FLAIR can resemble CHS, but MRS in "normal-appearing" brain shows a characteristically elevated lactate peak.
  • 152.
    REFERENCES: • Osborn's brain,Imaging, Pathology, and Anatomy, 2nd edition • Srinivasan A, Goyal M,Al Azri F, Lum C. State-of-the-art imaging of acute stroke. Radiographics.;26 Suppl 1:S75-95. doi: 10.1148/rg.26si065501. PMID: 17050521.
  • 153.

Editor's Notes

  • #19 Earliest sign; acutely formed thrombus vs embolus (mc)
  • #21 Disappearing basal ganglia sign
  • #71 y
  • #78 Usually seen in first 4 days>50% of all;,