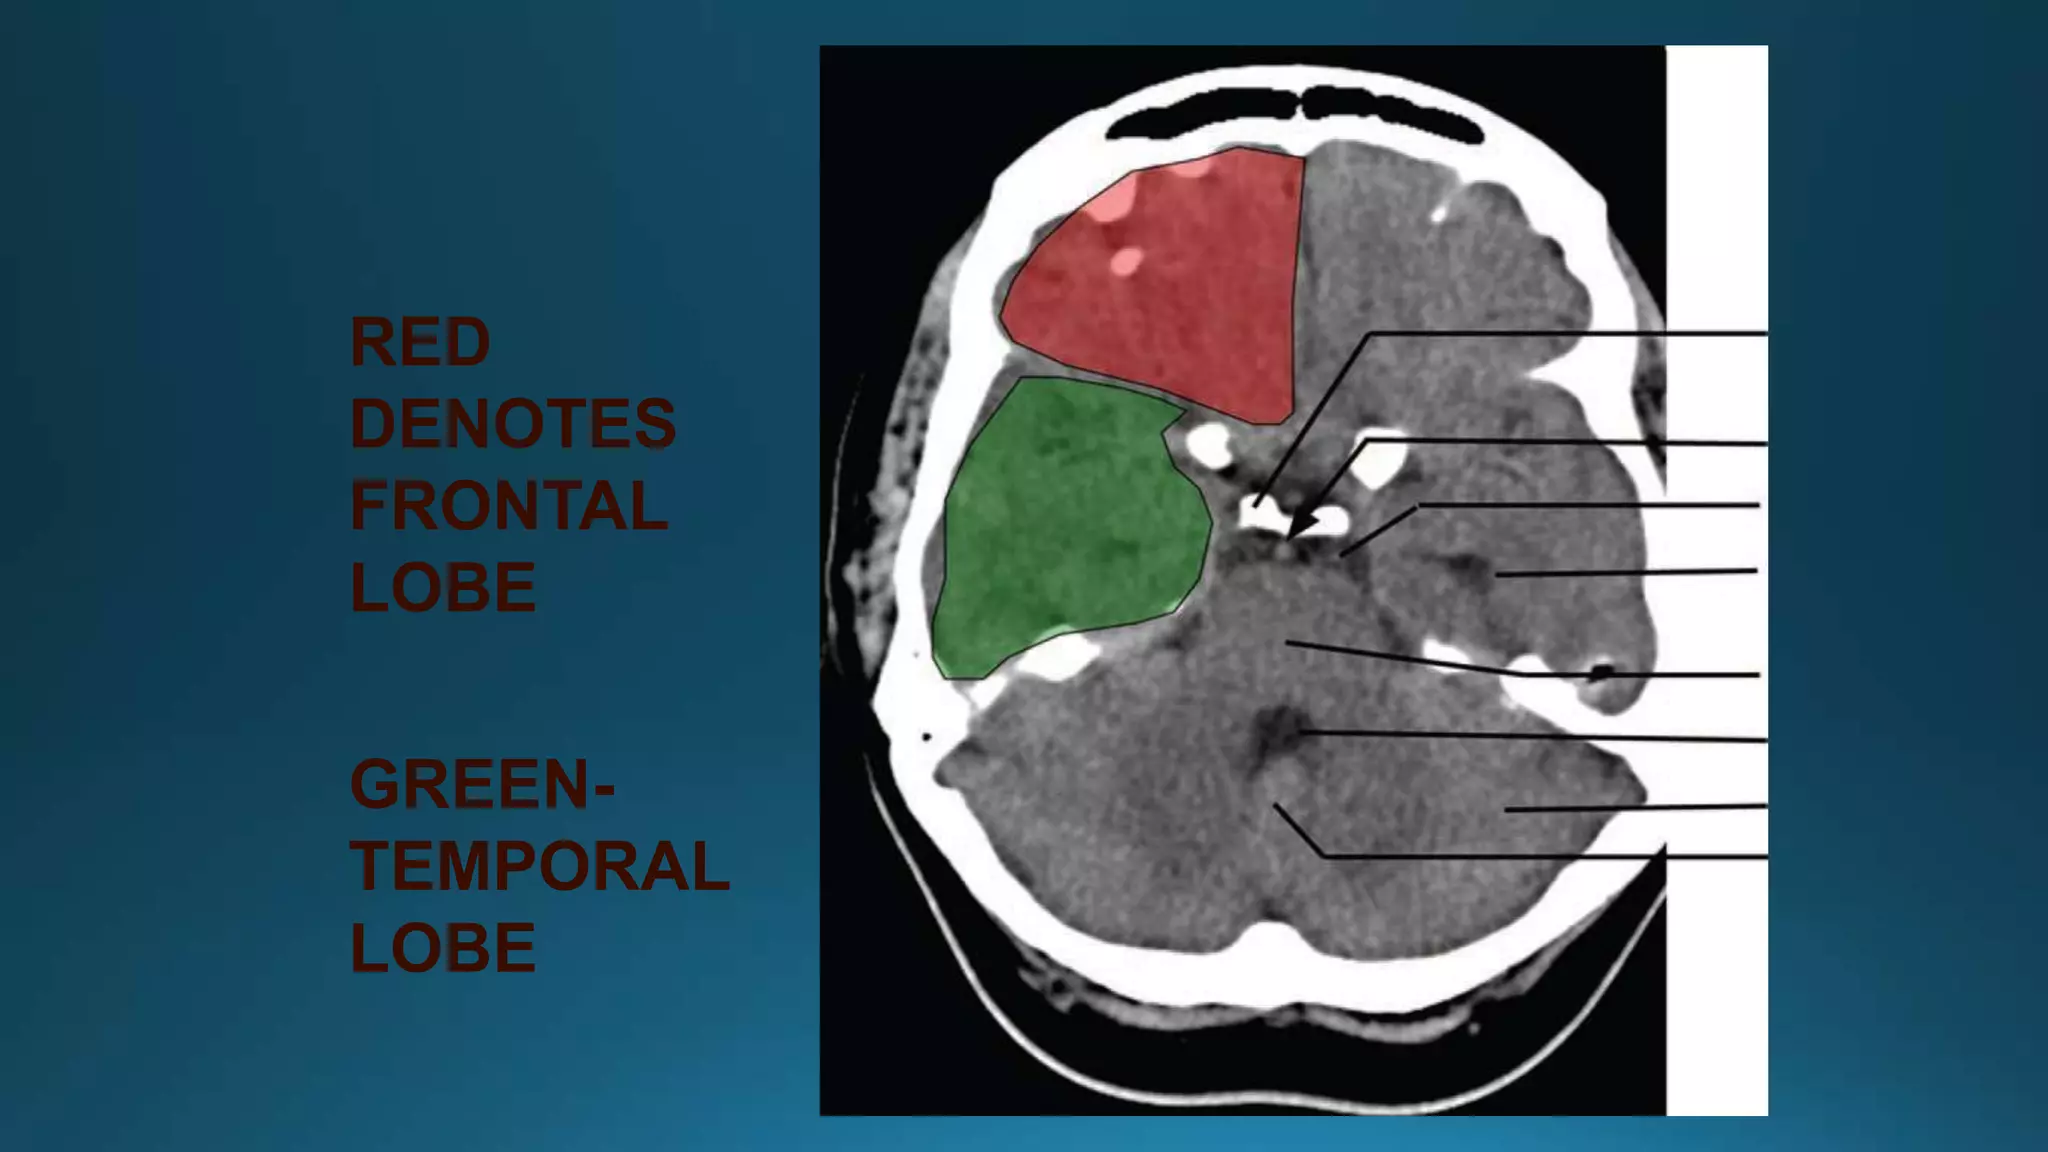
This document provides information about brain anatomy and stroke imaging. It describes the major lobes of the brain including the frontal, temporal, parietal and occipital lobes. It then discusses stroke, noting the differences between ischemic and hemorrhagic stroke. Imaging goals for acute stroke are outlined, focusing on distinguishing between ischemic stroke and hemorrhage, and identifying patients who may benefit from reperfusion therapies. Various MRI sequences are described for imaging acute and chronic strokes at different time points.
52. PATHOPHYSIOLOGY OF ACUTE ISCHEMIC
STROKE
CEREBRAL BLOOD FLOW( in
ml/min/100g )
NORMAL 50-60
OLIGEMIC STATE 35
ISCHEMIC STATE 20
INFARCTION <10
53. • It is the area at risk for infarction, if
the blood flow is not restored to
normal
• It still has marginal blood supply from
collateral sources and retains intact
cellular metabolism.
80. • AlthoughCT is the most commonly used modality for stroke
imaging,
for hyperacute ischemia.
• Absence of radiation
81. First 3-6 hours = normal
BLURRINGOFGrey matter-White Matter
INTERFACE
LOSSOFTHE EXPECTED FLOWVOID
82.
83. Nearly all stroke are FLAIR POSITIVE (cortical swelling
and hyperintensity , intraarterial hyperintensity) by 7
hours
T2 scans become positive by 12-24 hours
88. • DWI can detect ischemia within
20 minutes with 95% sensitivity
signal intensity of DWI decreases
after 3-4 days but persists for 10-
14 days.
Hypointensity on ADC is
maximum at 2-3 days, but
persist for 7-10 days
105. IMAGING SEQUENCE HYPERACUTE
INFARCT
ACUTE INFARCT
T1 WEIGHTED isointensity usually low signal intensity after 12-
24 hours, BLURRINGOF GW-WM
INTERFACEcan be seen
T2 WEIGHTED Isointensity after 12-24 hours ; may
see loss of flow void in large arteries
usually high signal intensity
FLAIR usually positive after 7 hours high signal intensity
DIFFUSIONWEIGHTED IMAGING high signal intensity high signal intensity
ADC MAPPING low signal intensity low signal intensity
CONTRAST ENHANCEDT1
WEIGHTED
arterial enhancement may occur
after 0-2 hours
arterial enhancement may occur
110. ROLE OF PERFUSION MRI
scale is graduated from
red yellow green …… highest
blue purple black…… lowest
ischemic brain is blue purple
infarct appears black
117. HEMORRHAGIC TRANSFORMATION (HT)
20-25% cases 2days to a week
after ictus.
Reperfusion either spontaneously / following
treatment causes exudation of blood .
HT Indicates favourable outcome
122. T1 C+
Arterial enhancement :- seen after 3 days, nonspecific
Parenchymal enhancement :- after 5-7 days , remains
for 2-3 months
Laptomaningial enhancement :- or ring enhancement
may be seen
127. MR IMAGING FEATURES
T1WI- Hypointense , hyperintensity with
cortical necrosis may be seen.
T2WI- High signal intensity
FLAIR - Low signal intensity in presence of
cystic encephalomalacia , marginal gliosis
around the old cavitated lesions shows
hyperintensity.
134. ISCHEMIC STROKE, HYPOGLYCEMIA , STATUS
EPILEPTICUS, CARDIACARREST
in medial occipital cortex and perirolandic region
• due to neuronal damage , reactive tissue change of glia and
deposition of lipid laden macrophages.
T1 hyperintensity – typically after 2 weeks to 1 month and
fades over 3 months. But is seen for as long as 1.5 years
159. ACUTE 0-5 DAYS SUBACUTE 6-
15DAYS
CHRONIC>15
DAYS
Isointense onT1 Hyperintense on
bothT1 andT2
Isointense onT1
Hypointense on T2
Due to intracellular
deoxyhemoglobin
Due to
methemoglobin
In thrombus
Iso -hyper onT2