
Download as PDF, PPTX
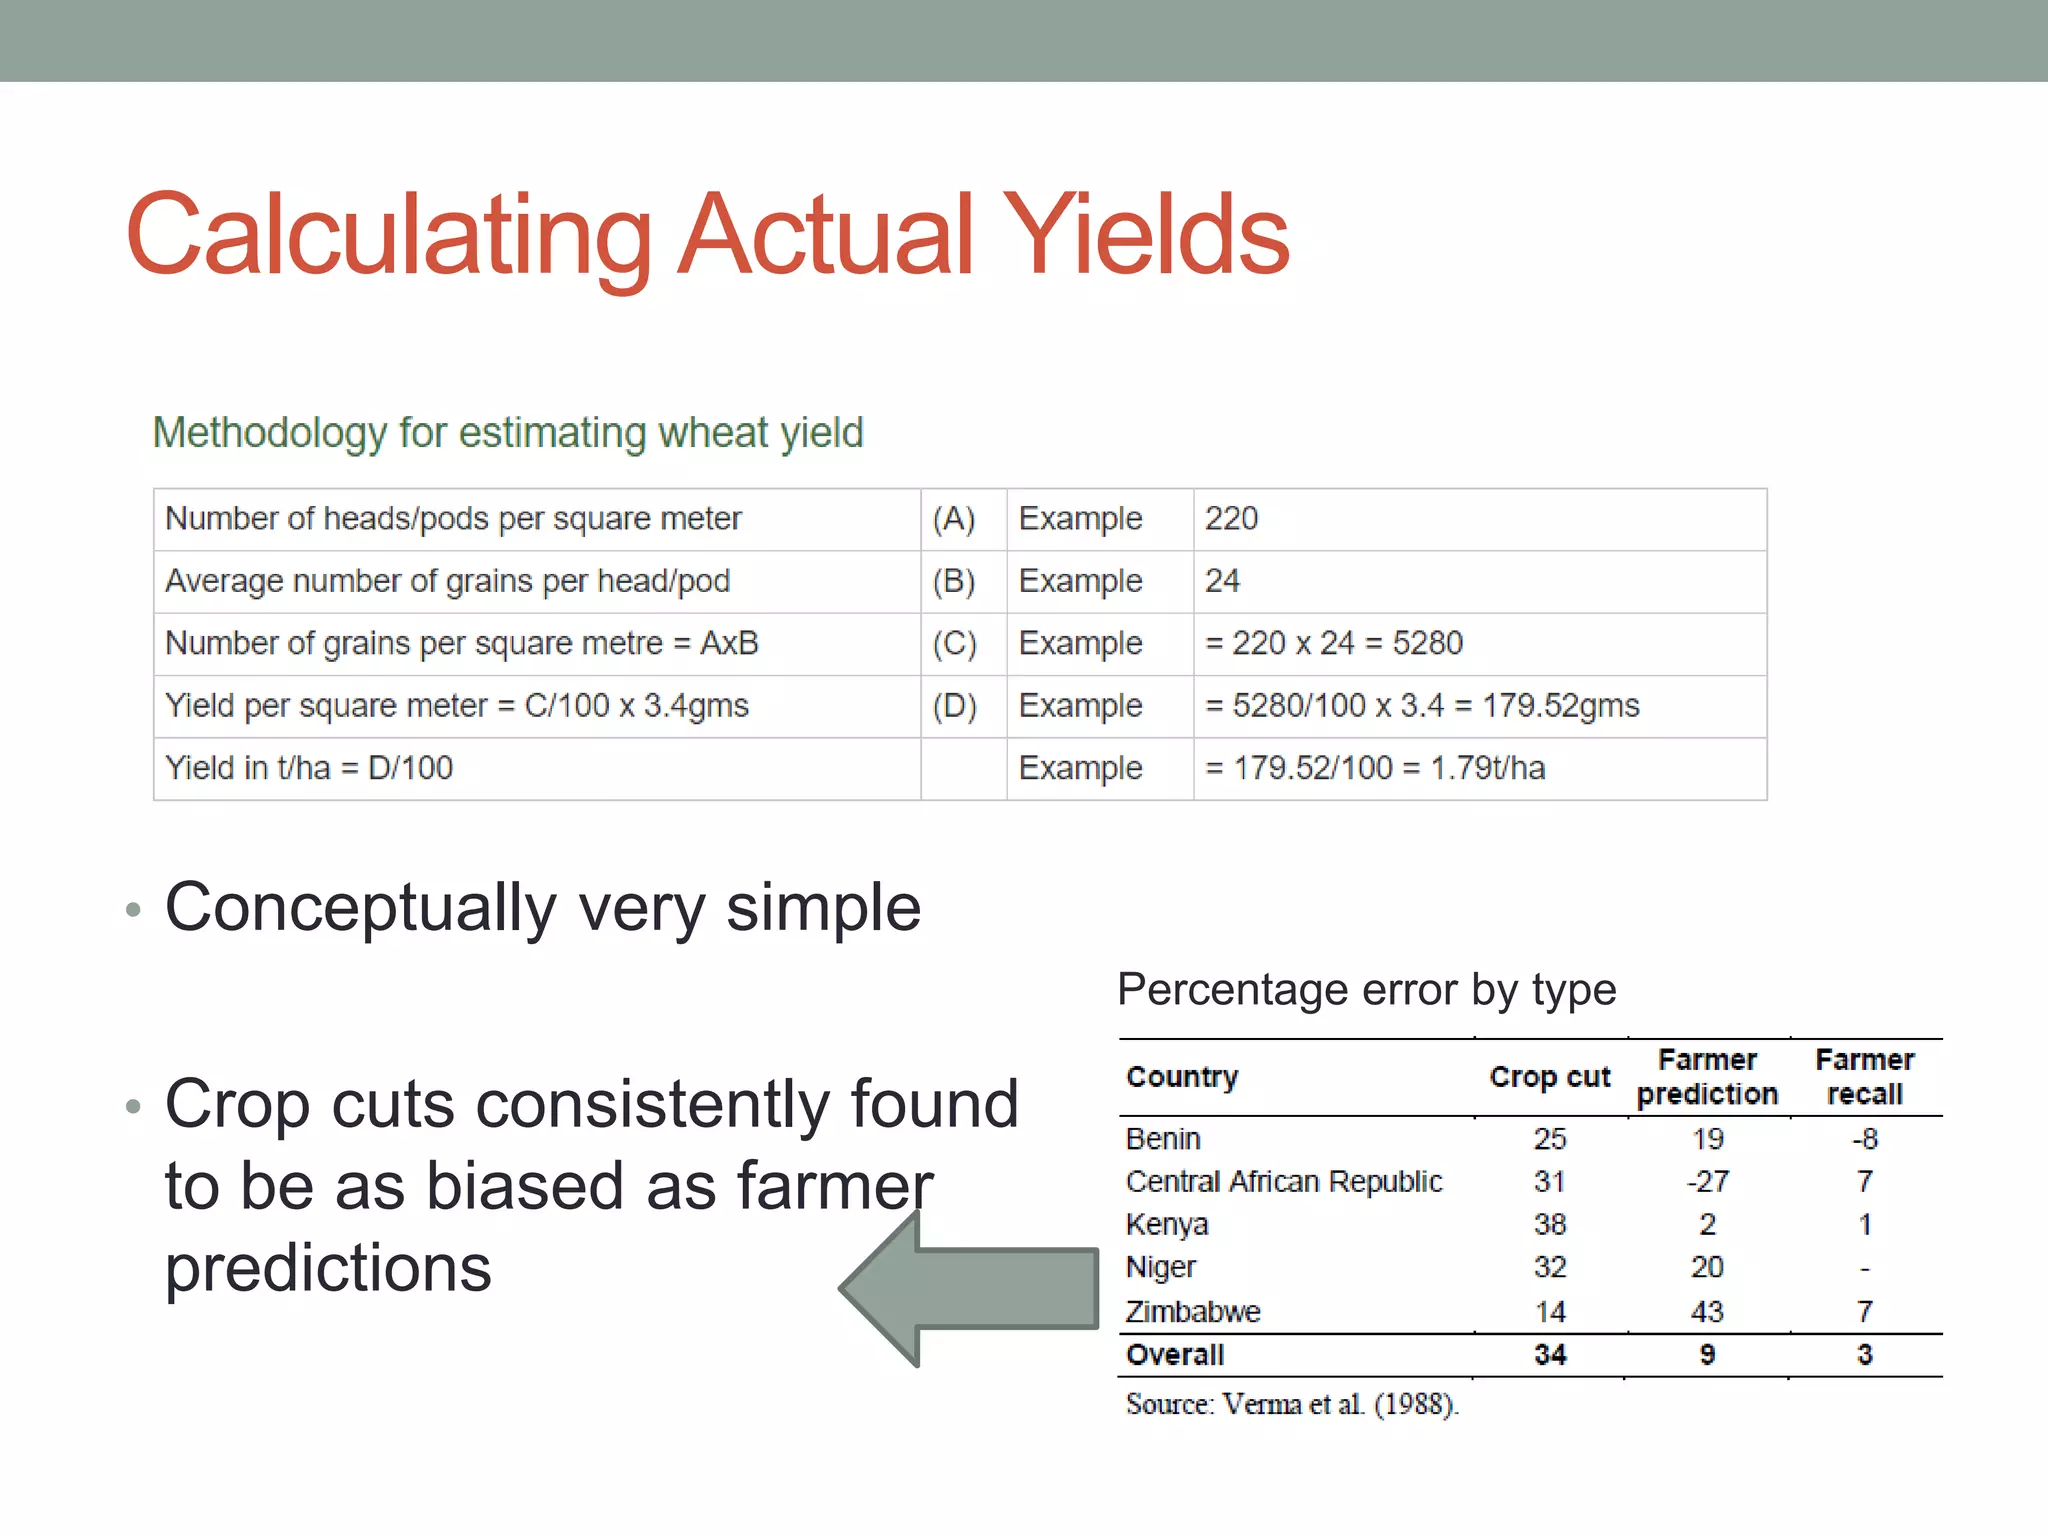
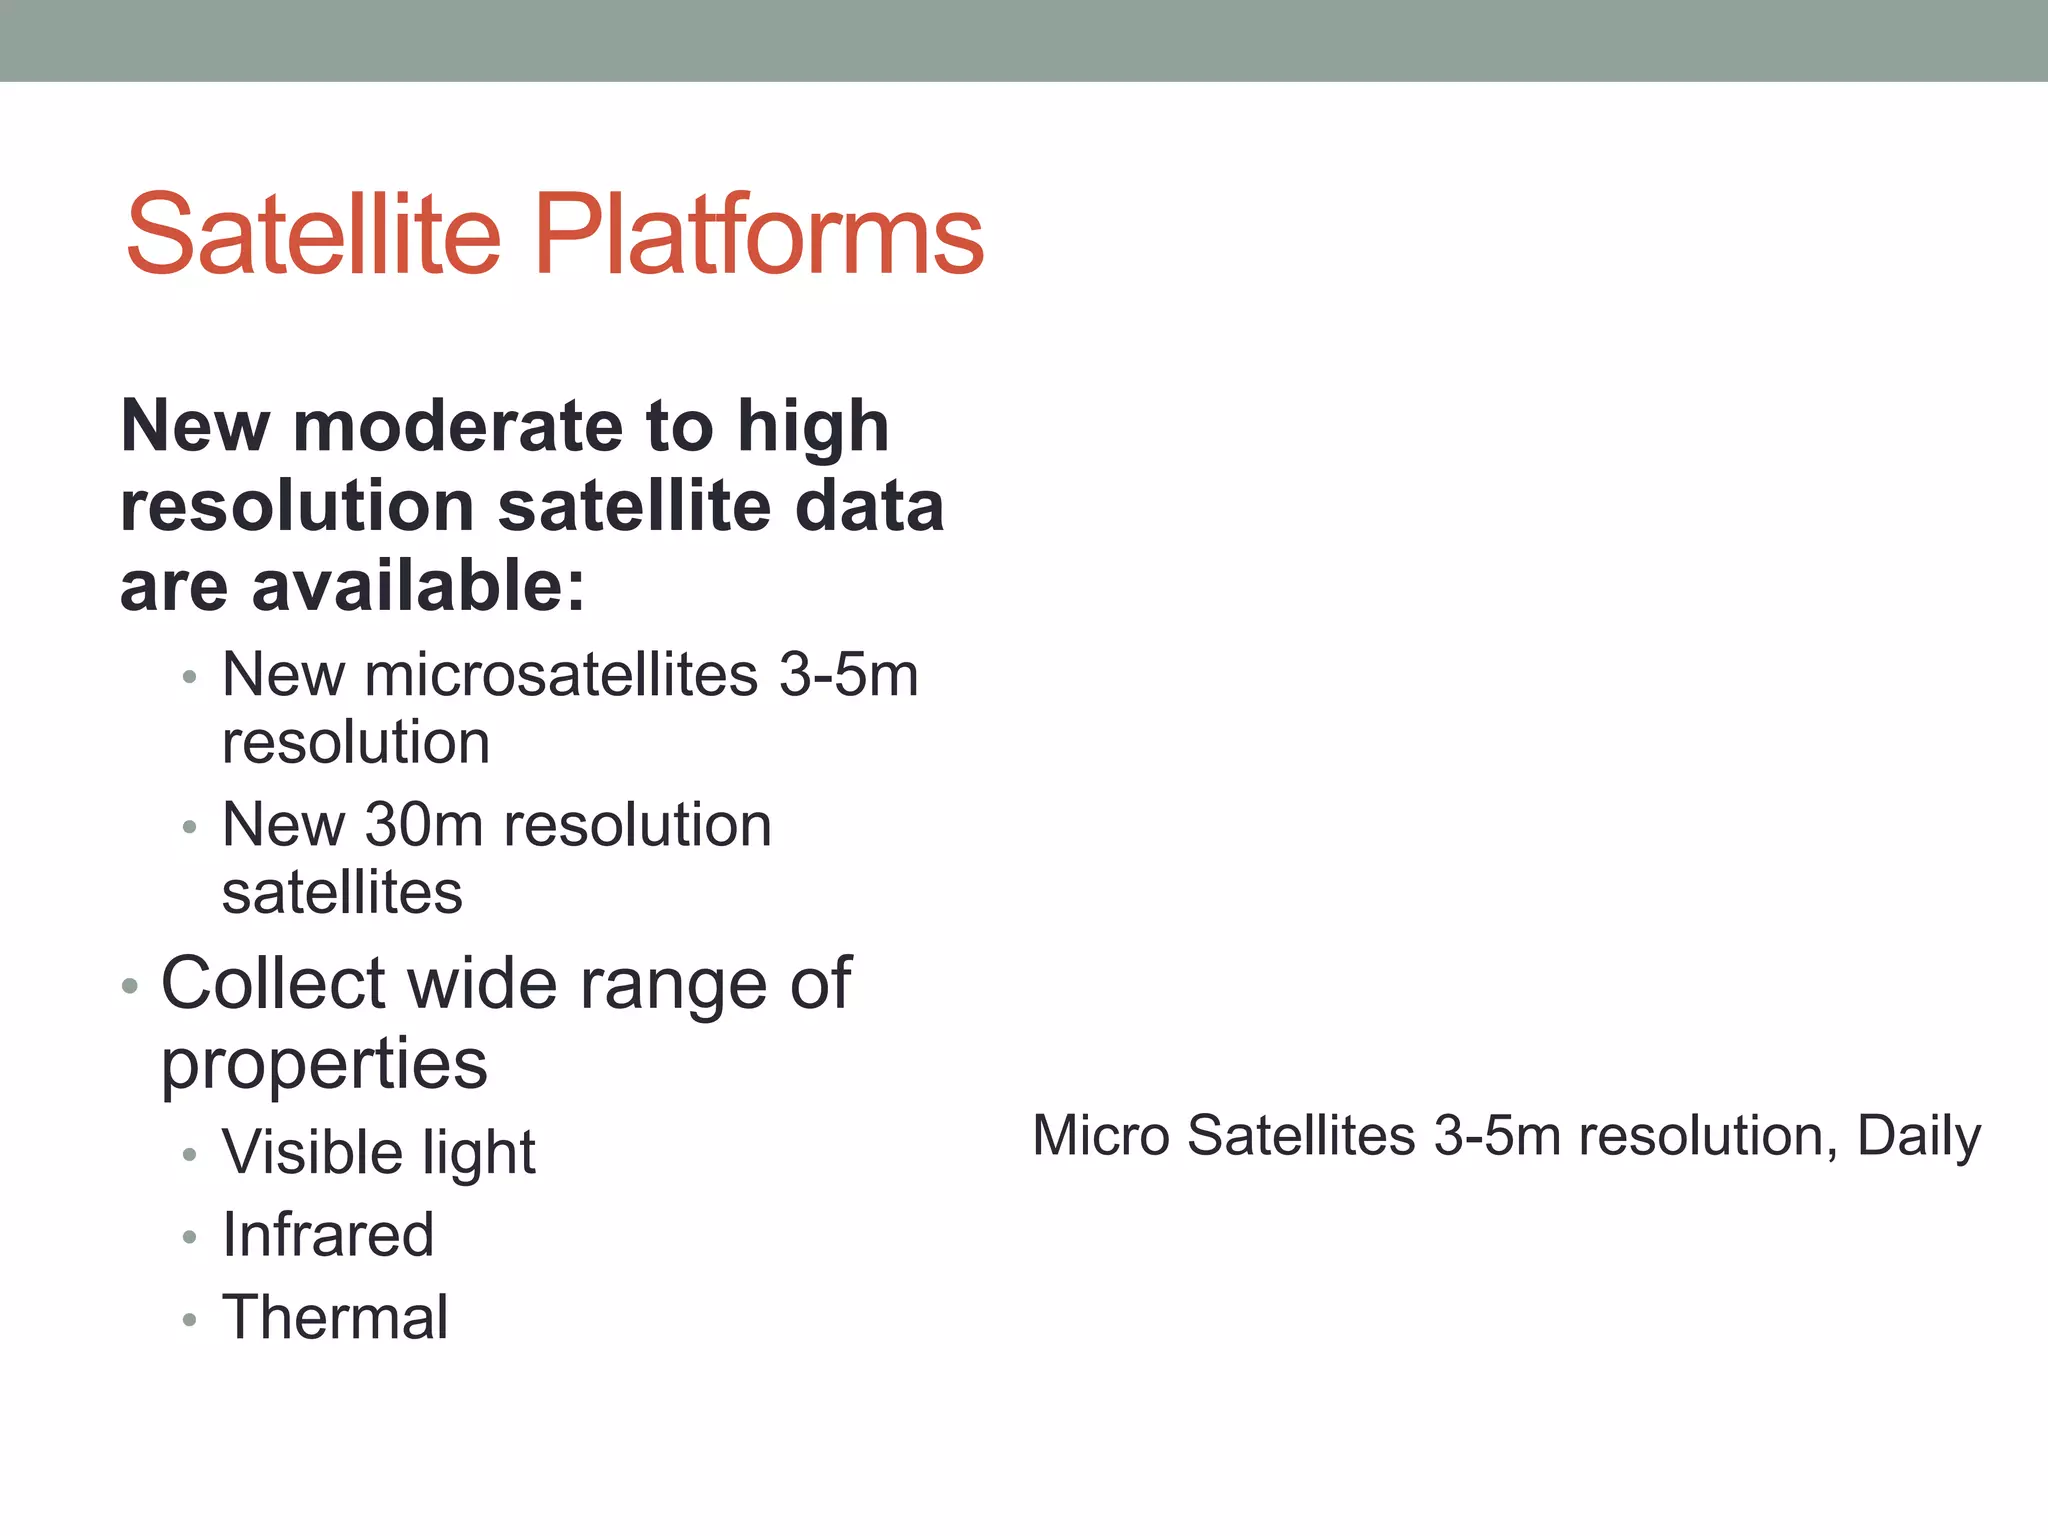
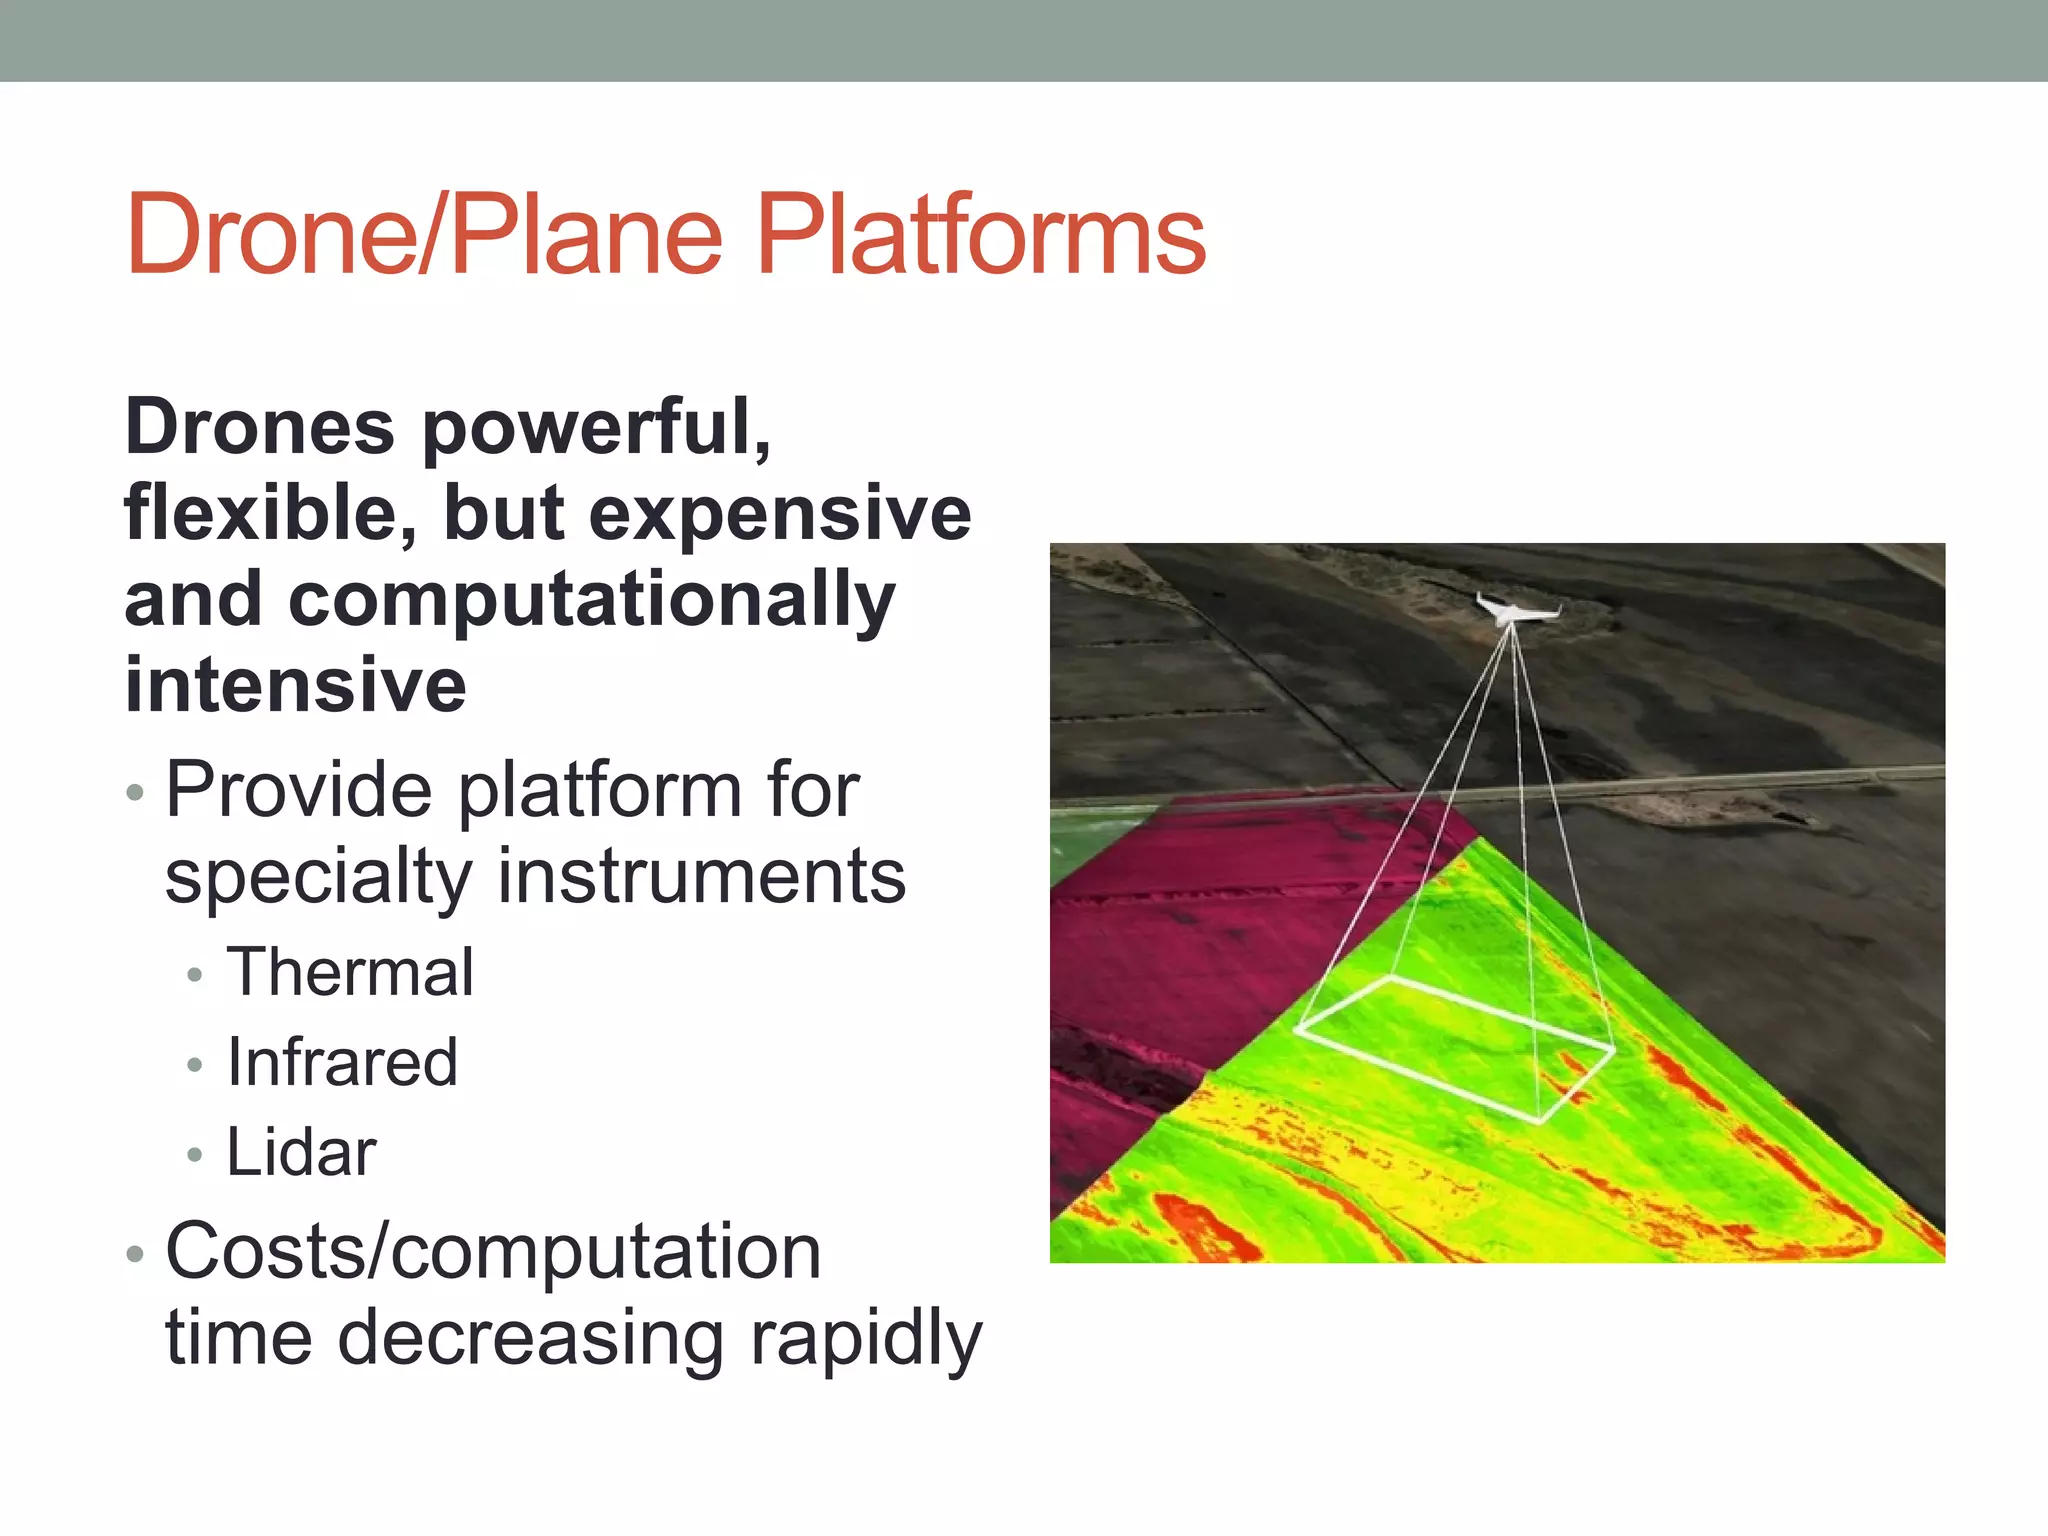
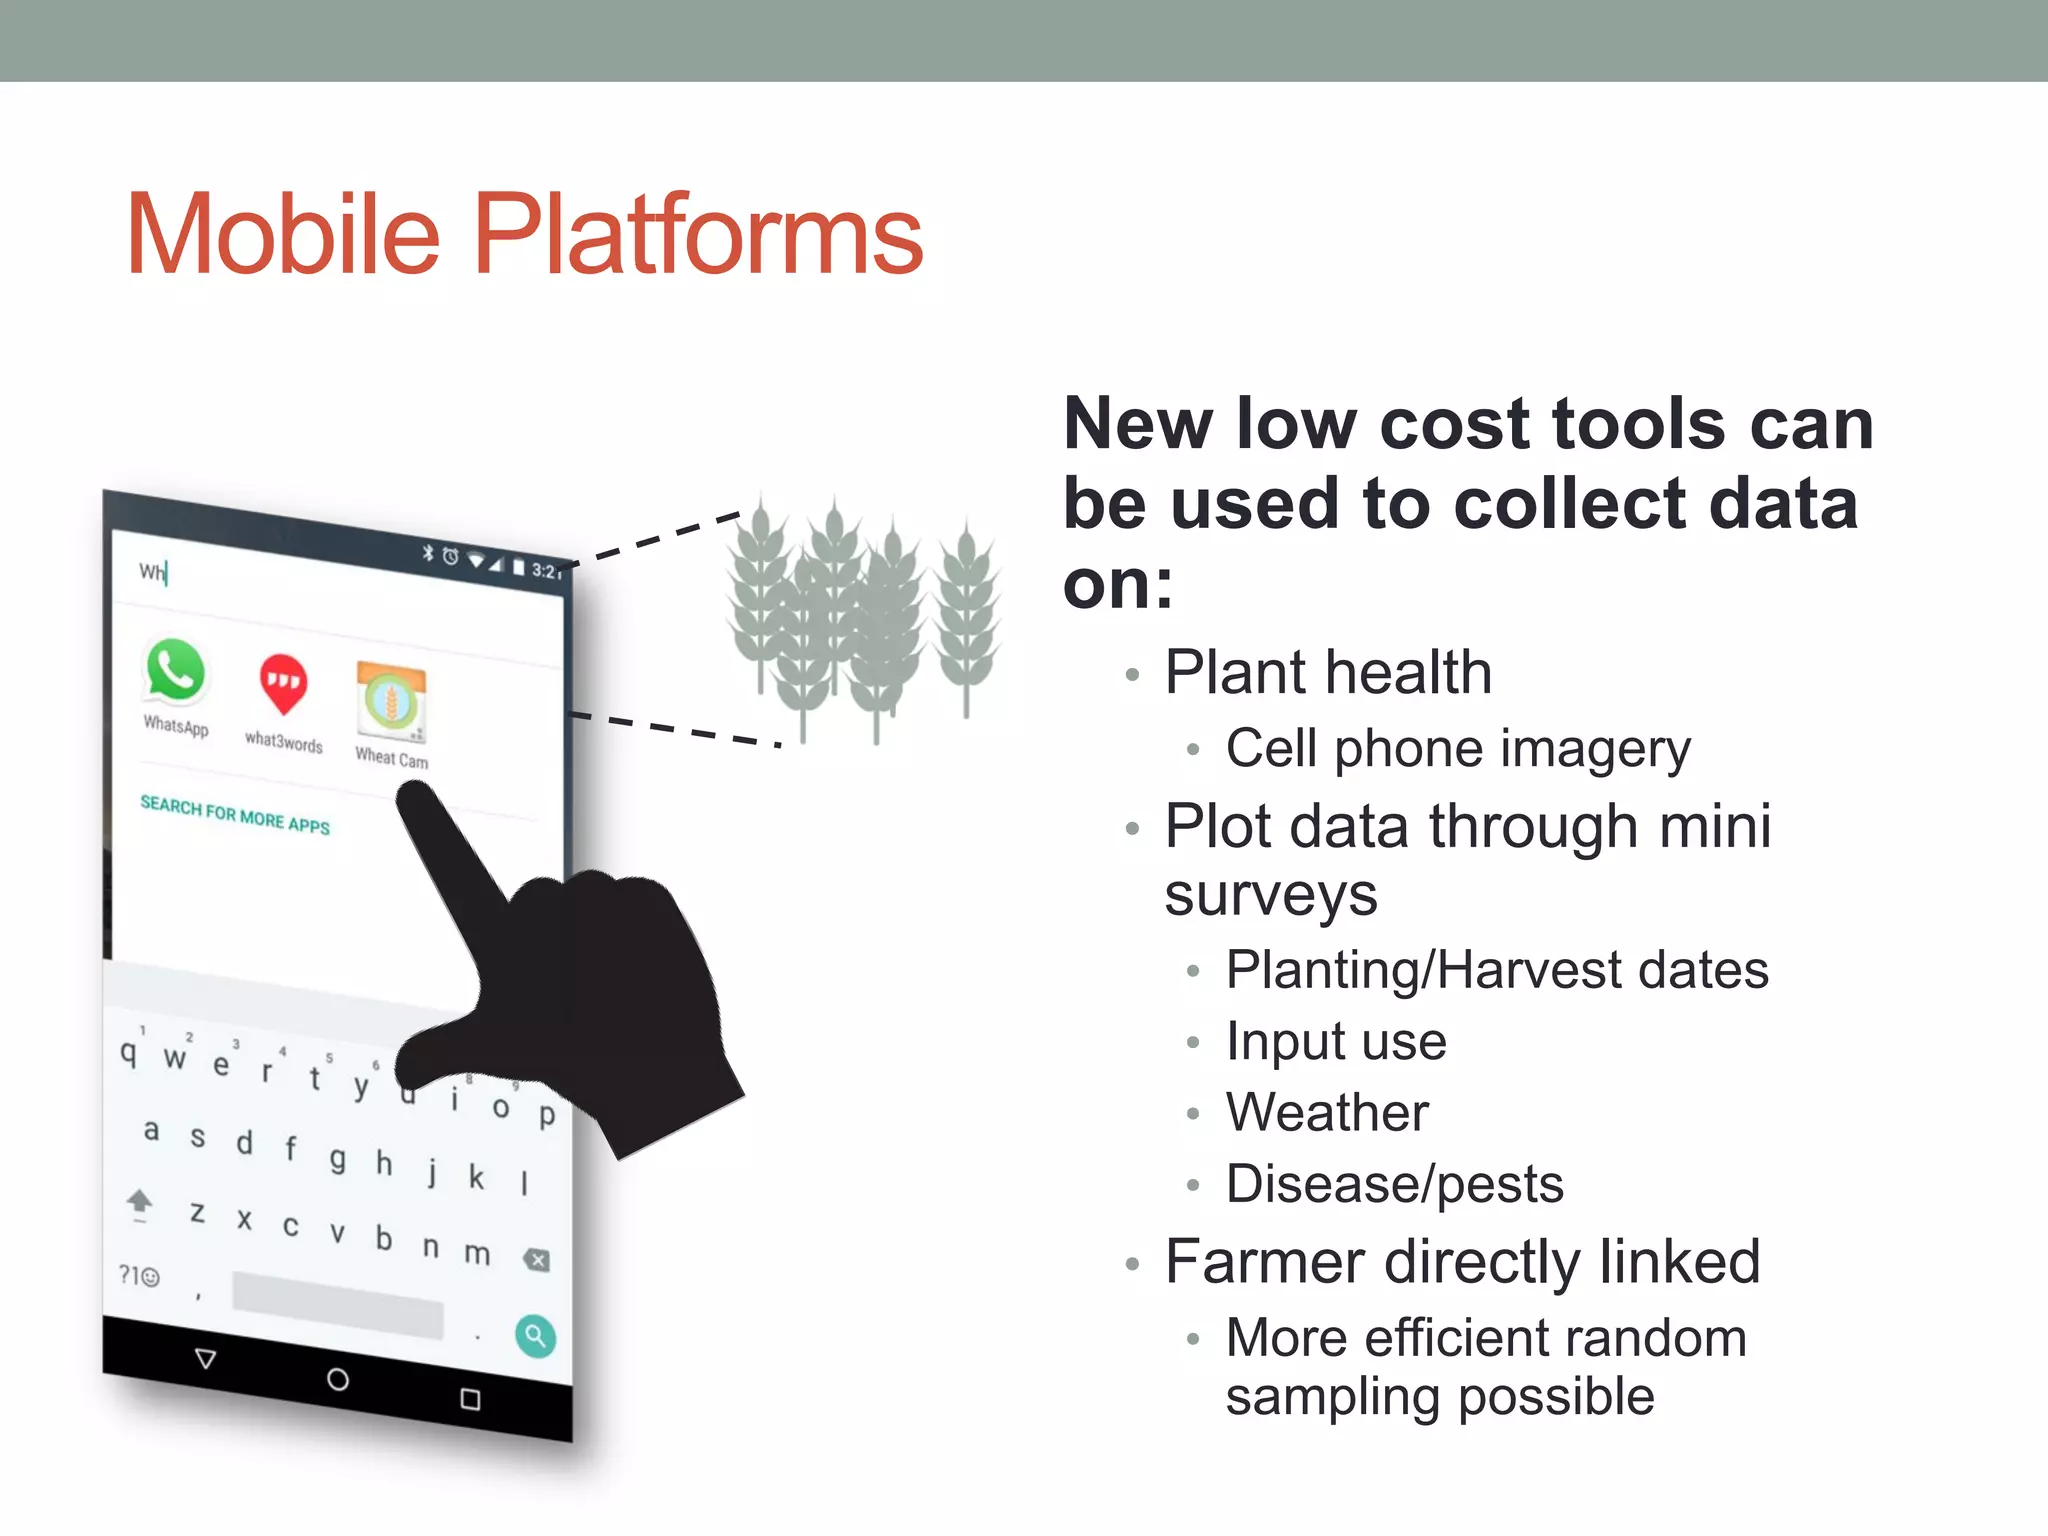
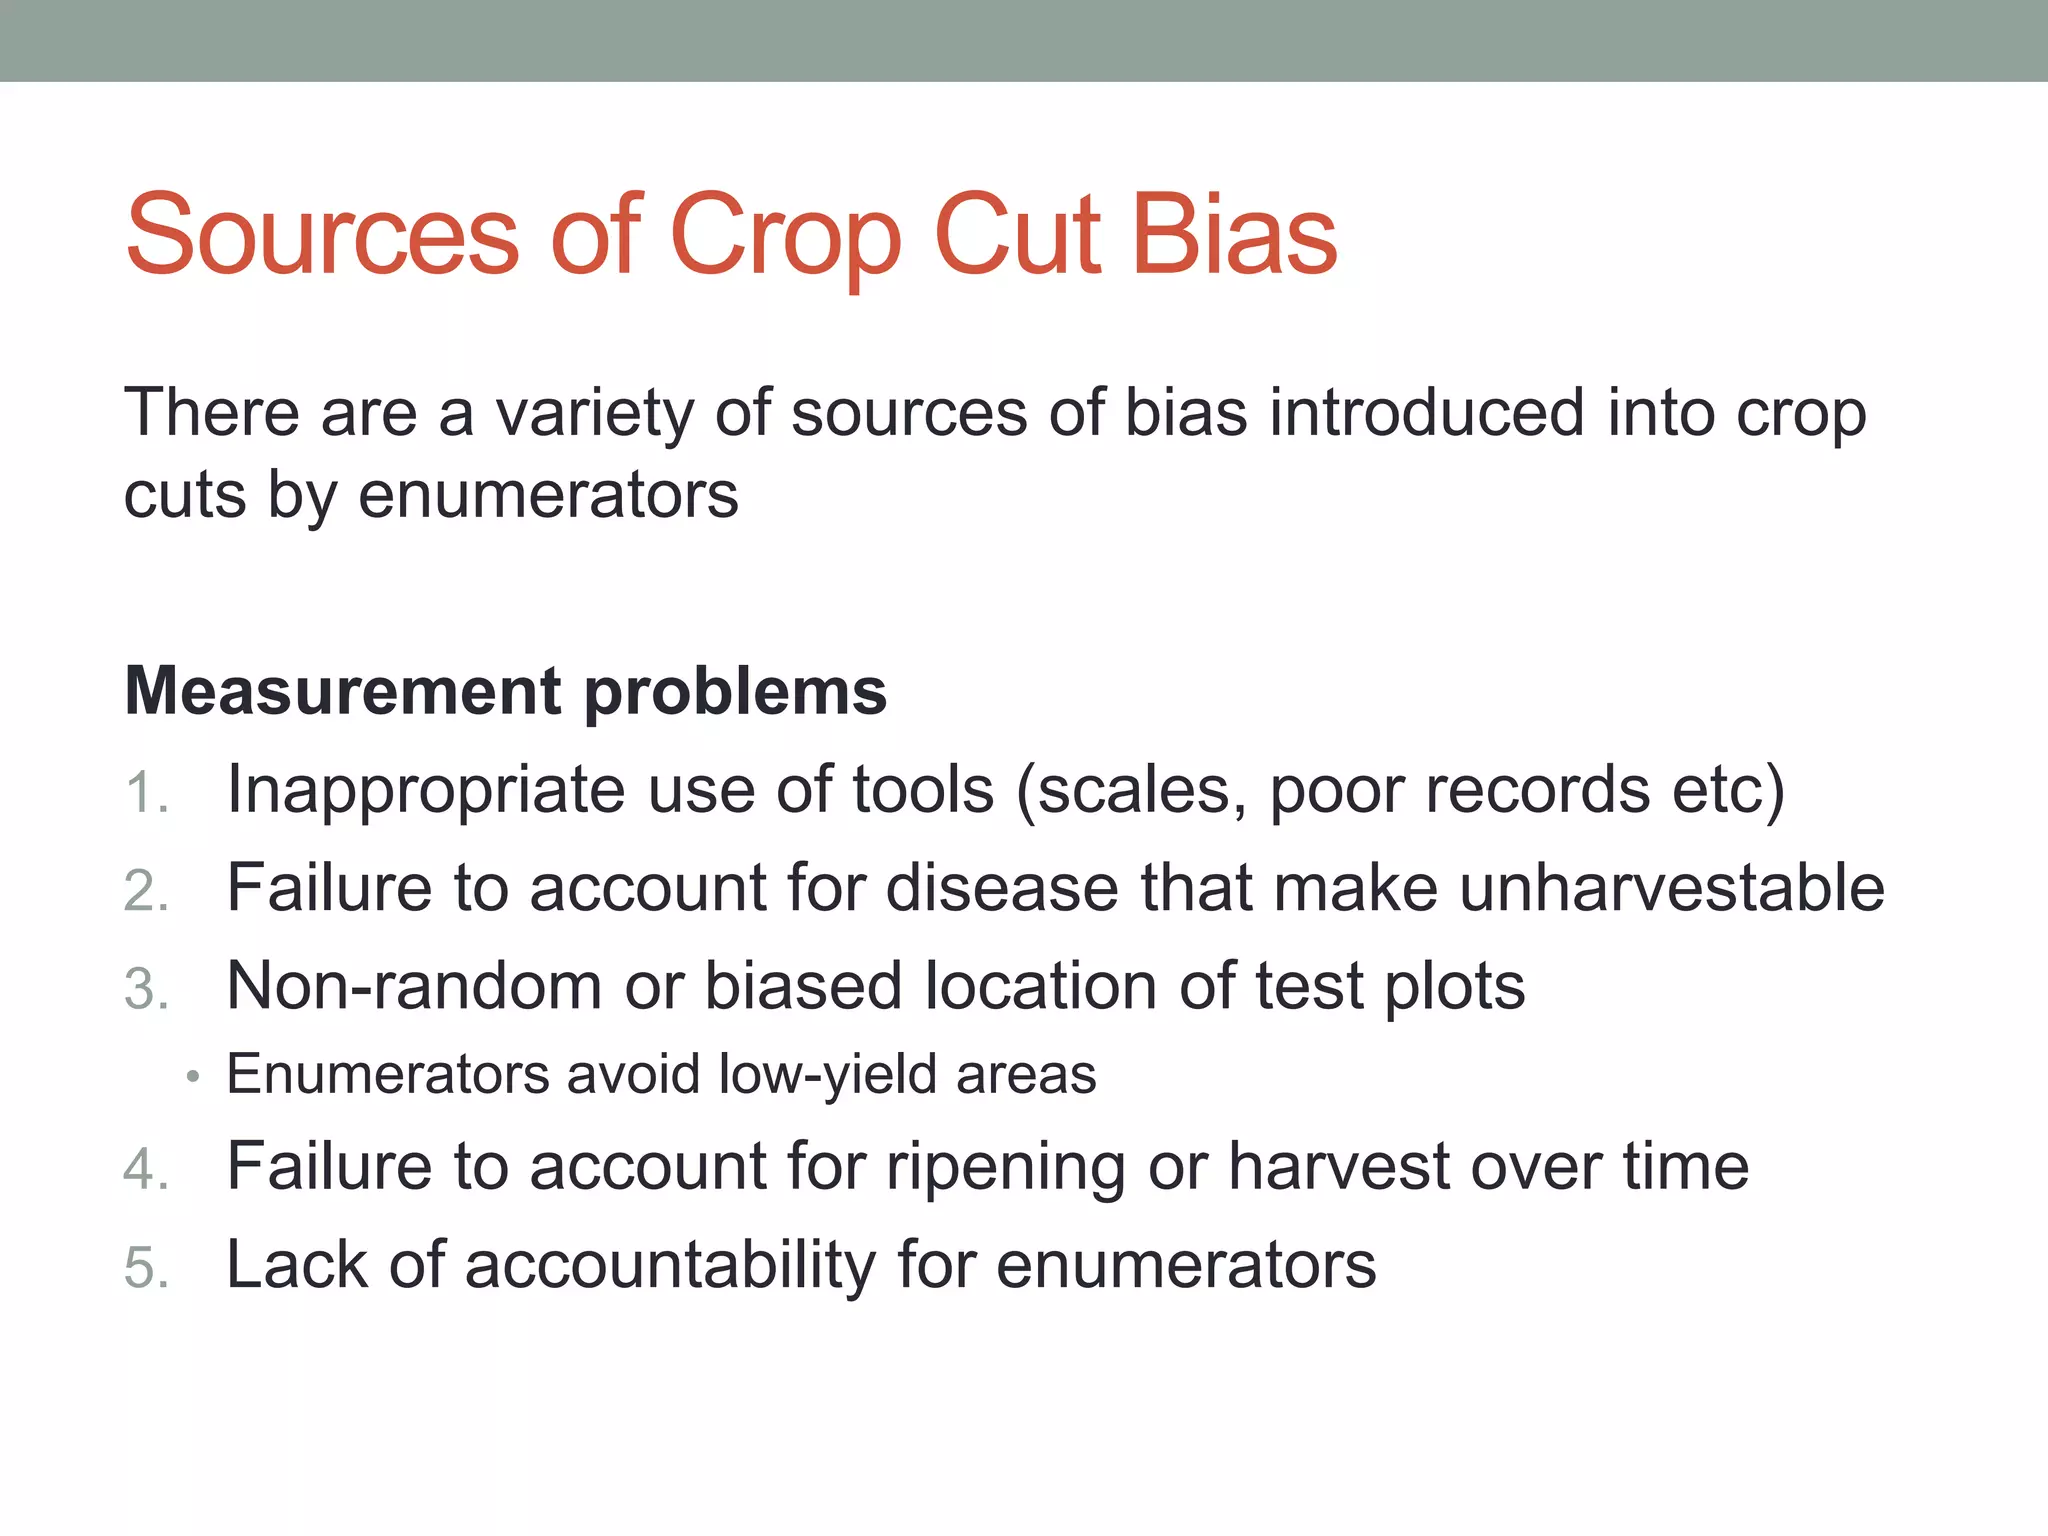
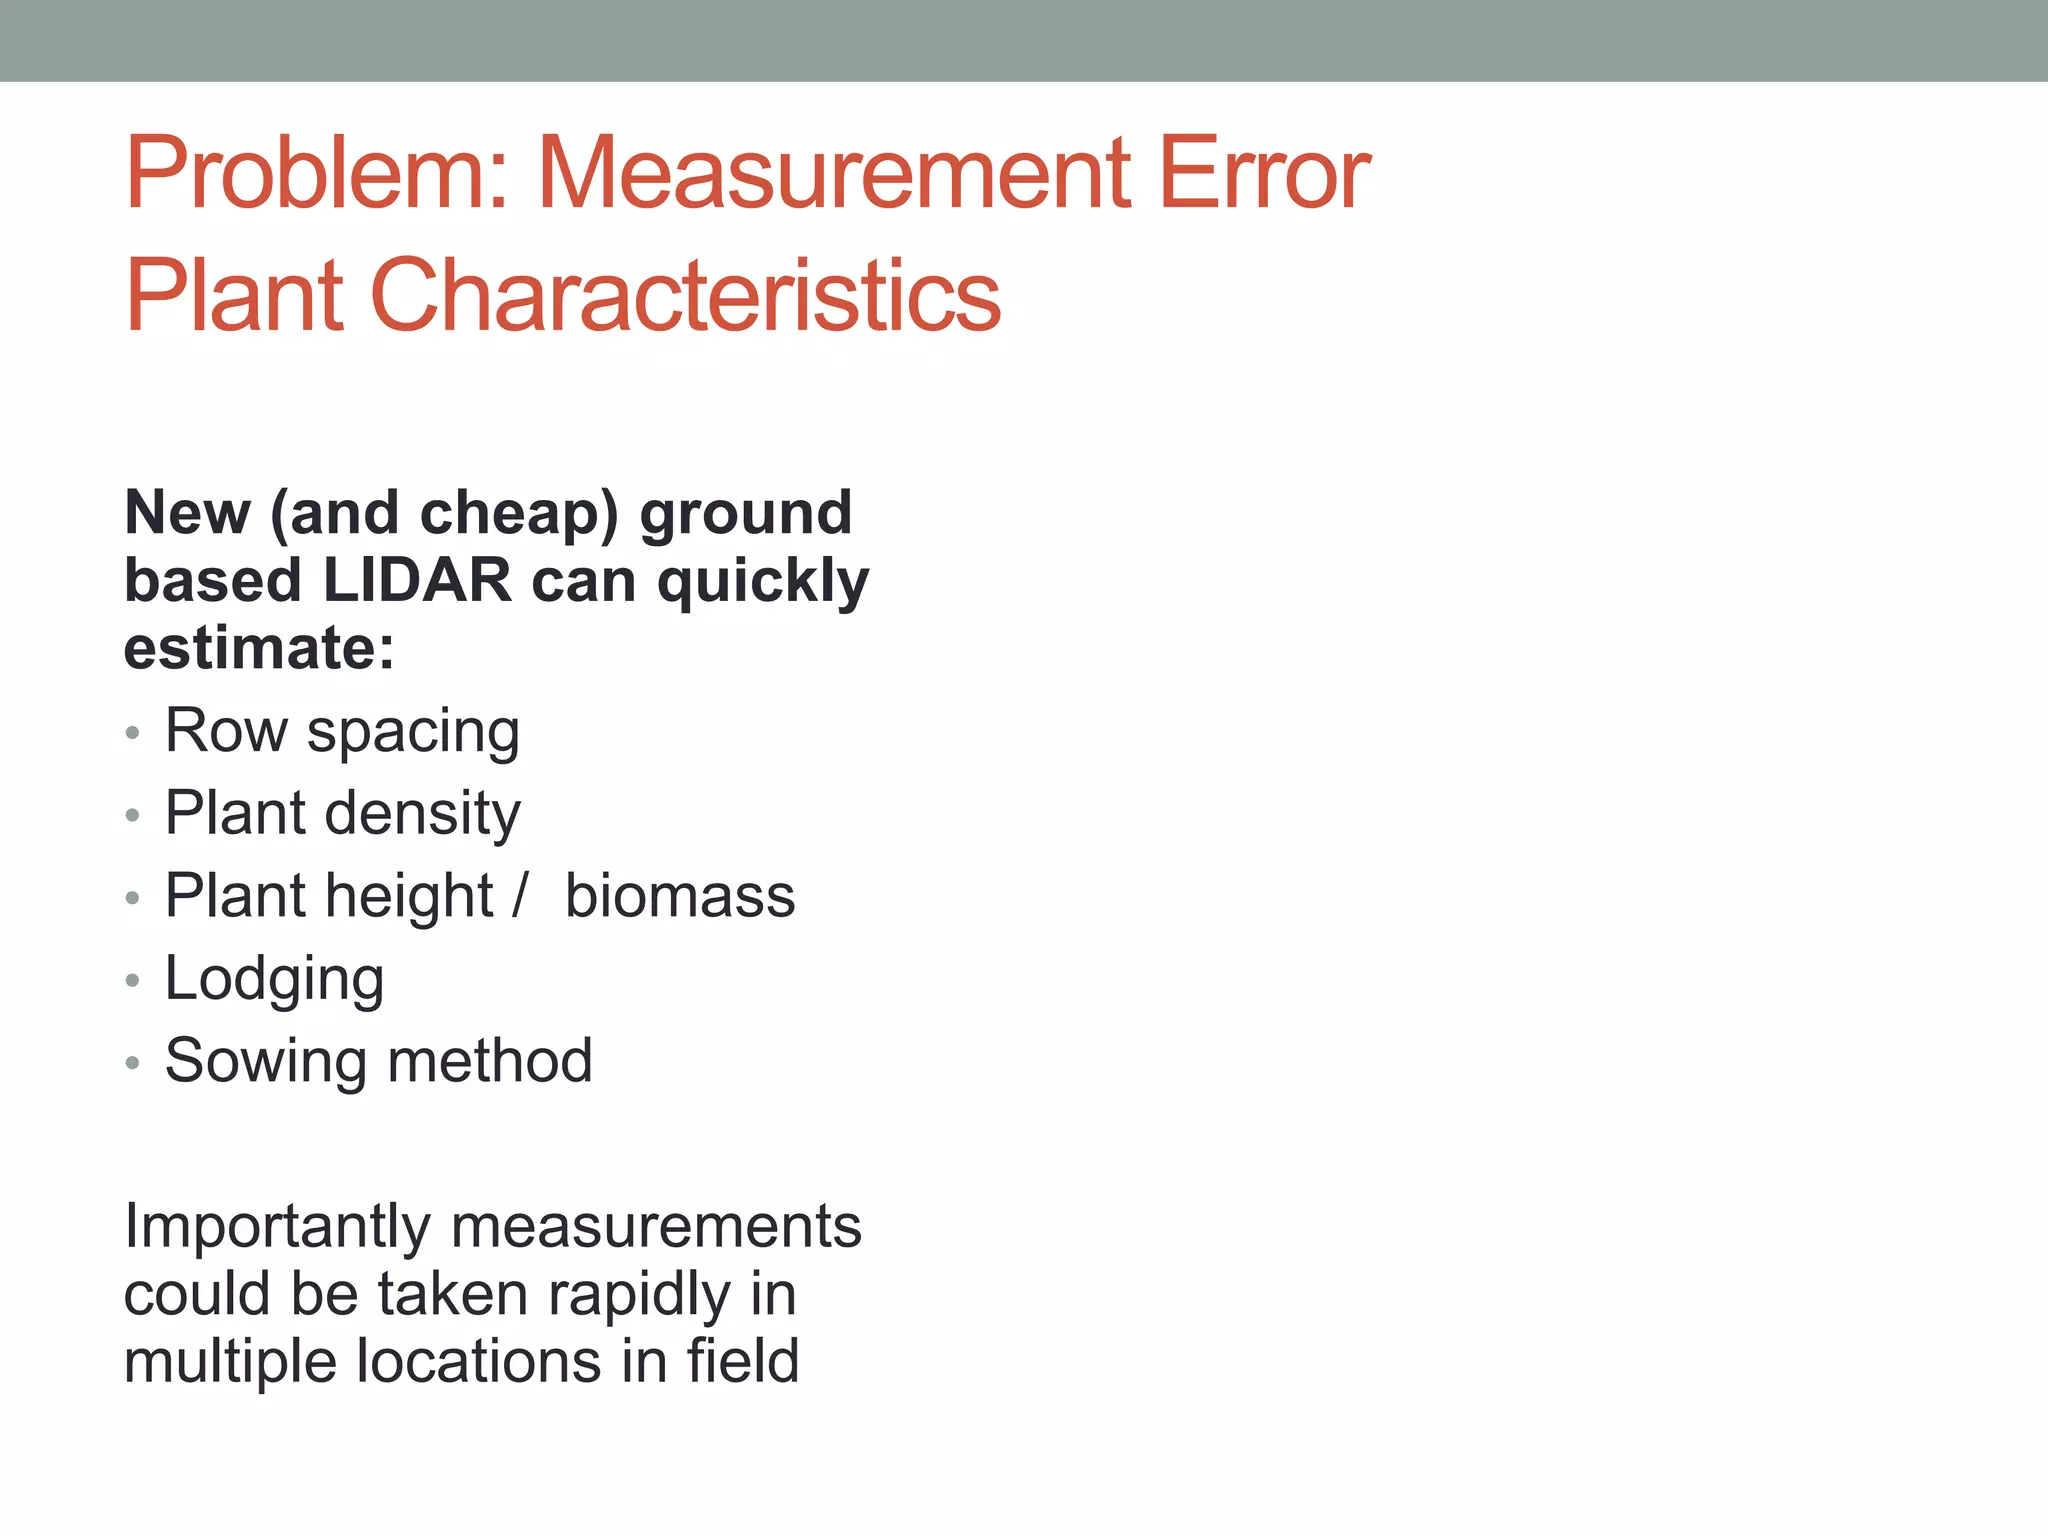
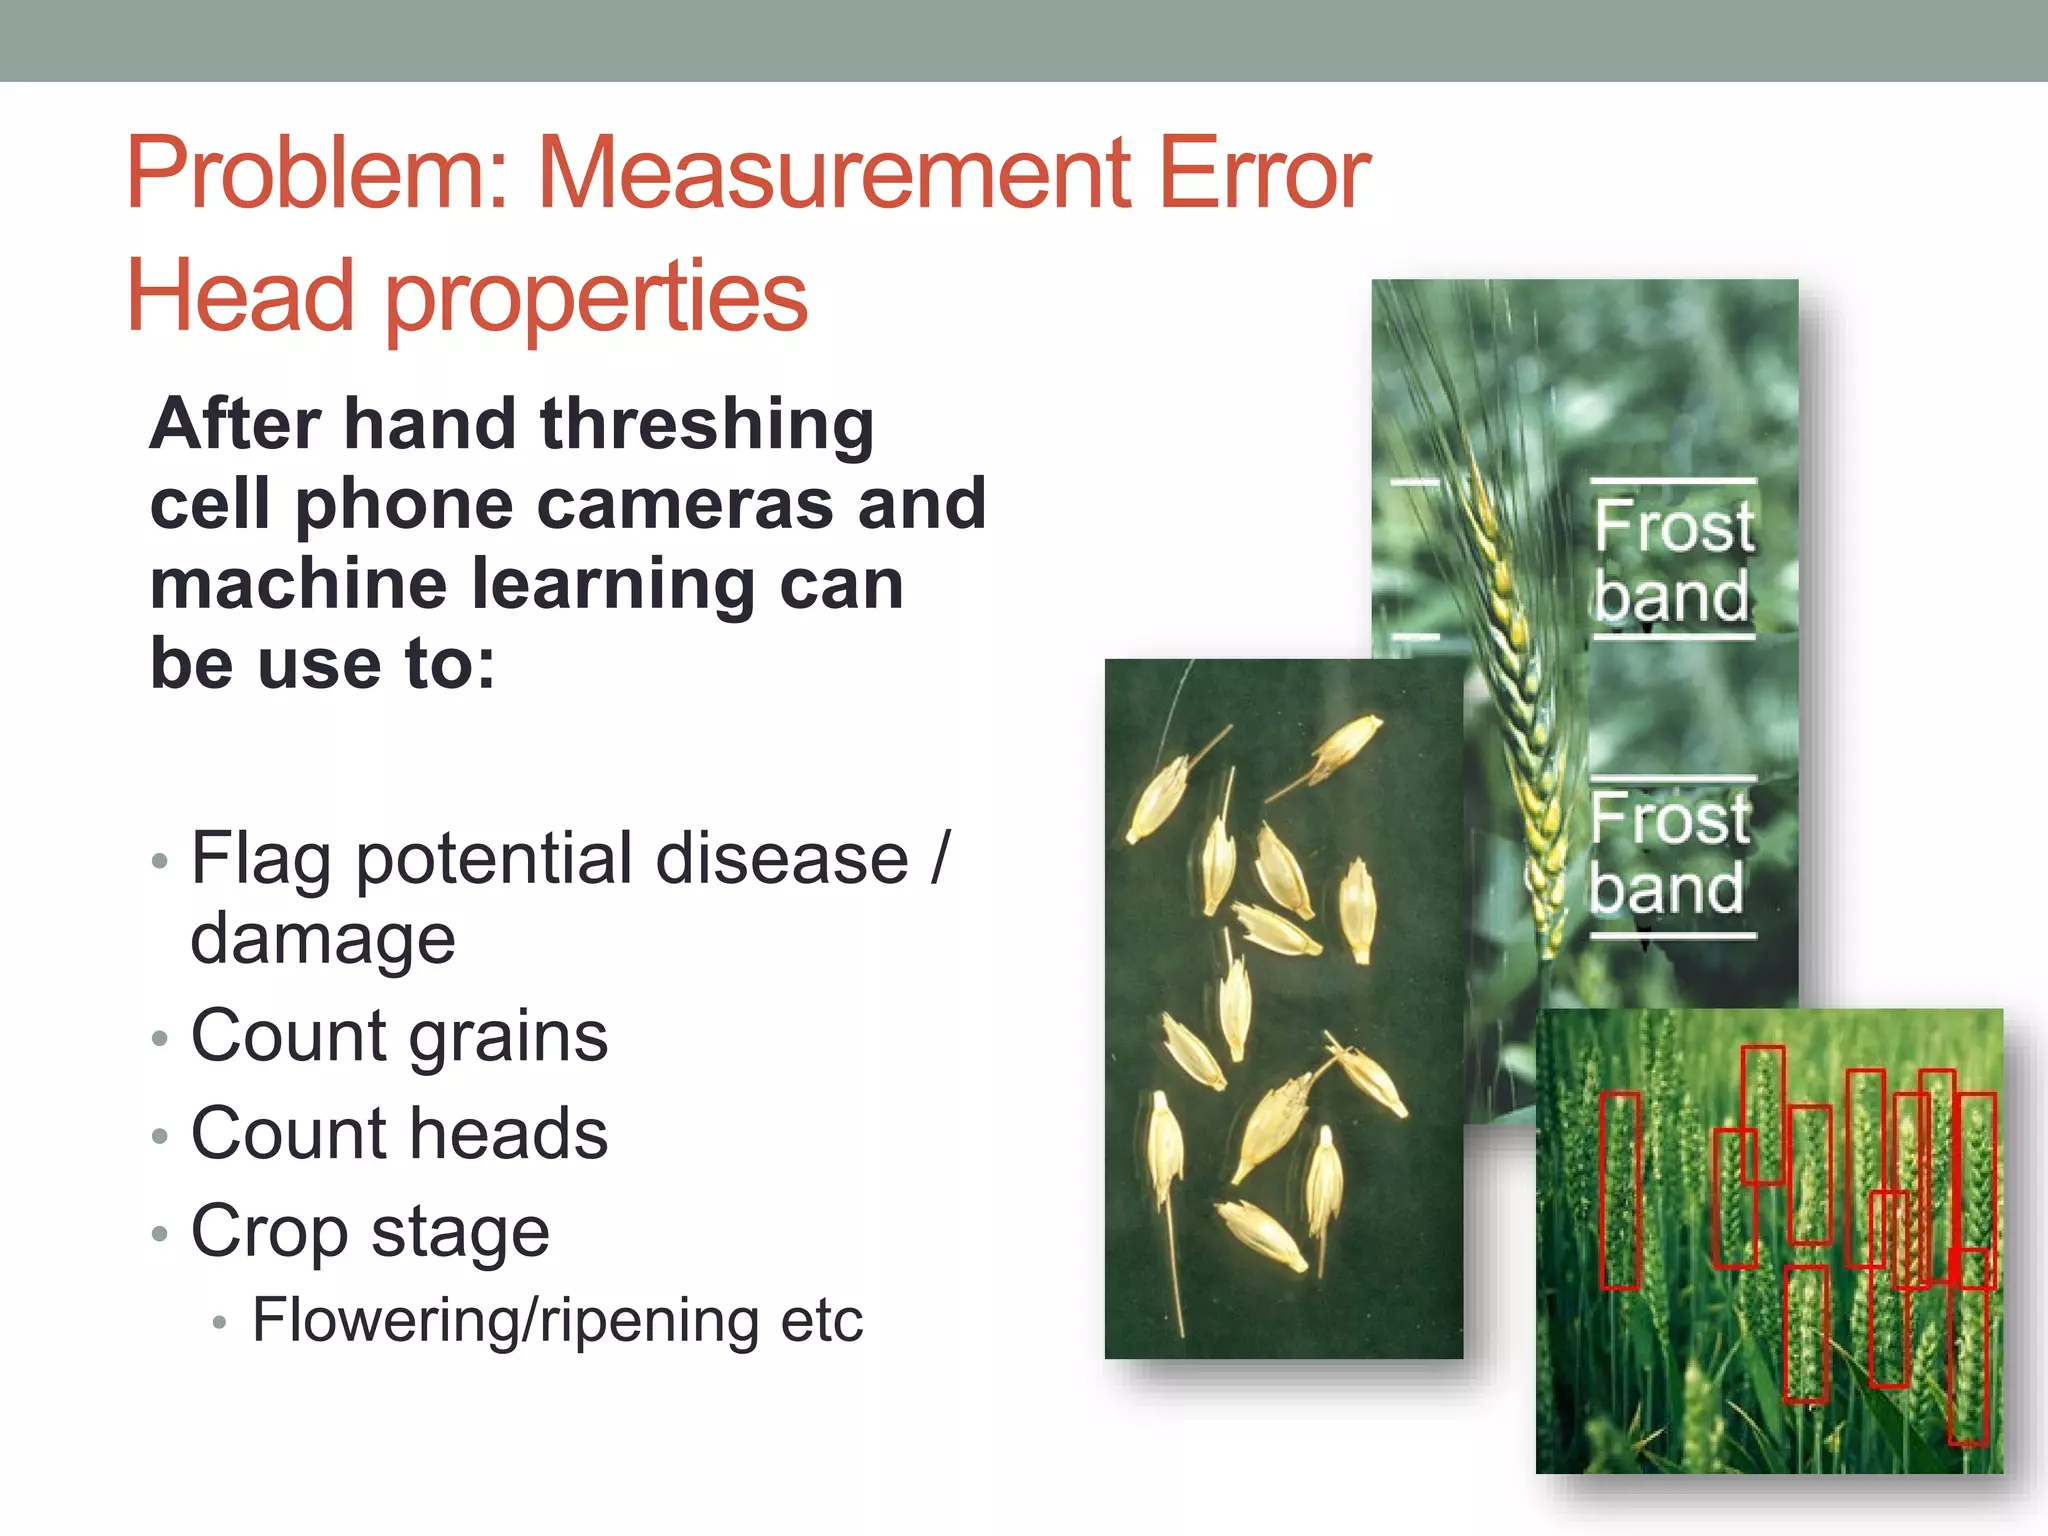
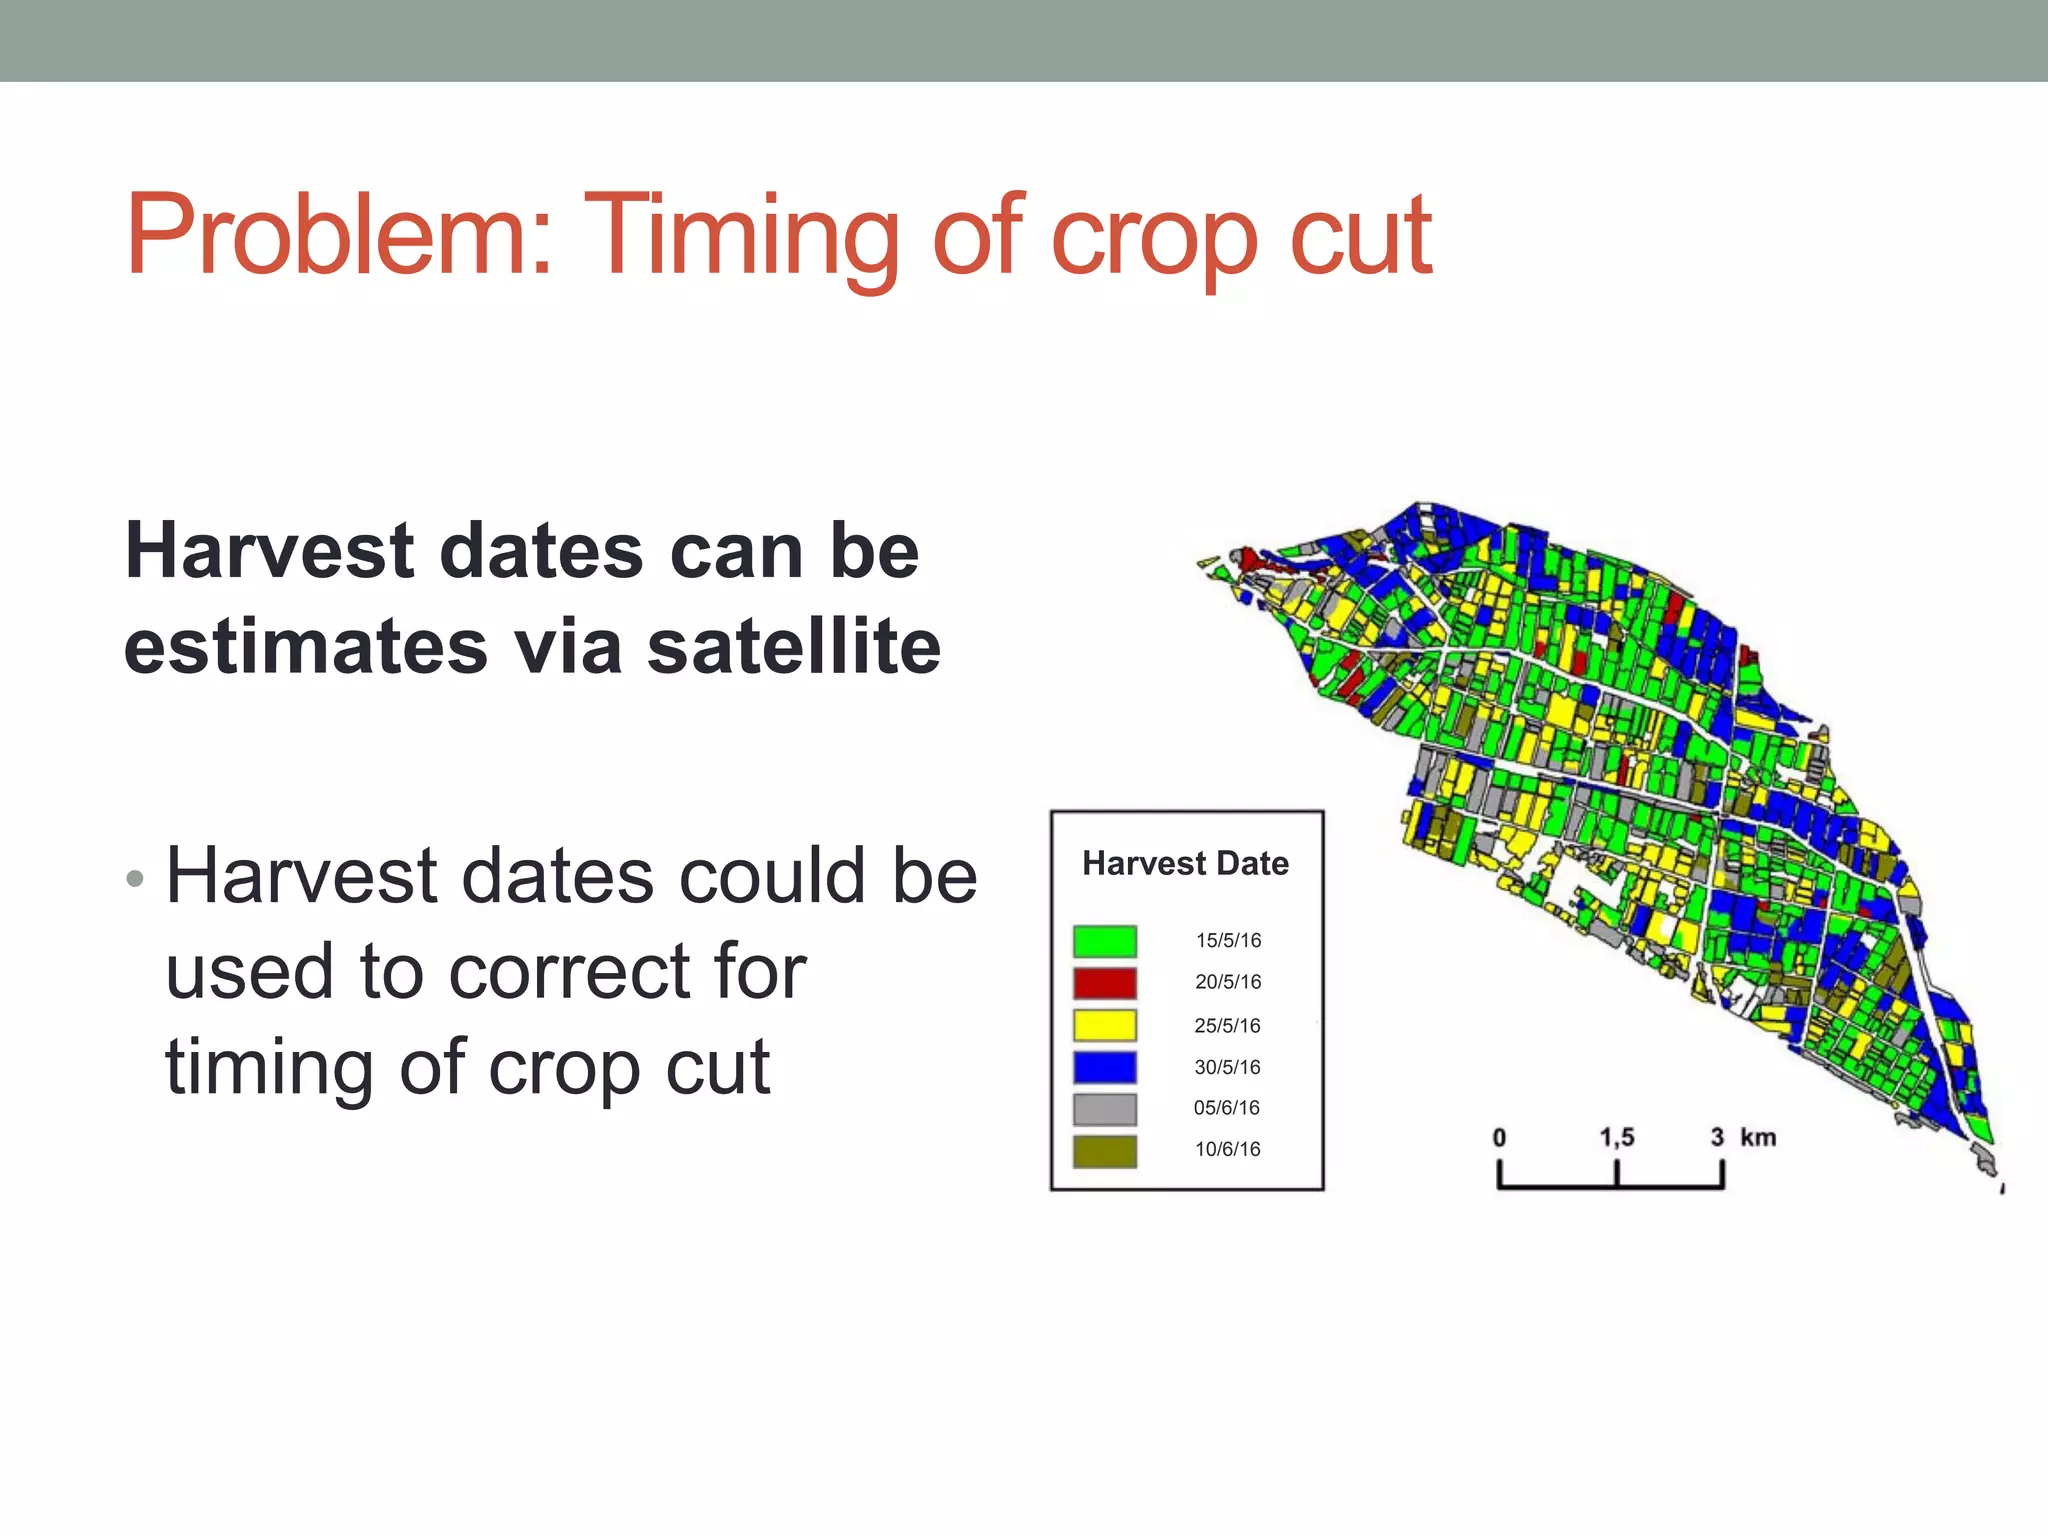
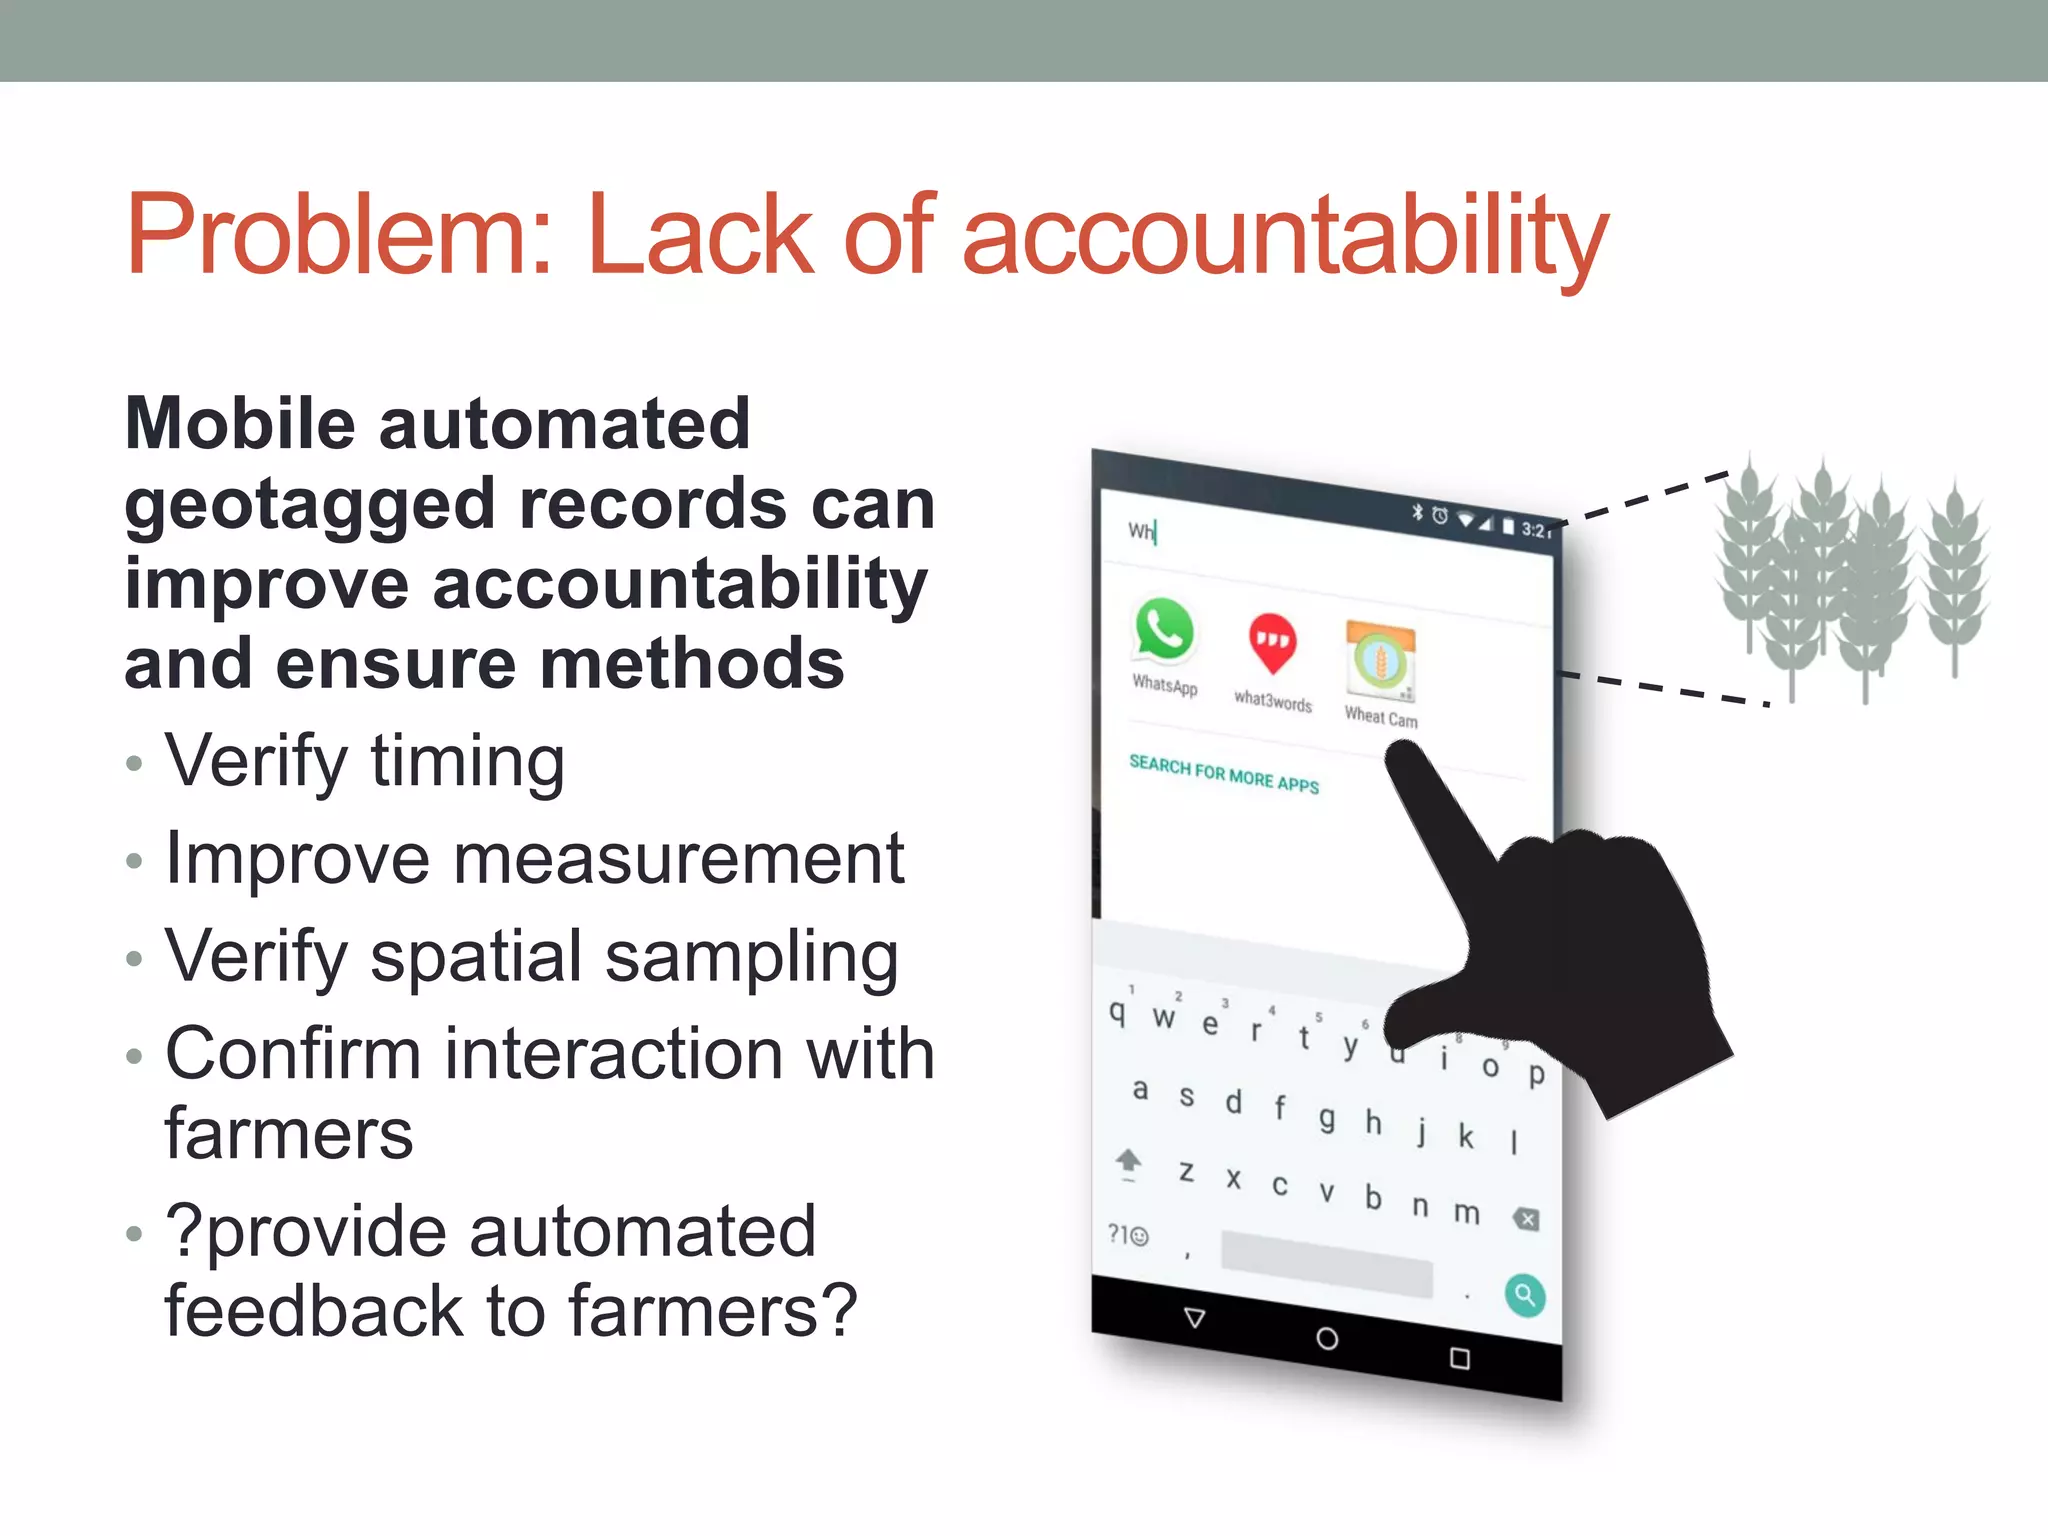
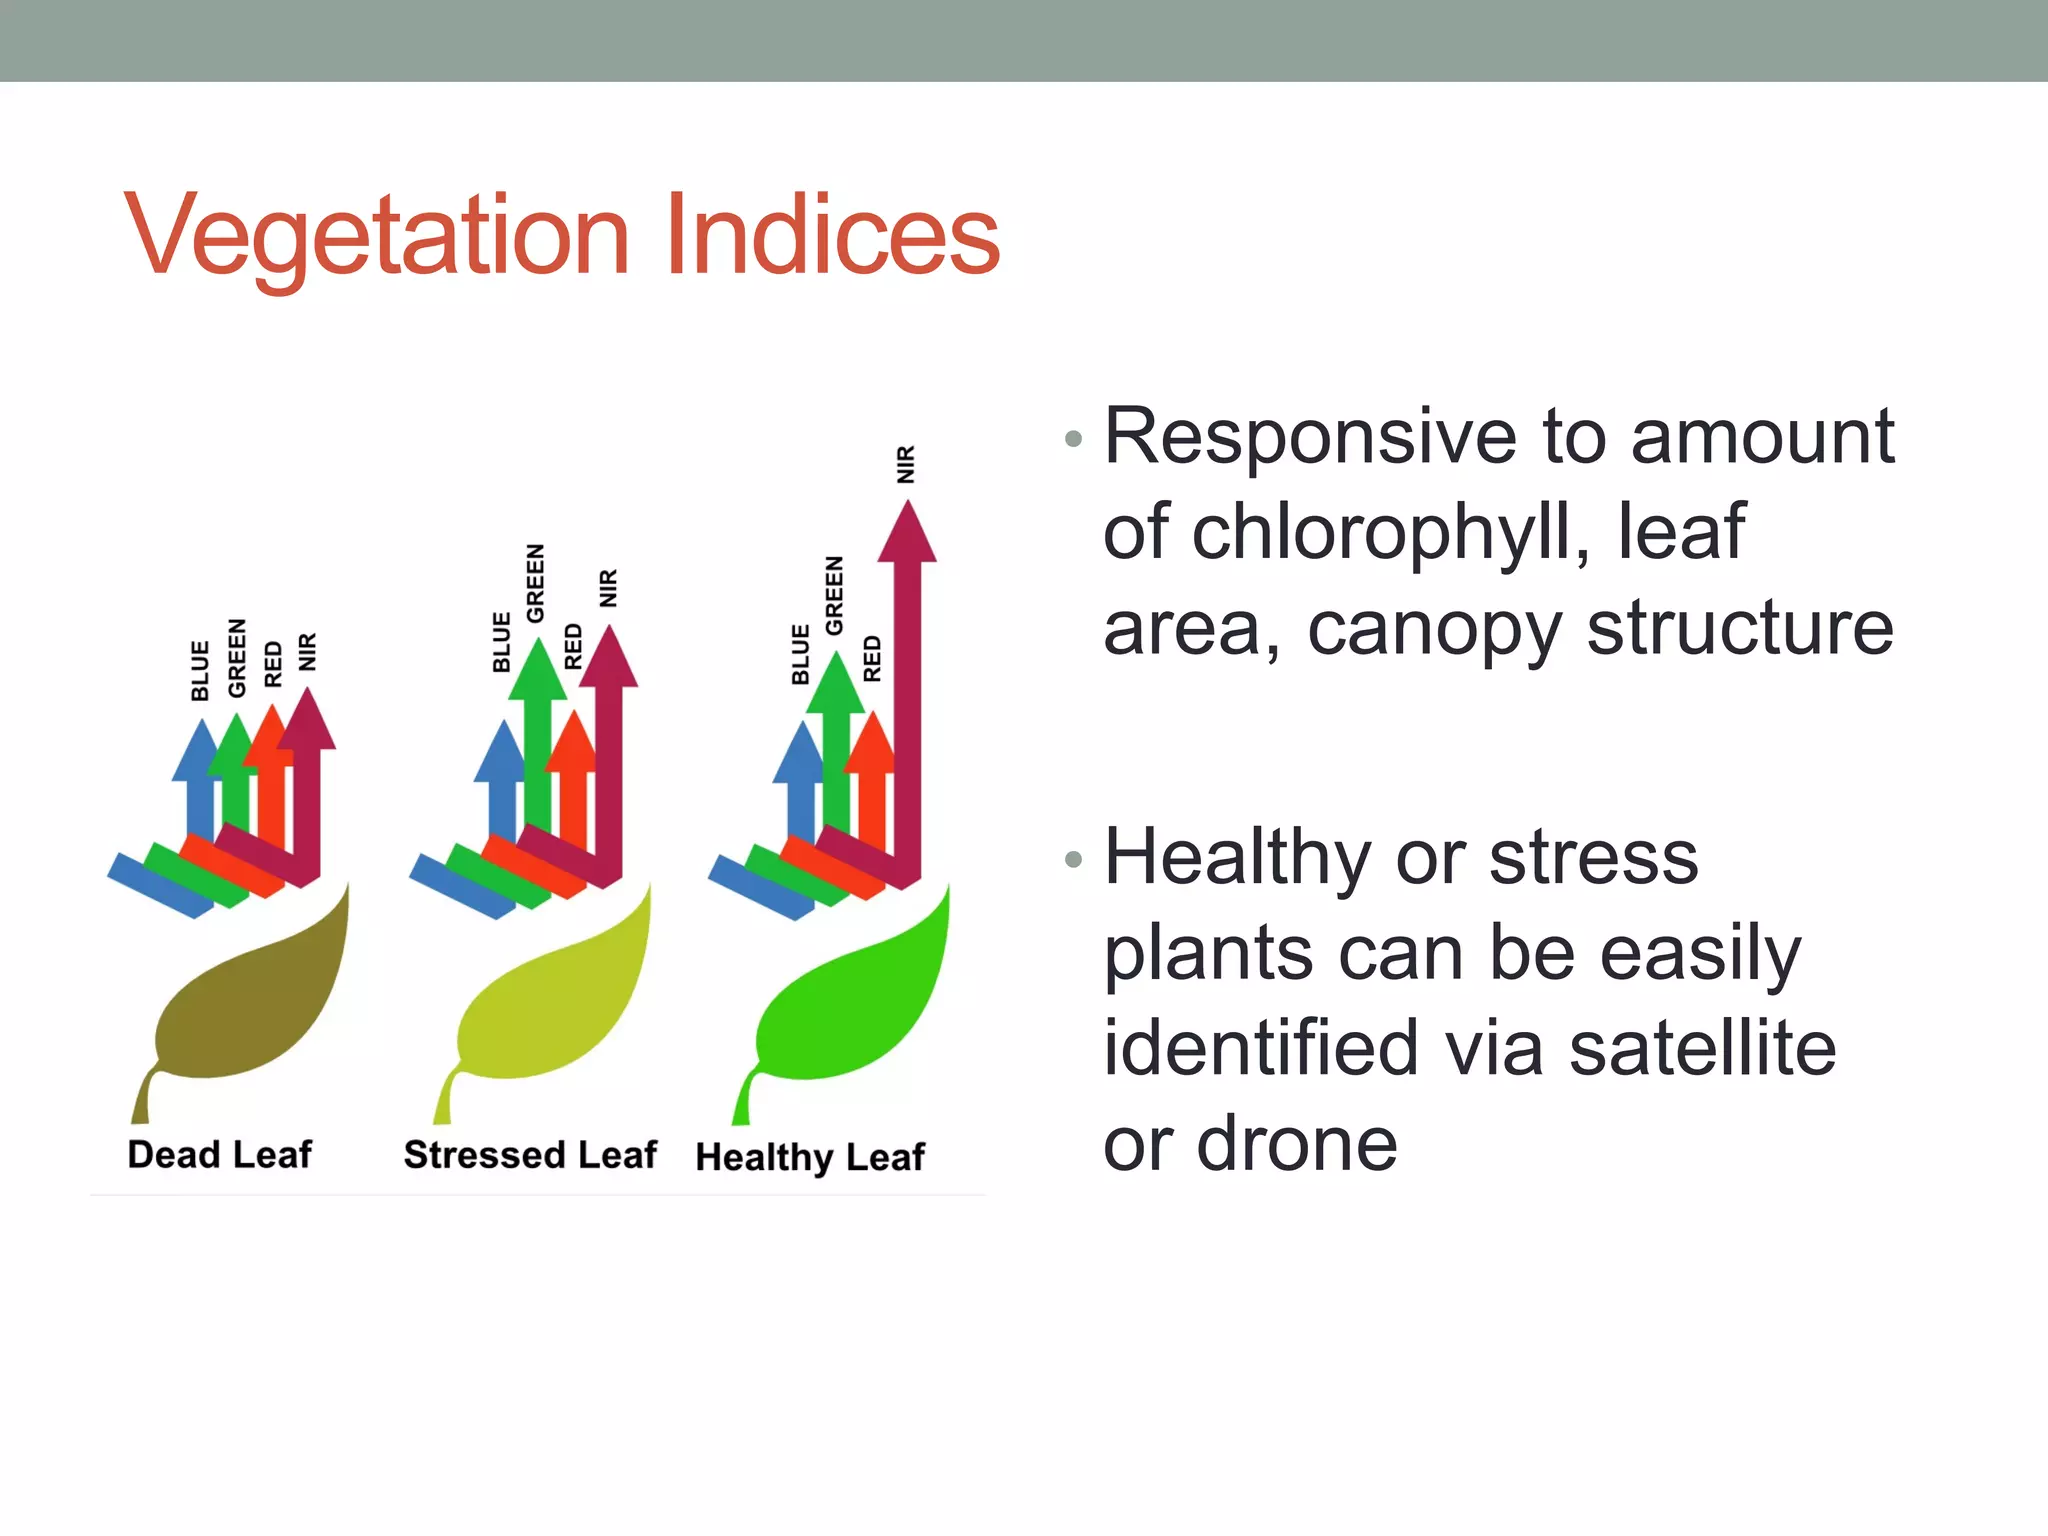
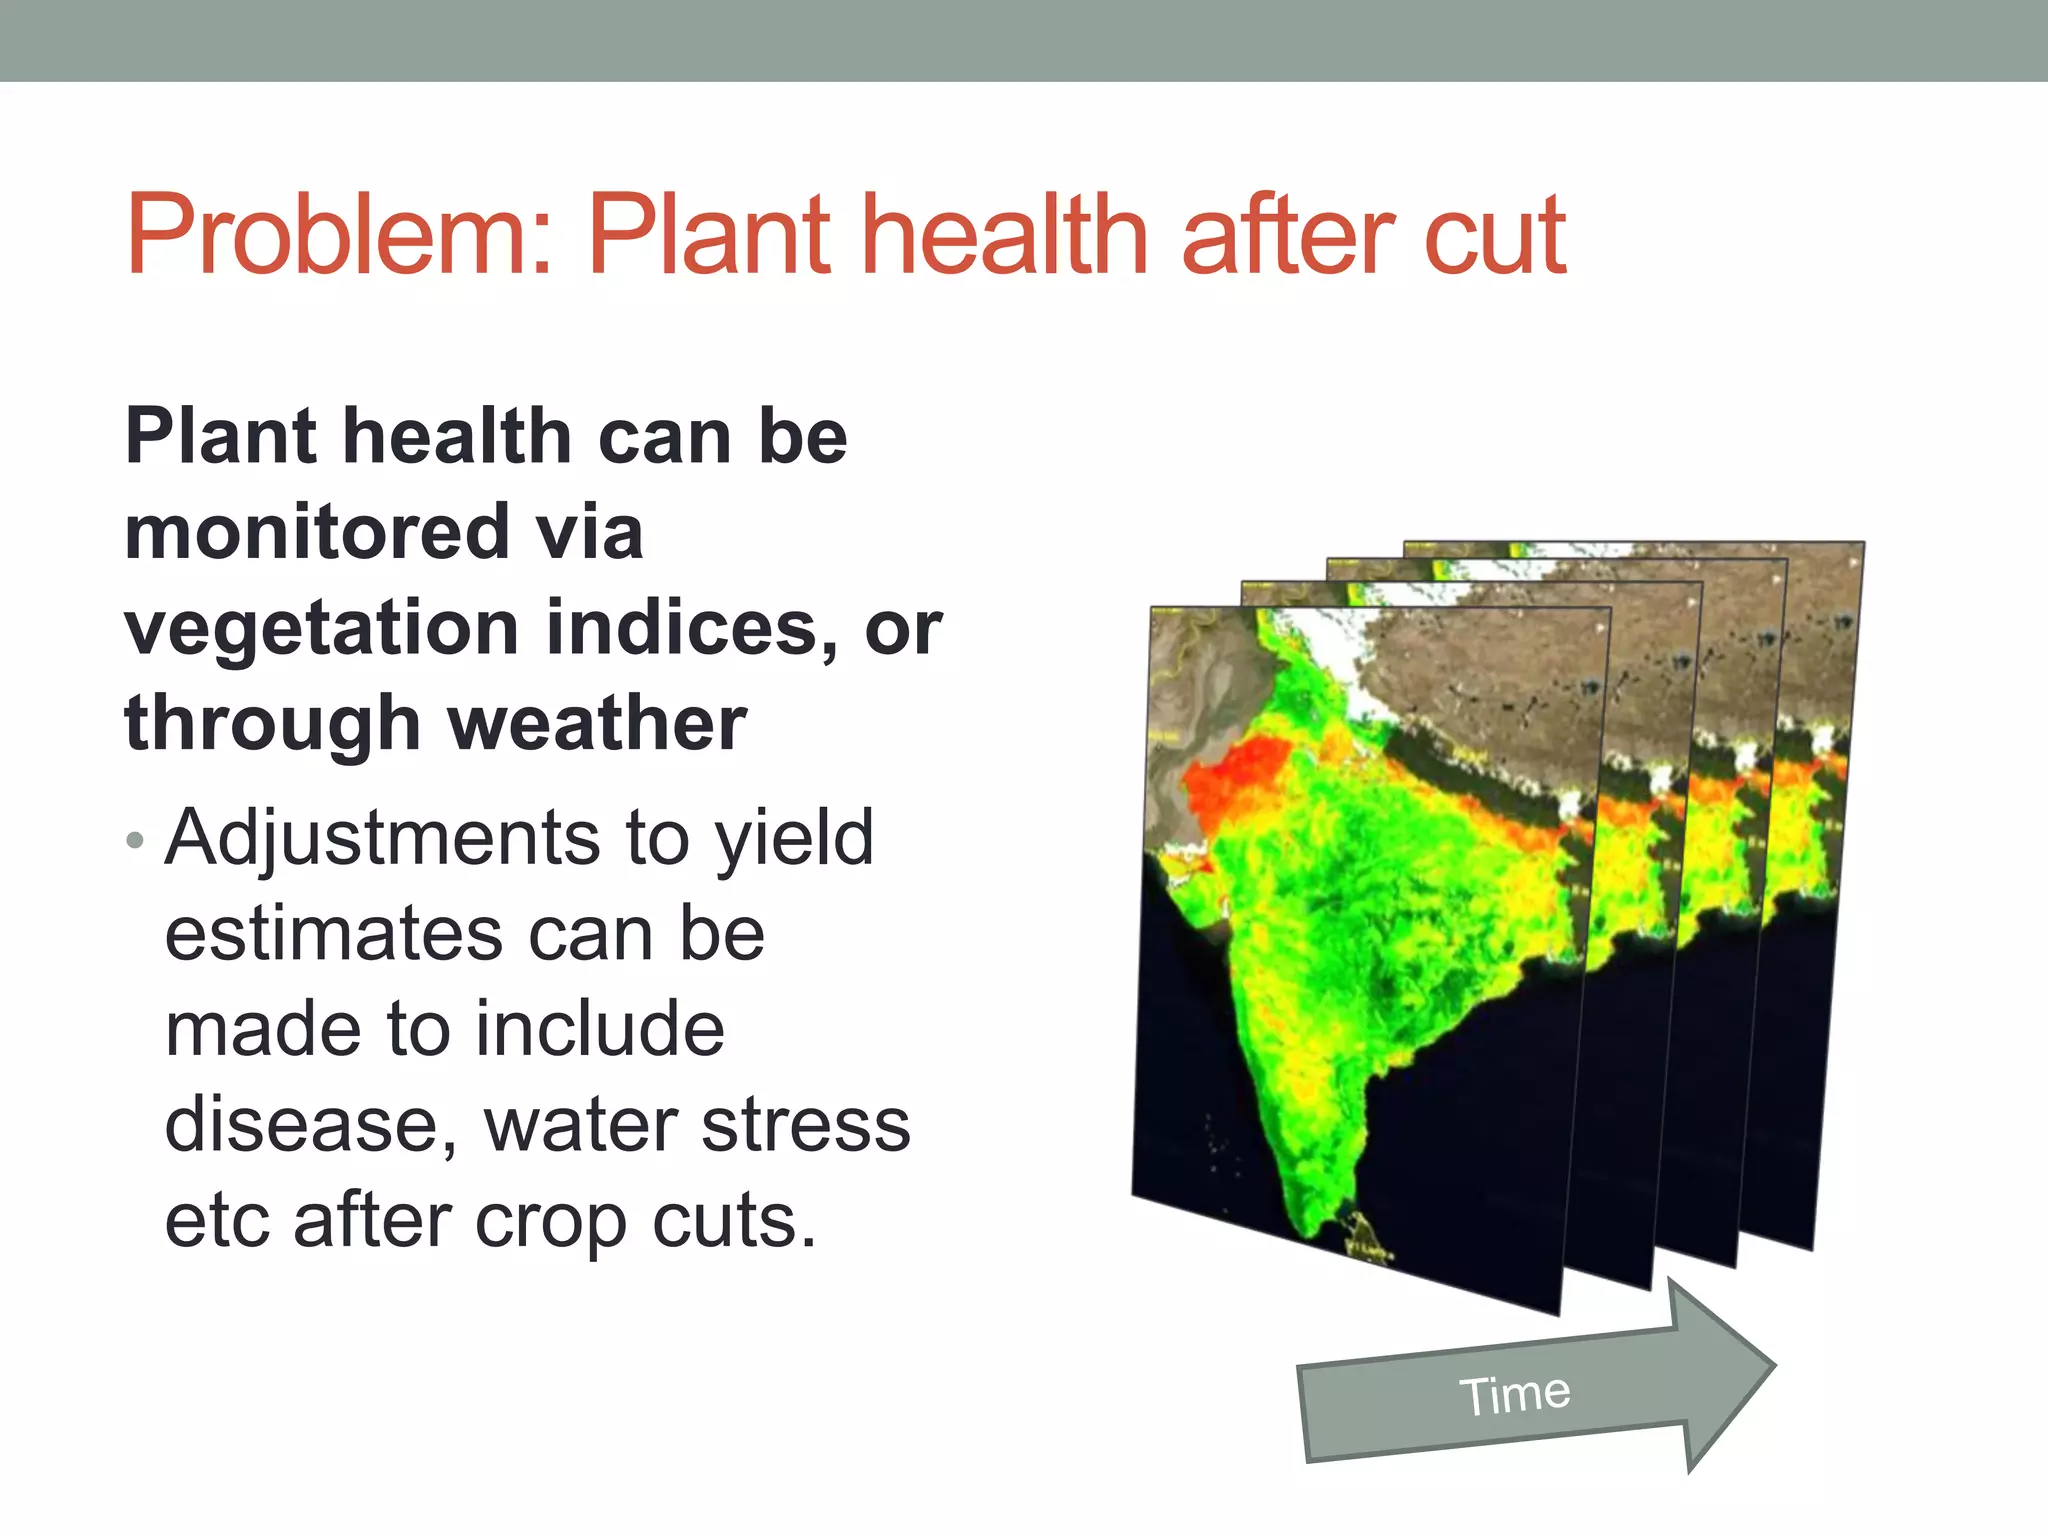
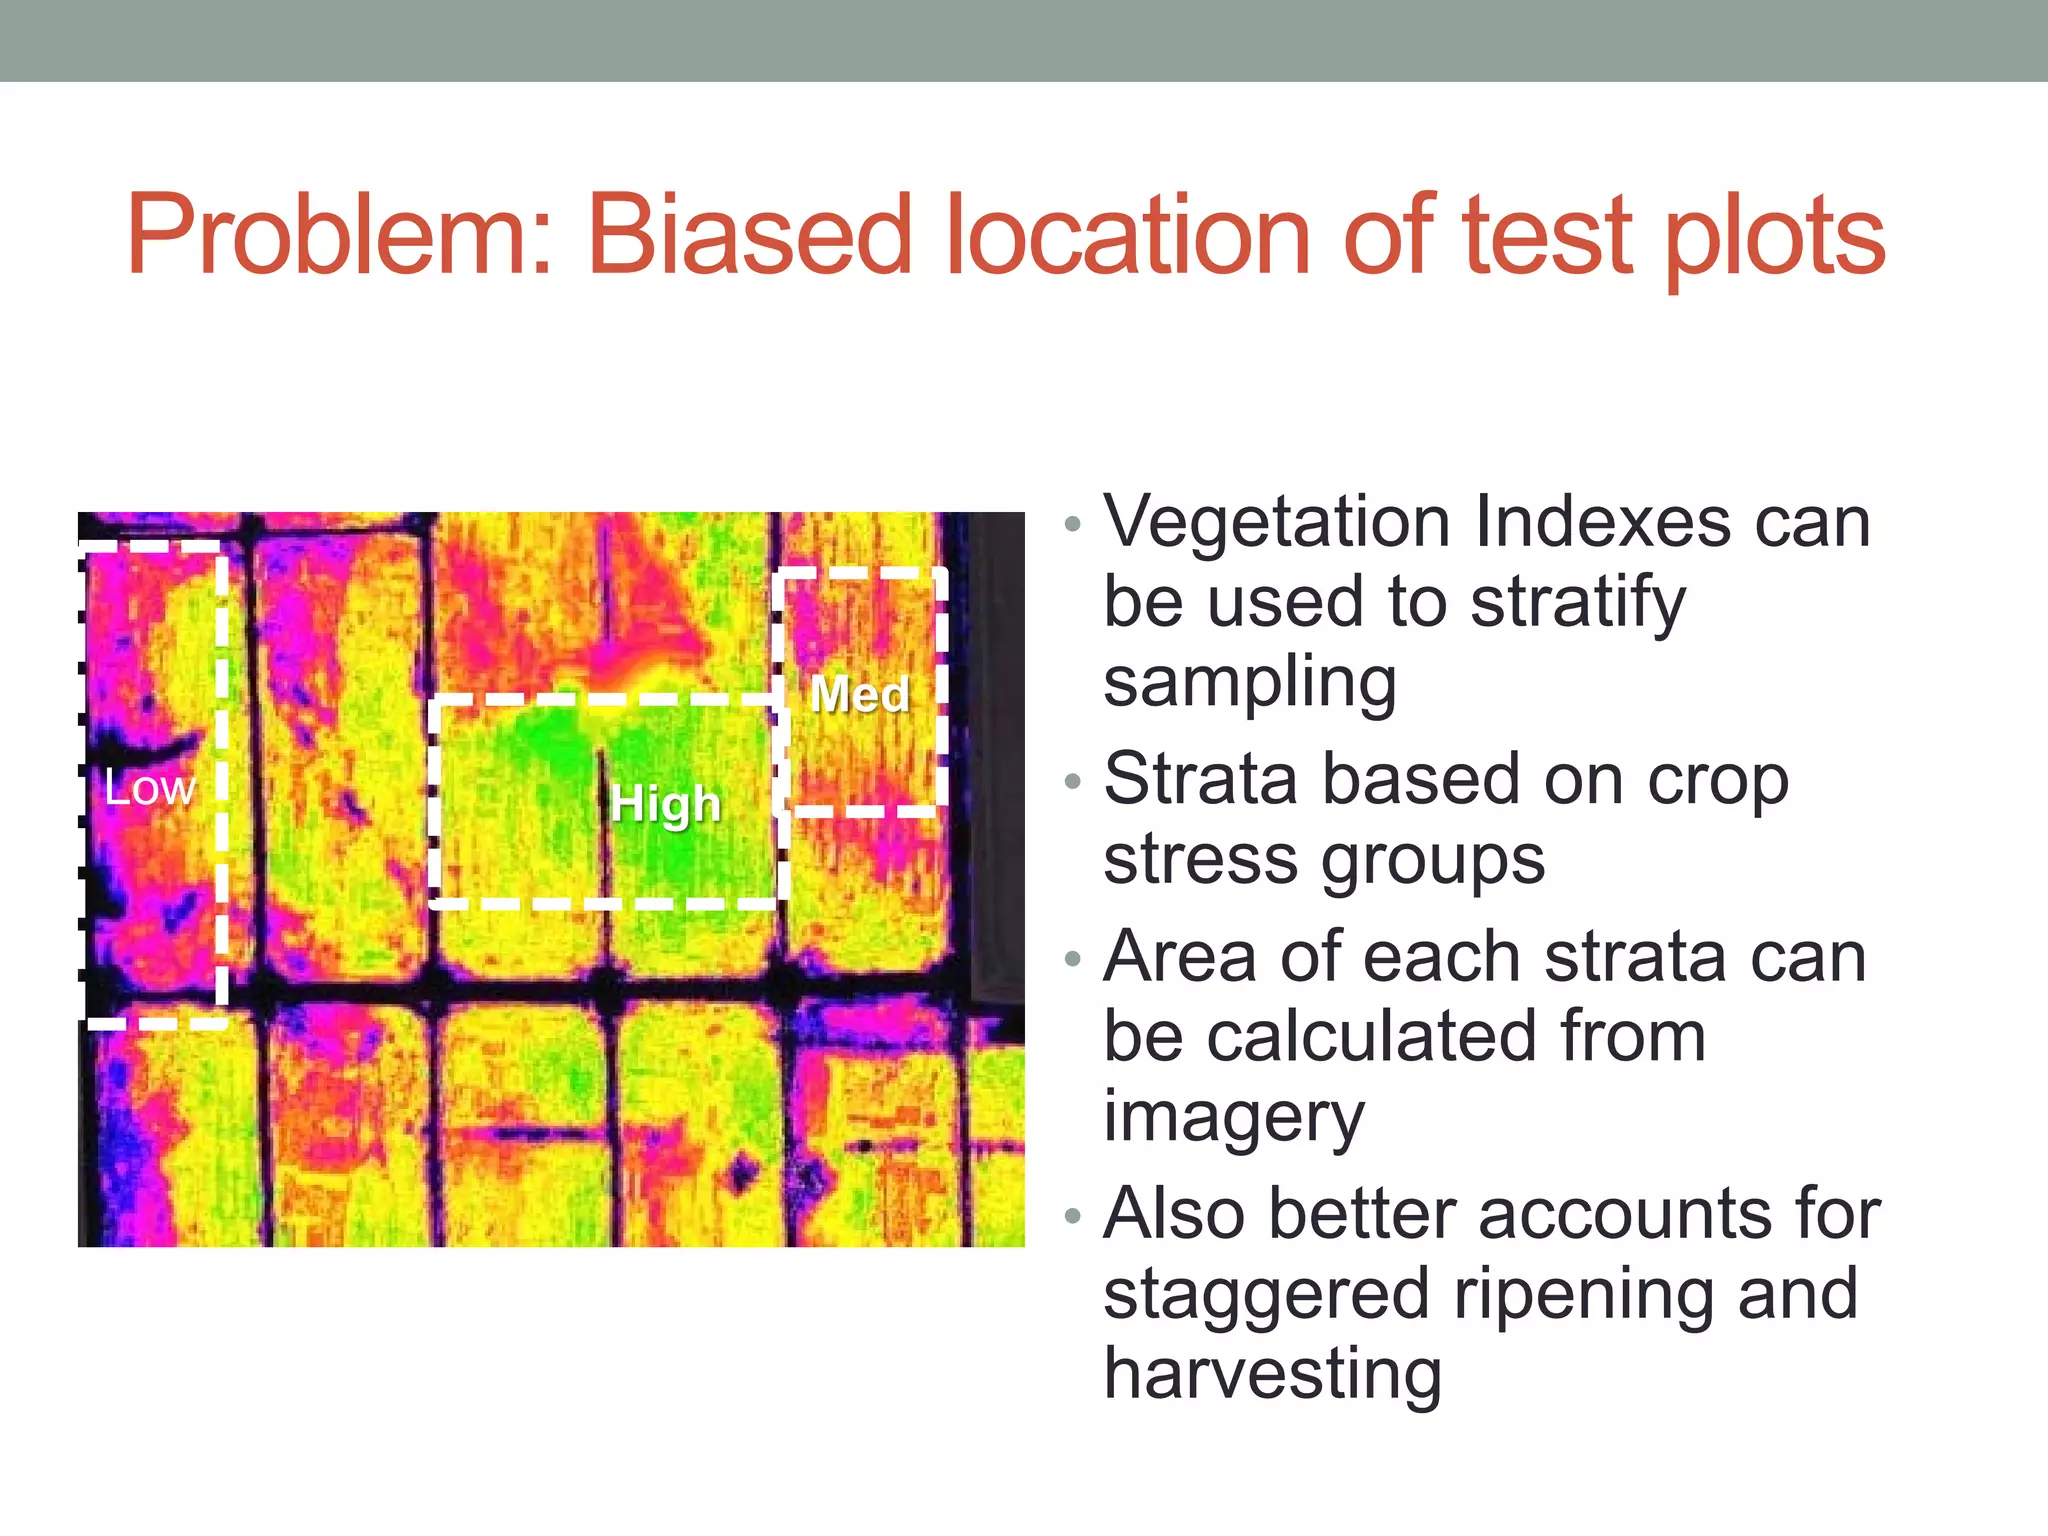
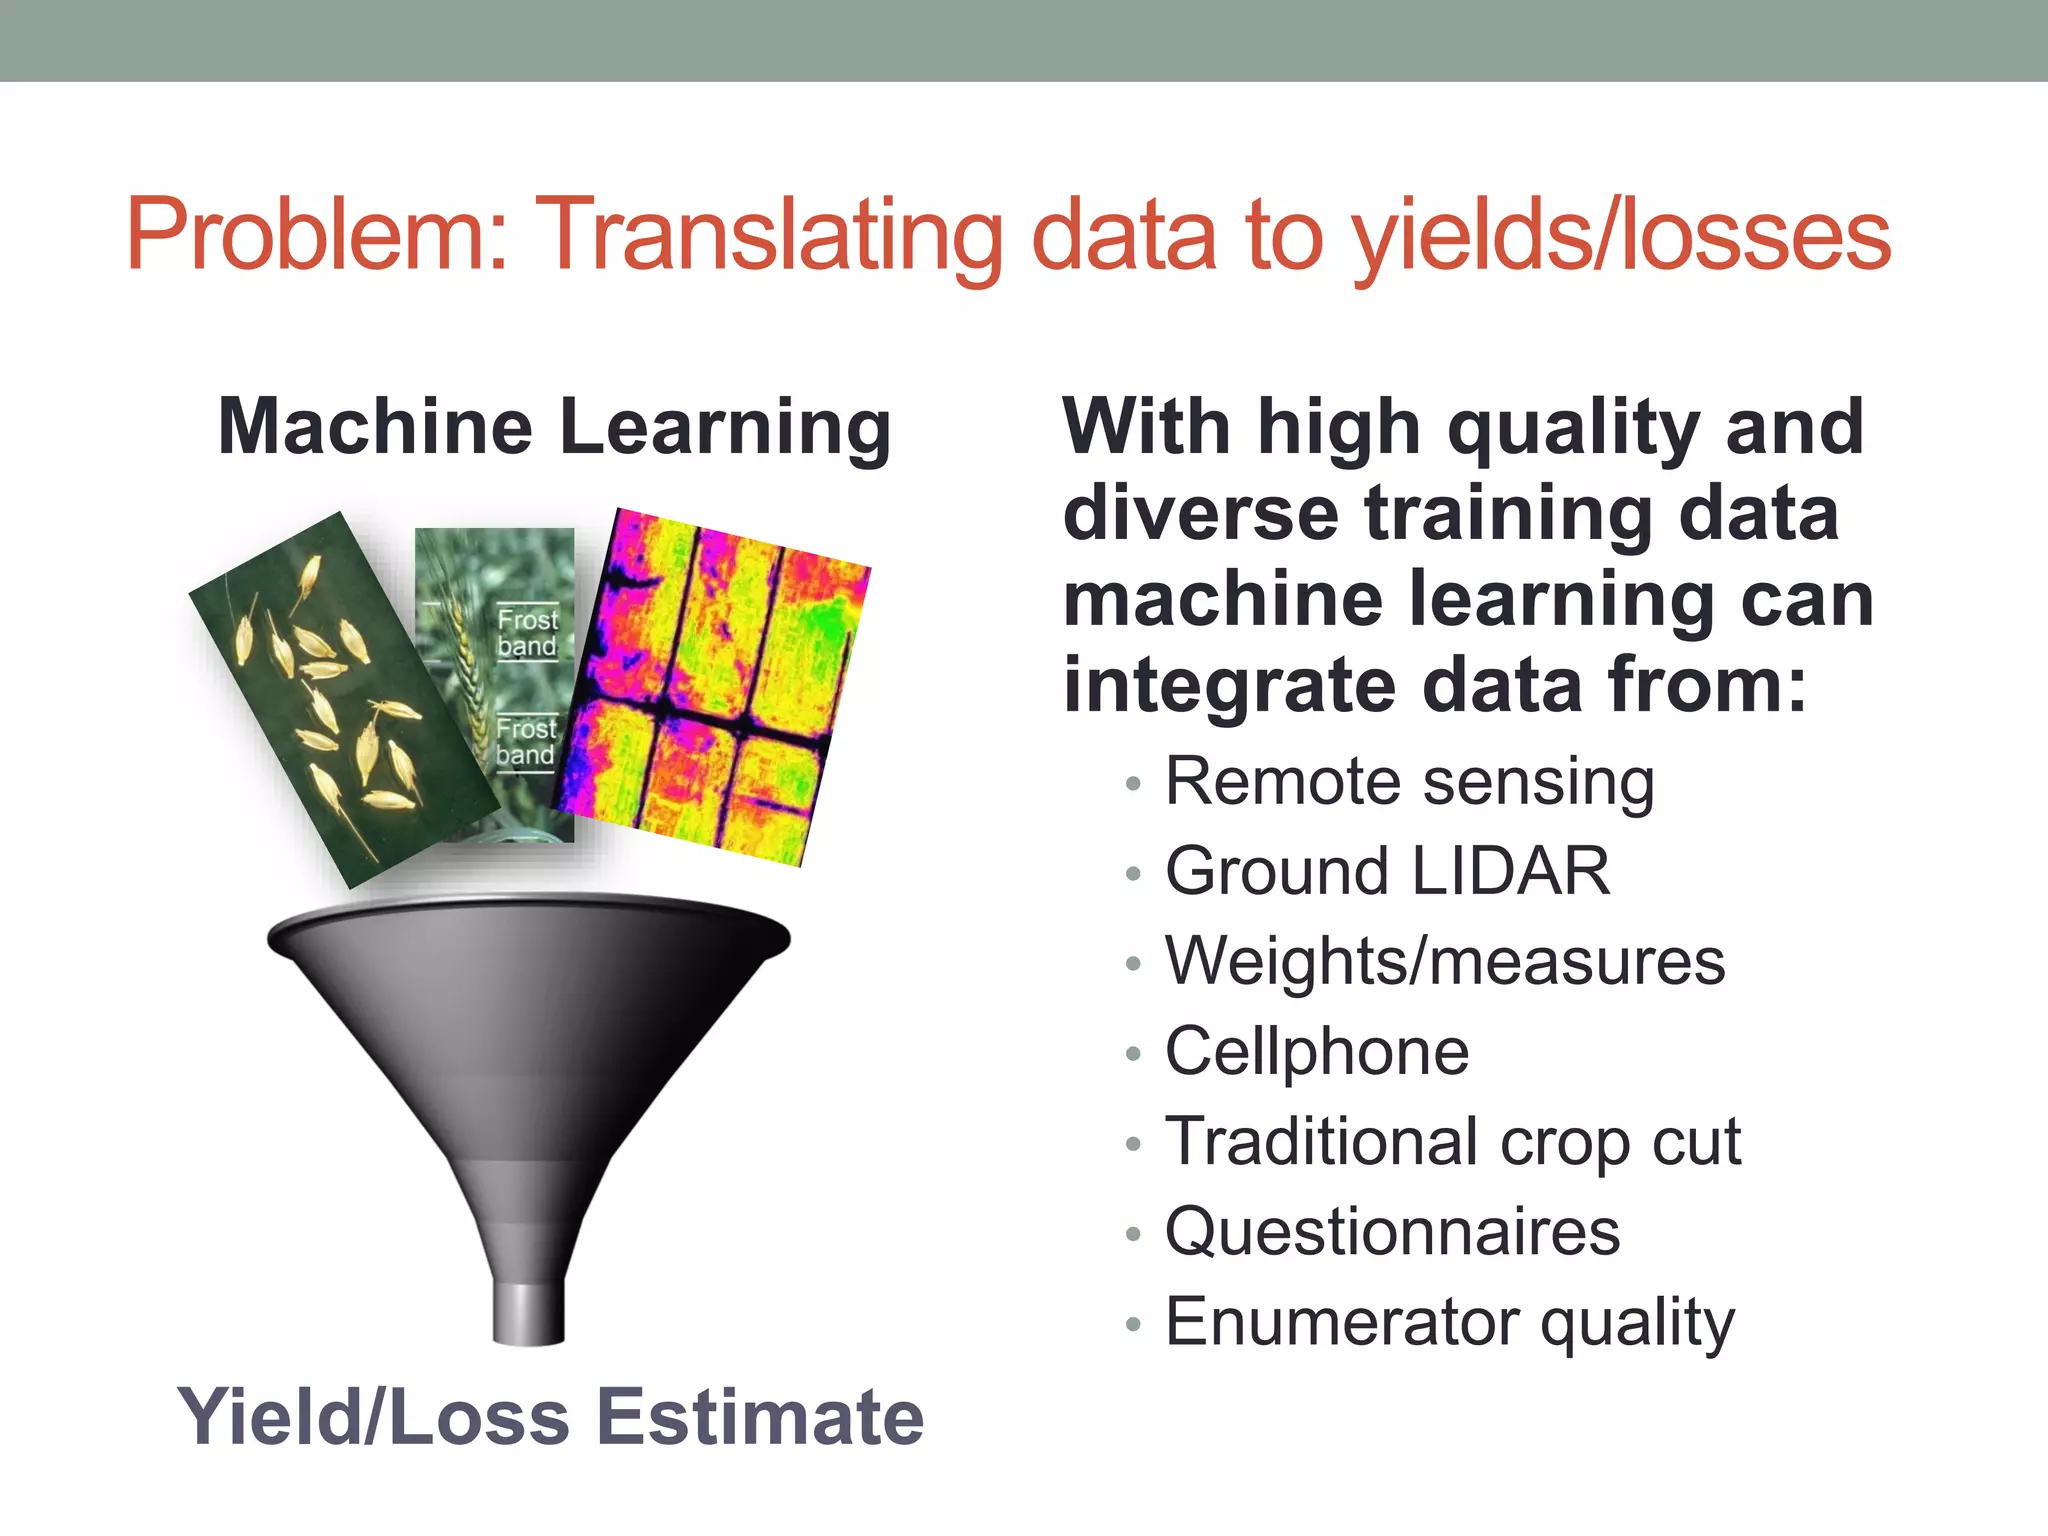
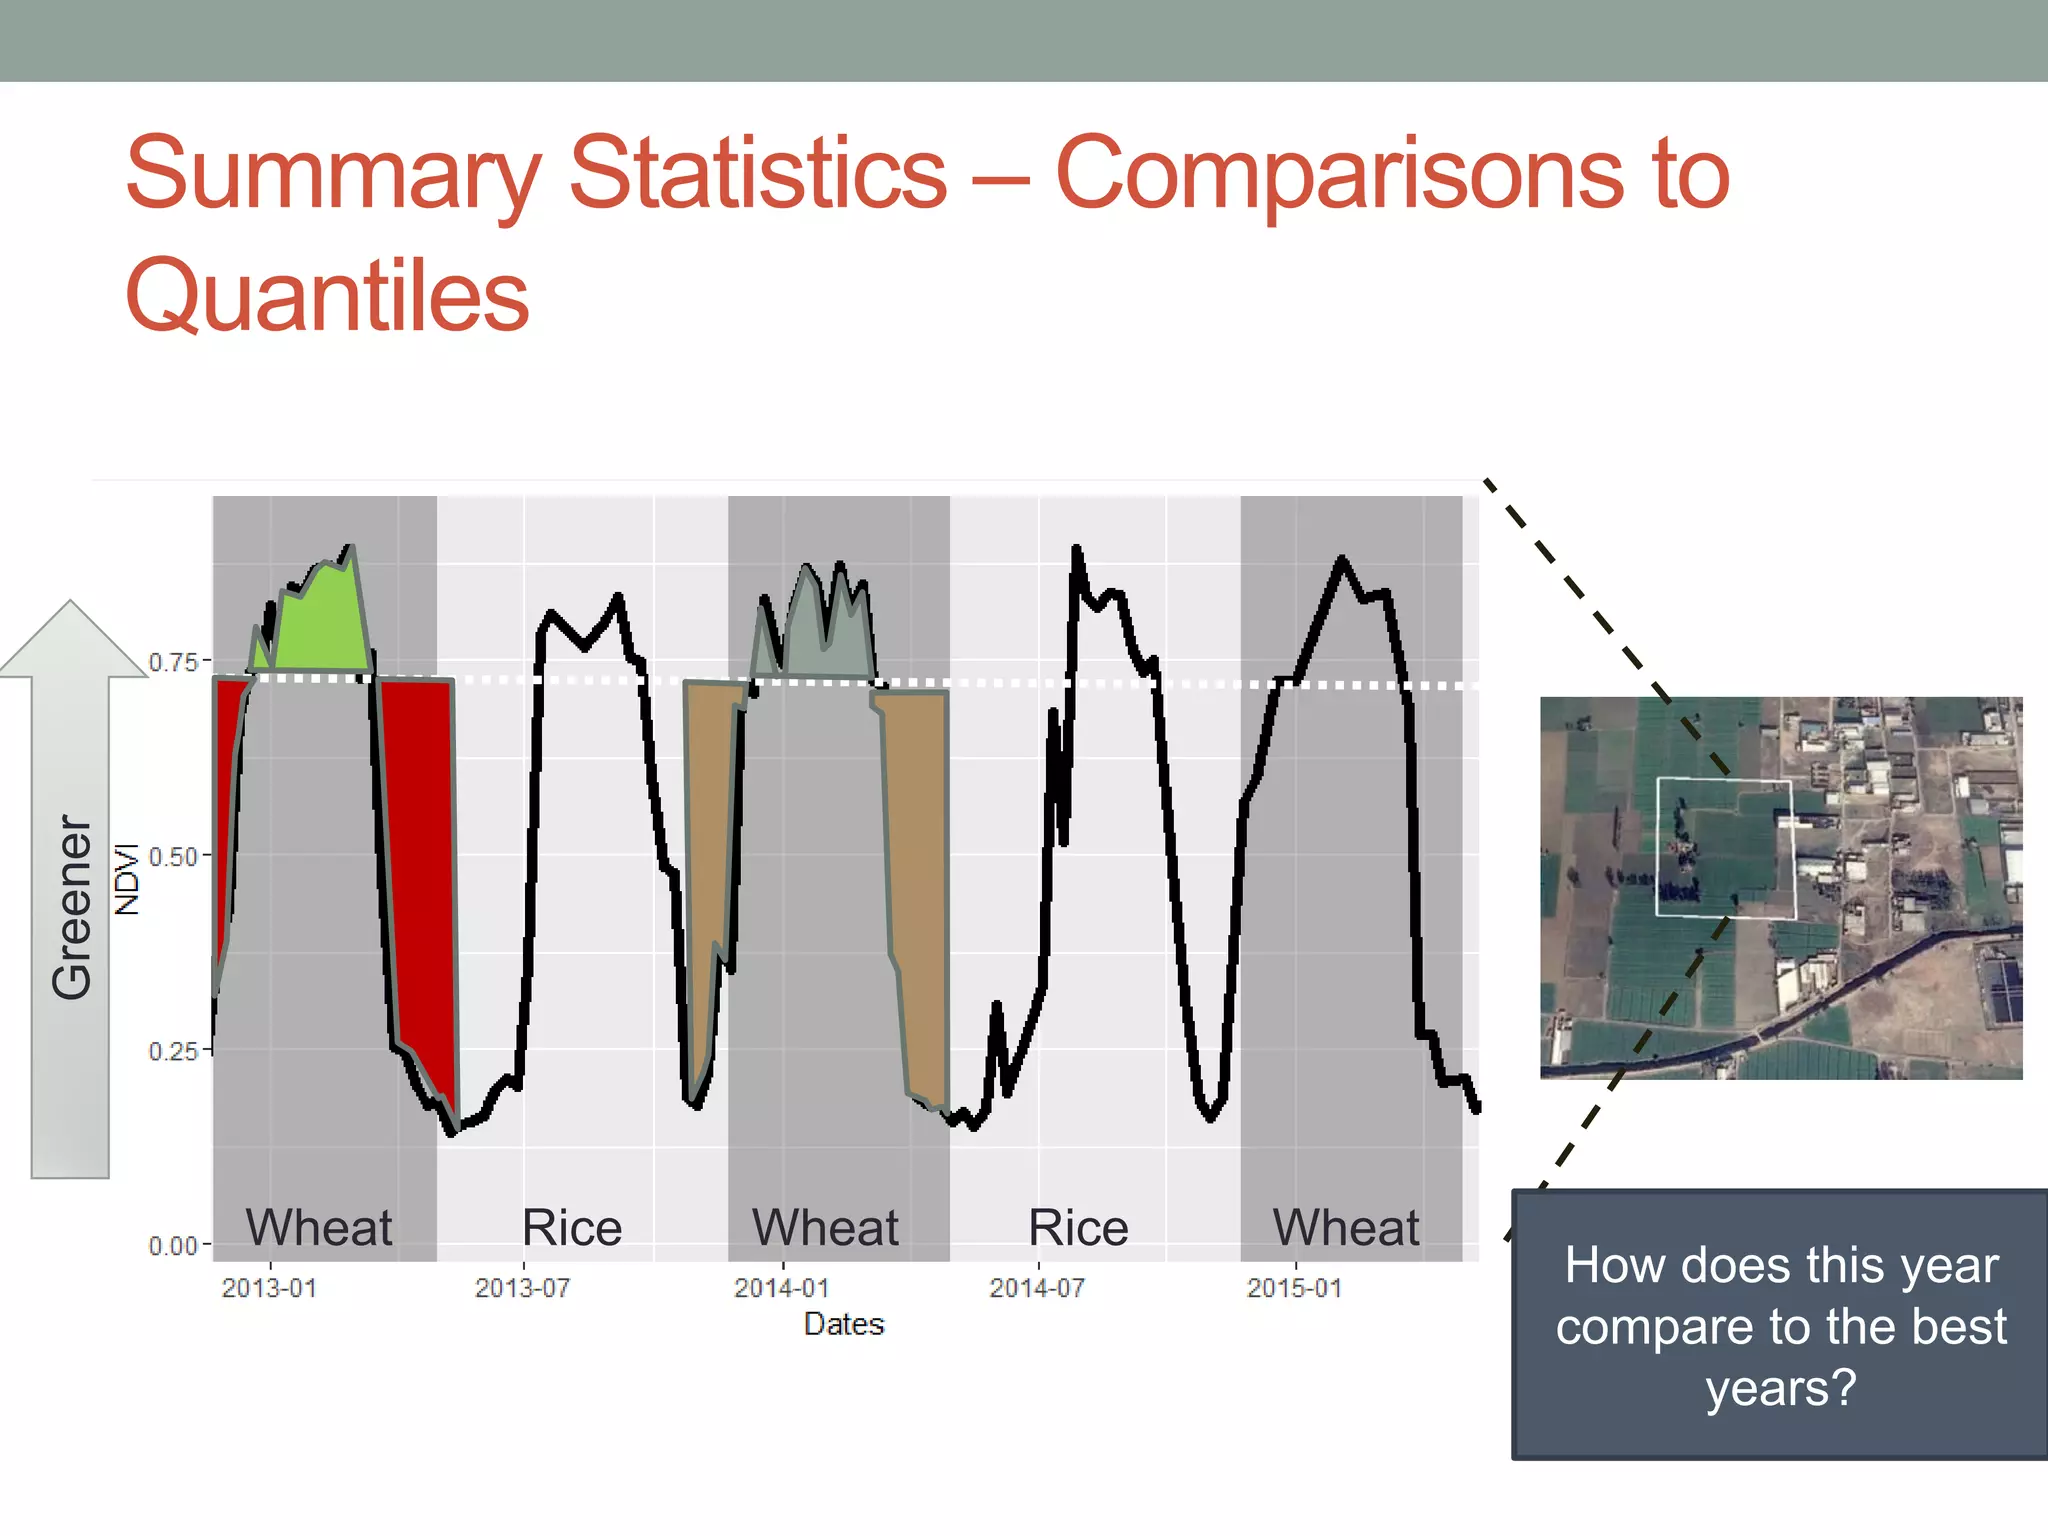
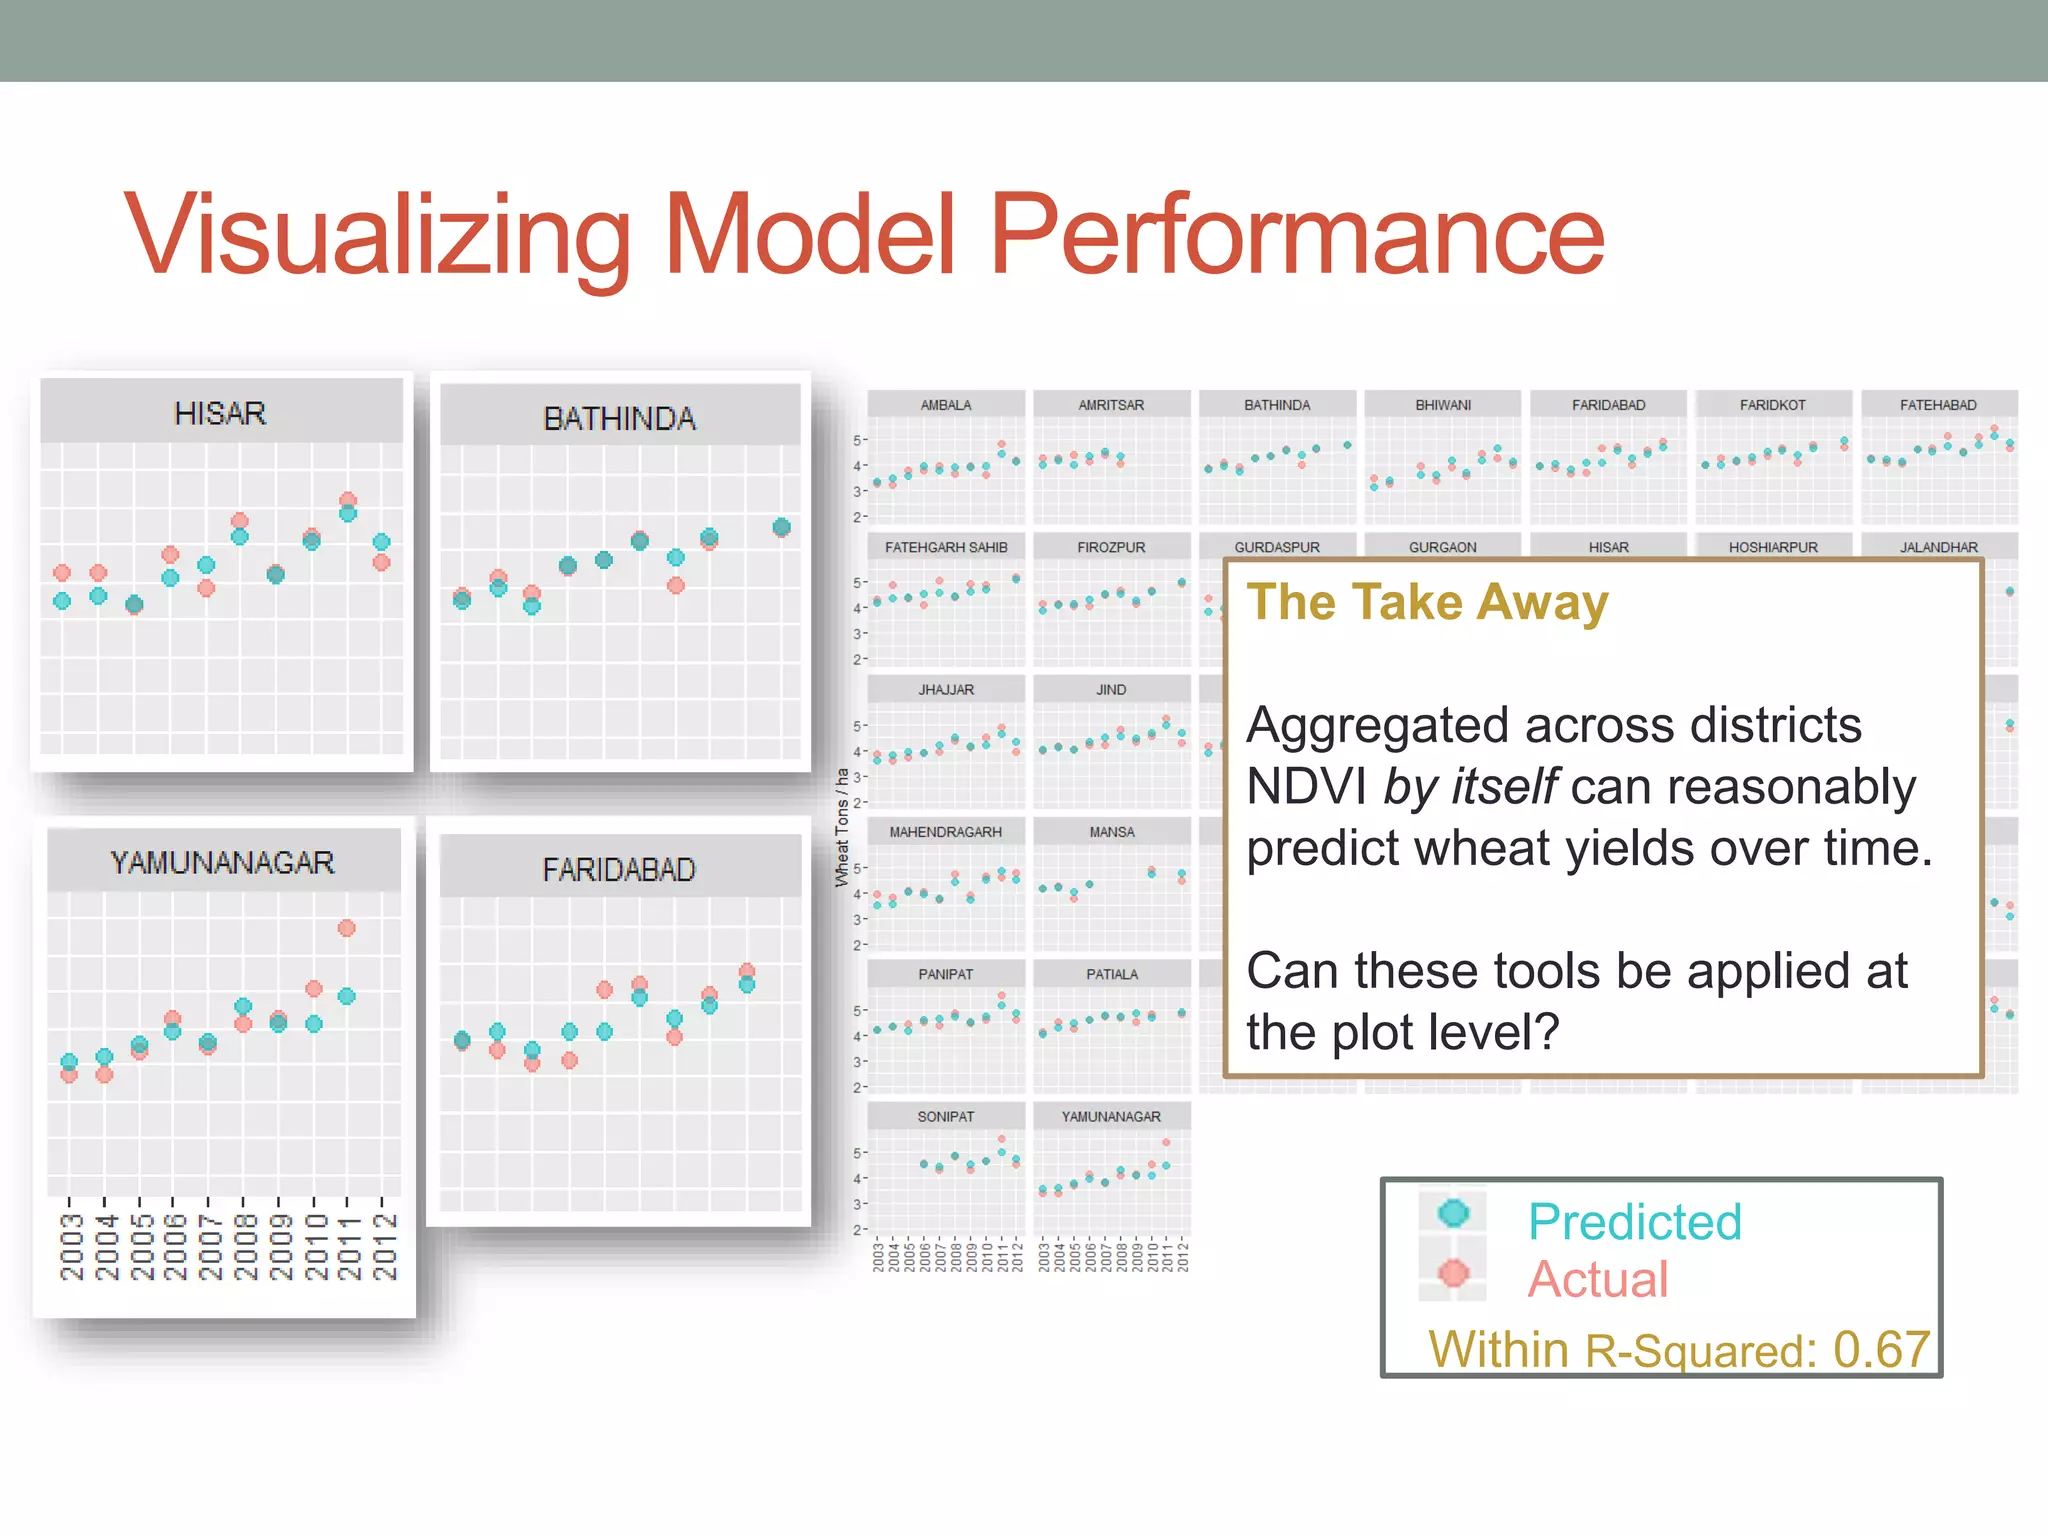


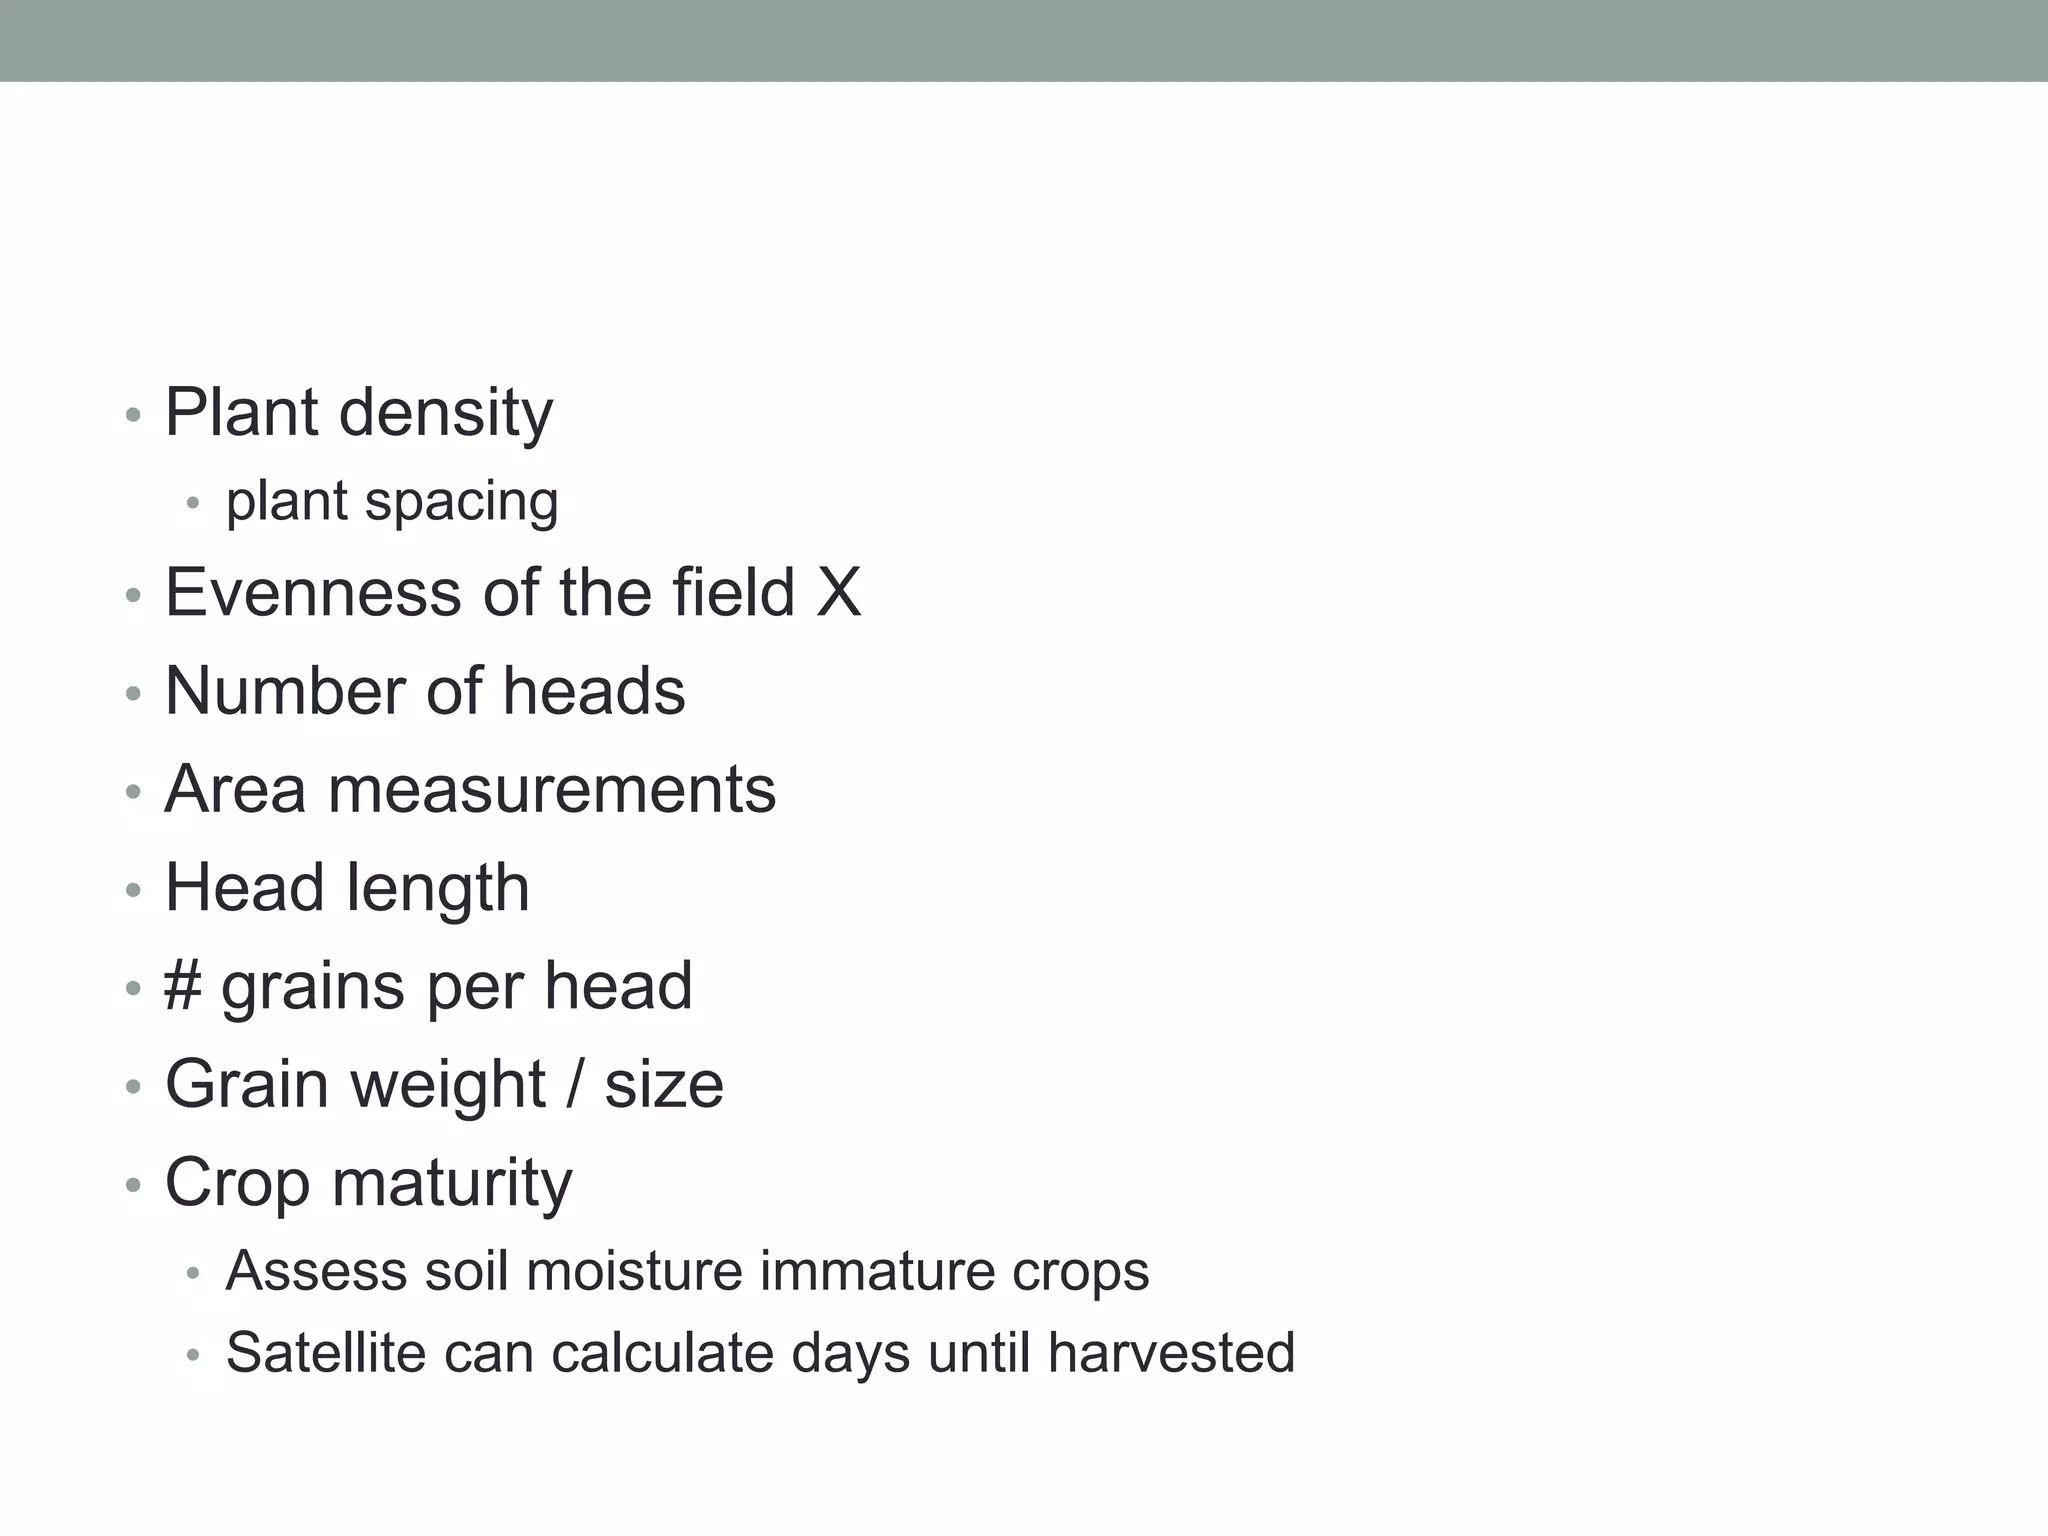
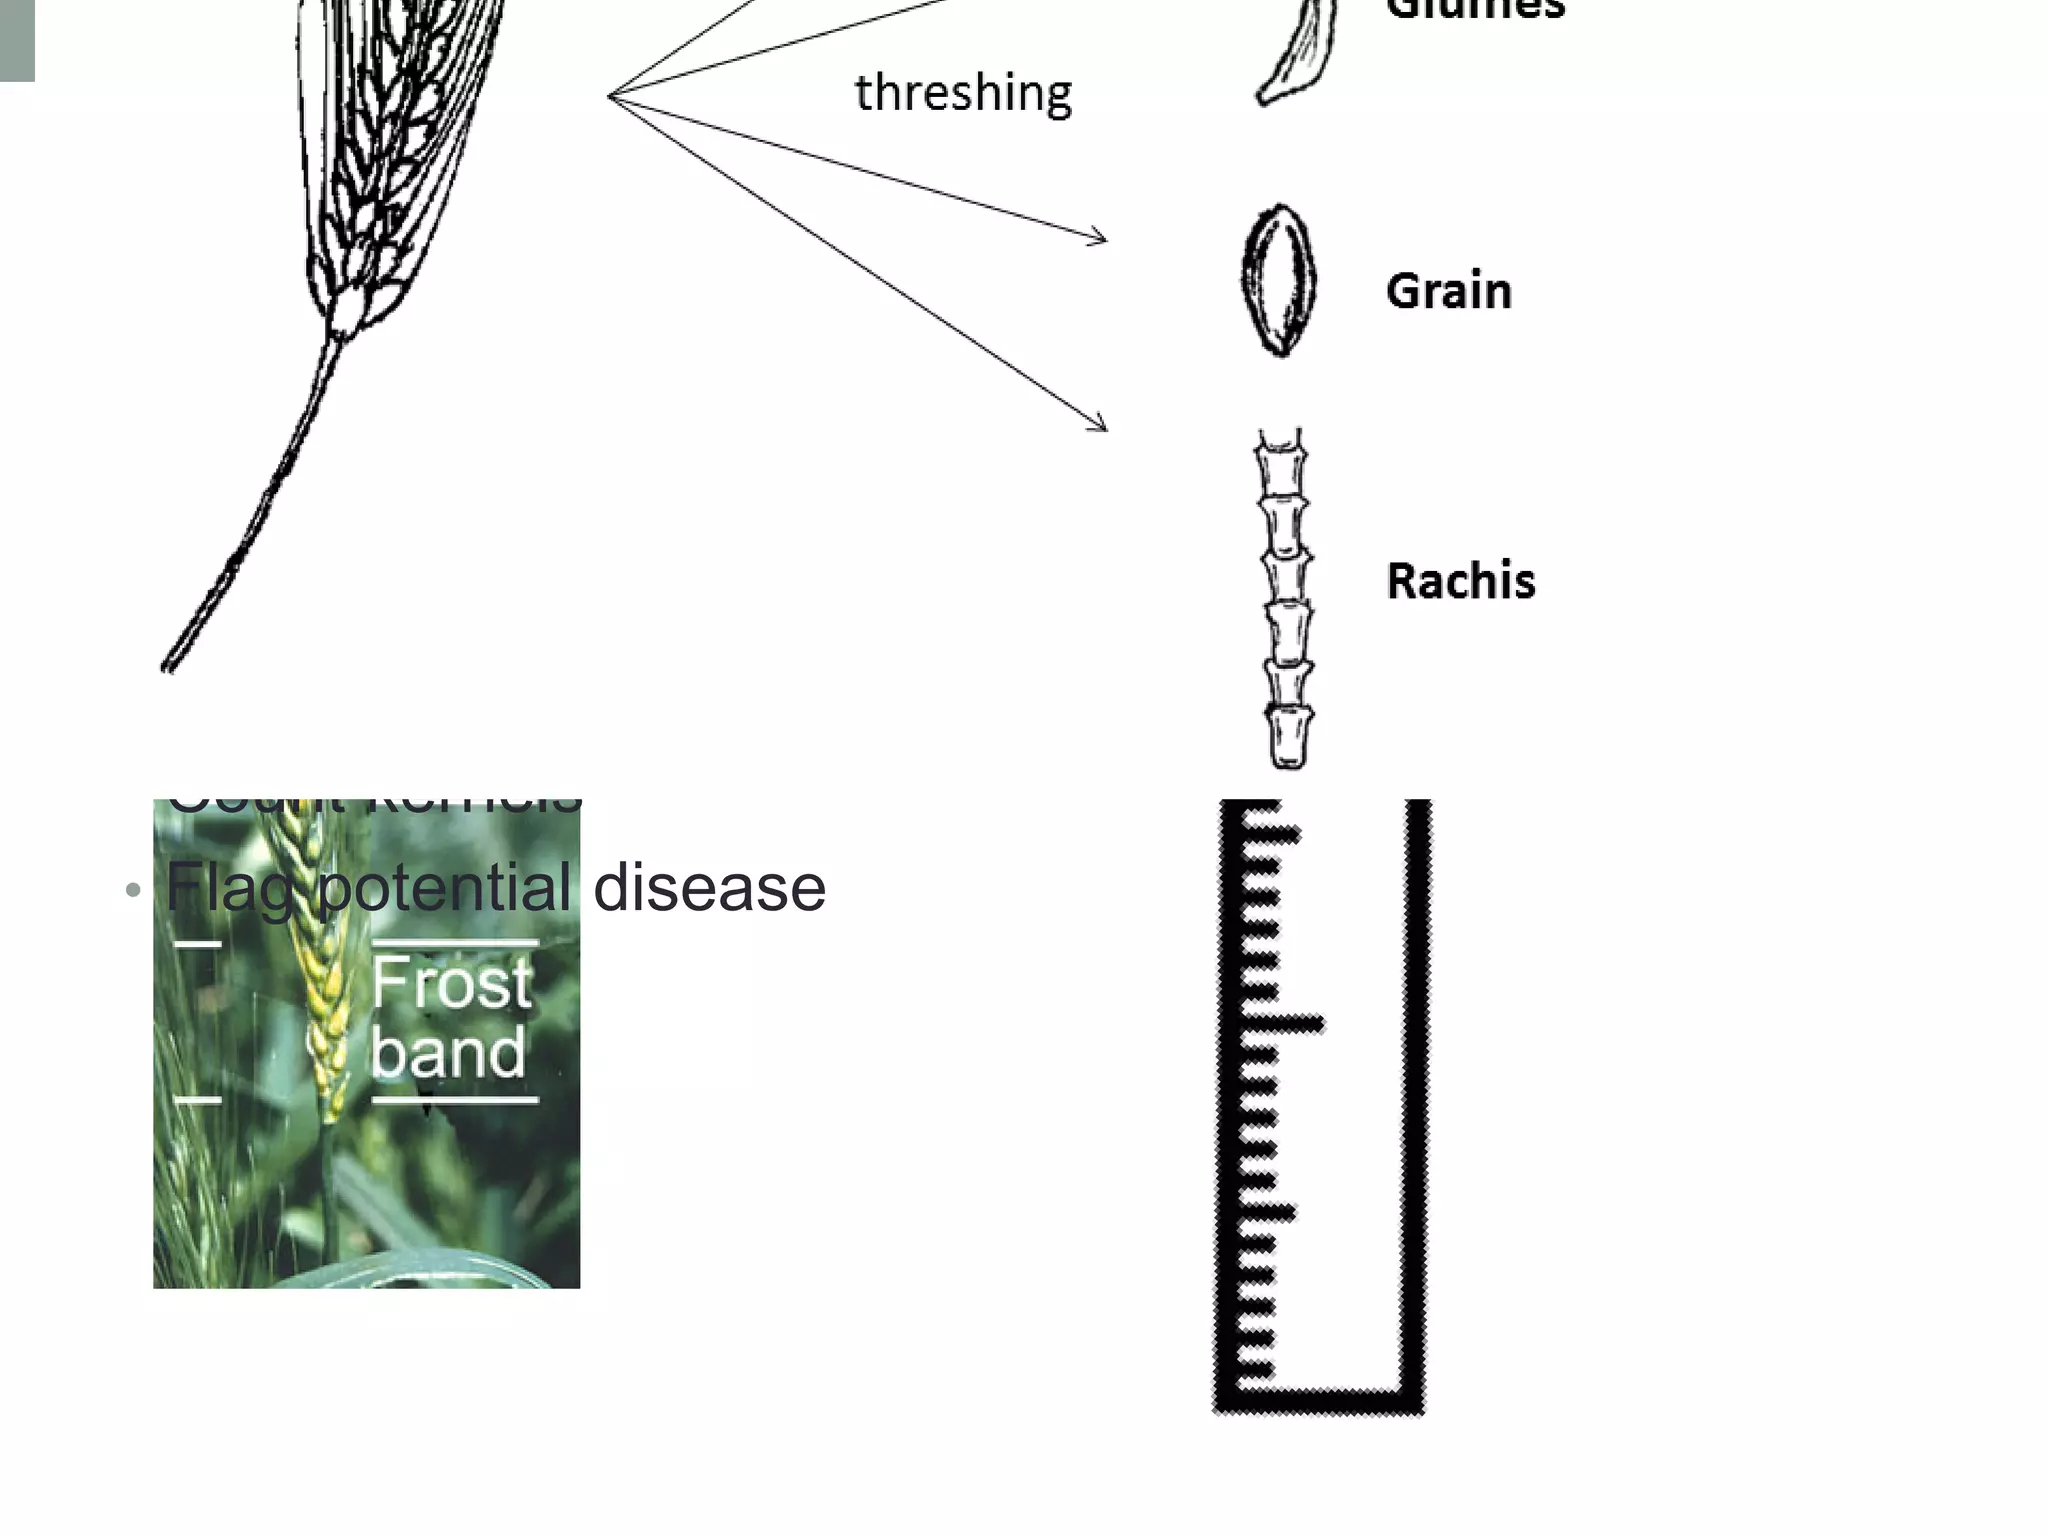
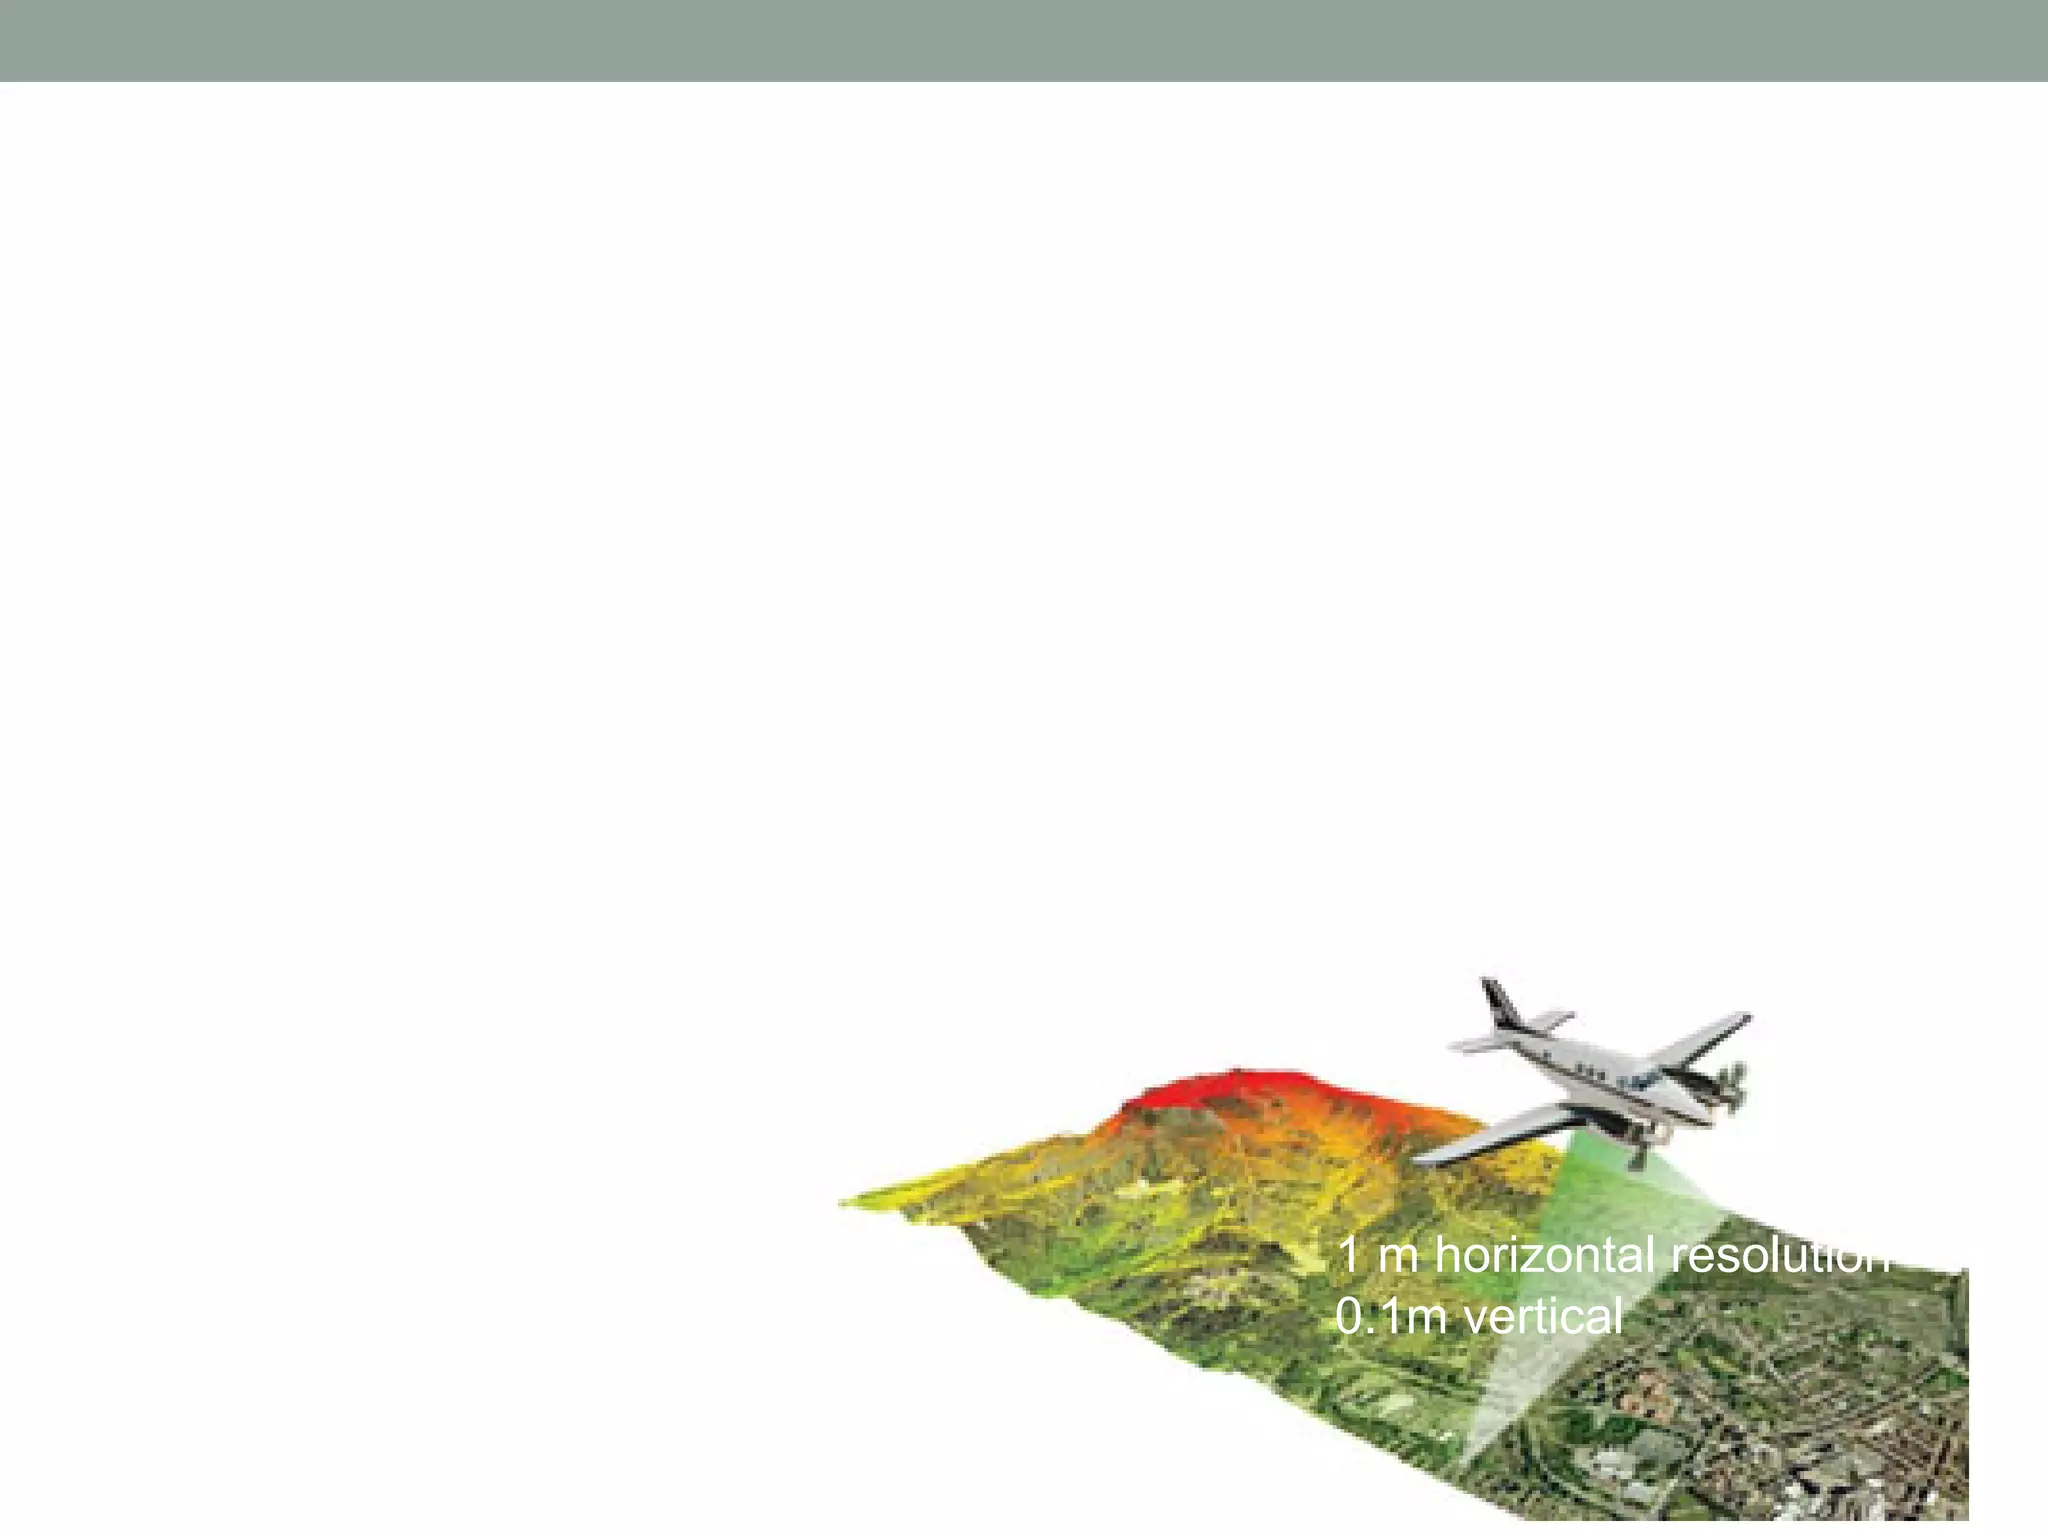


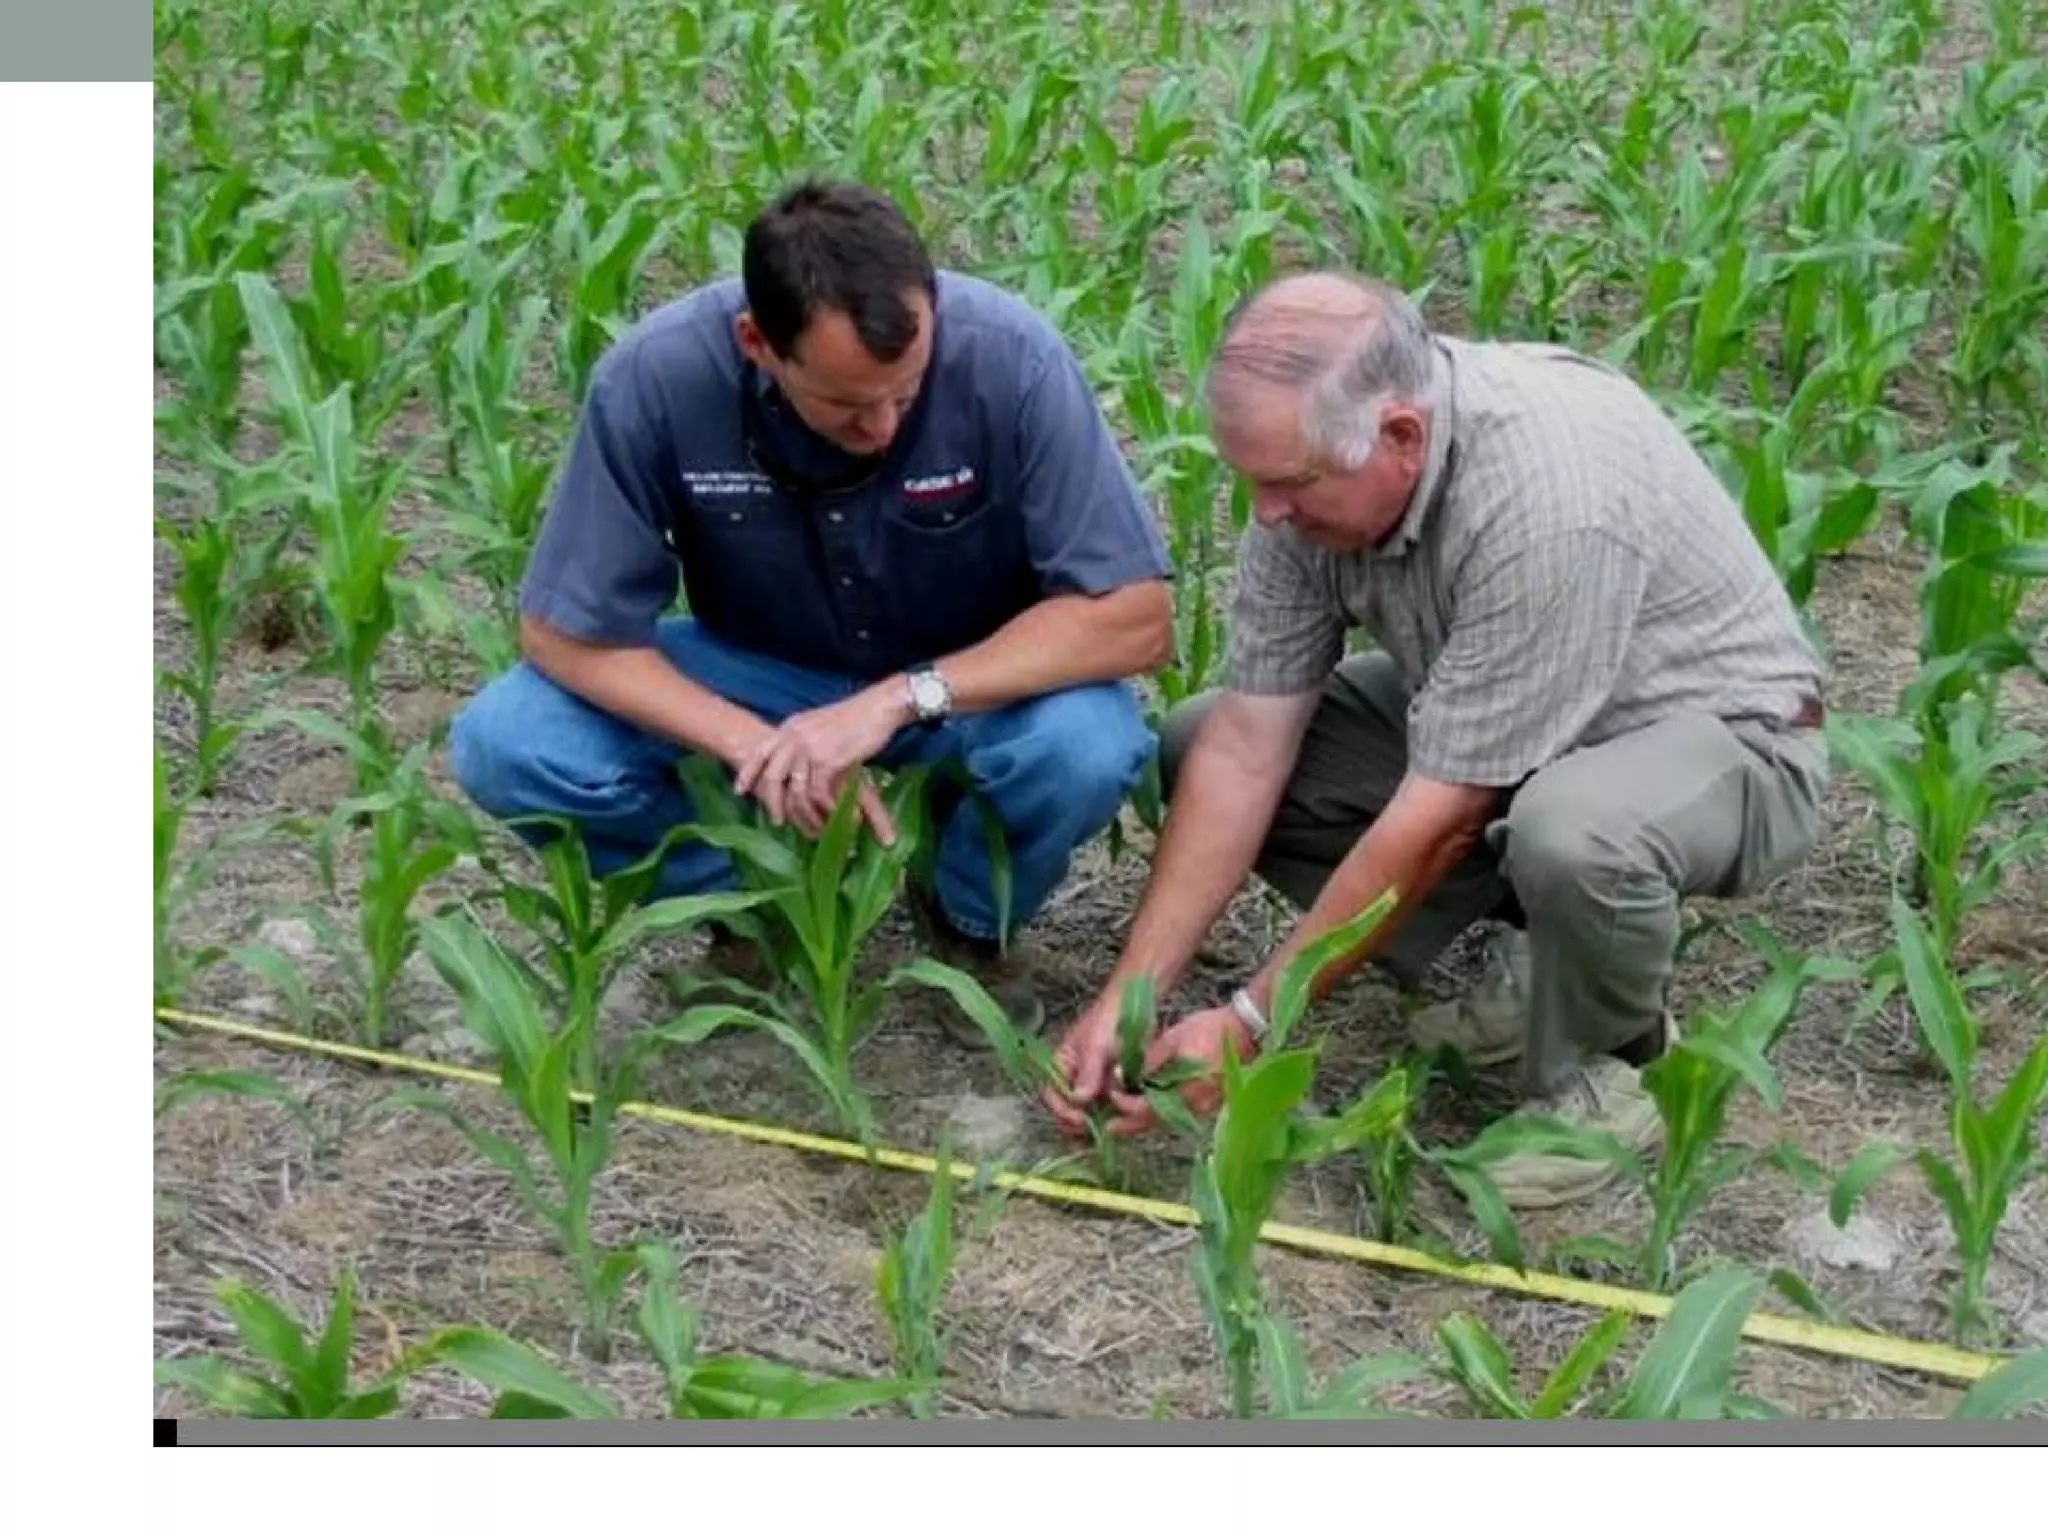
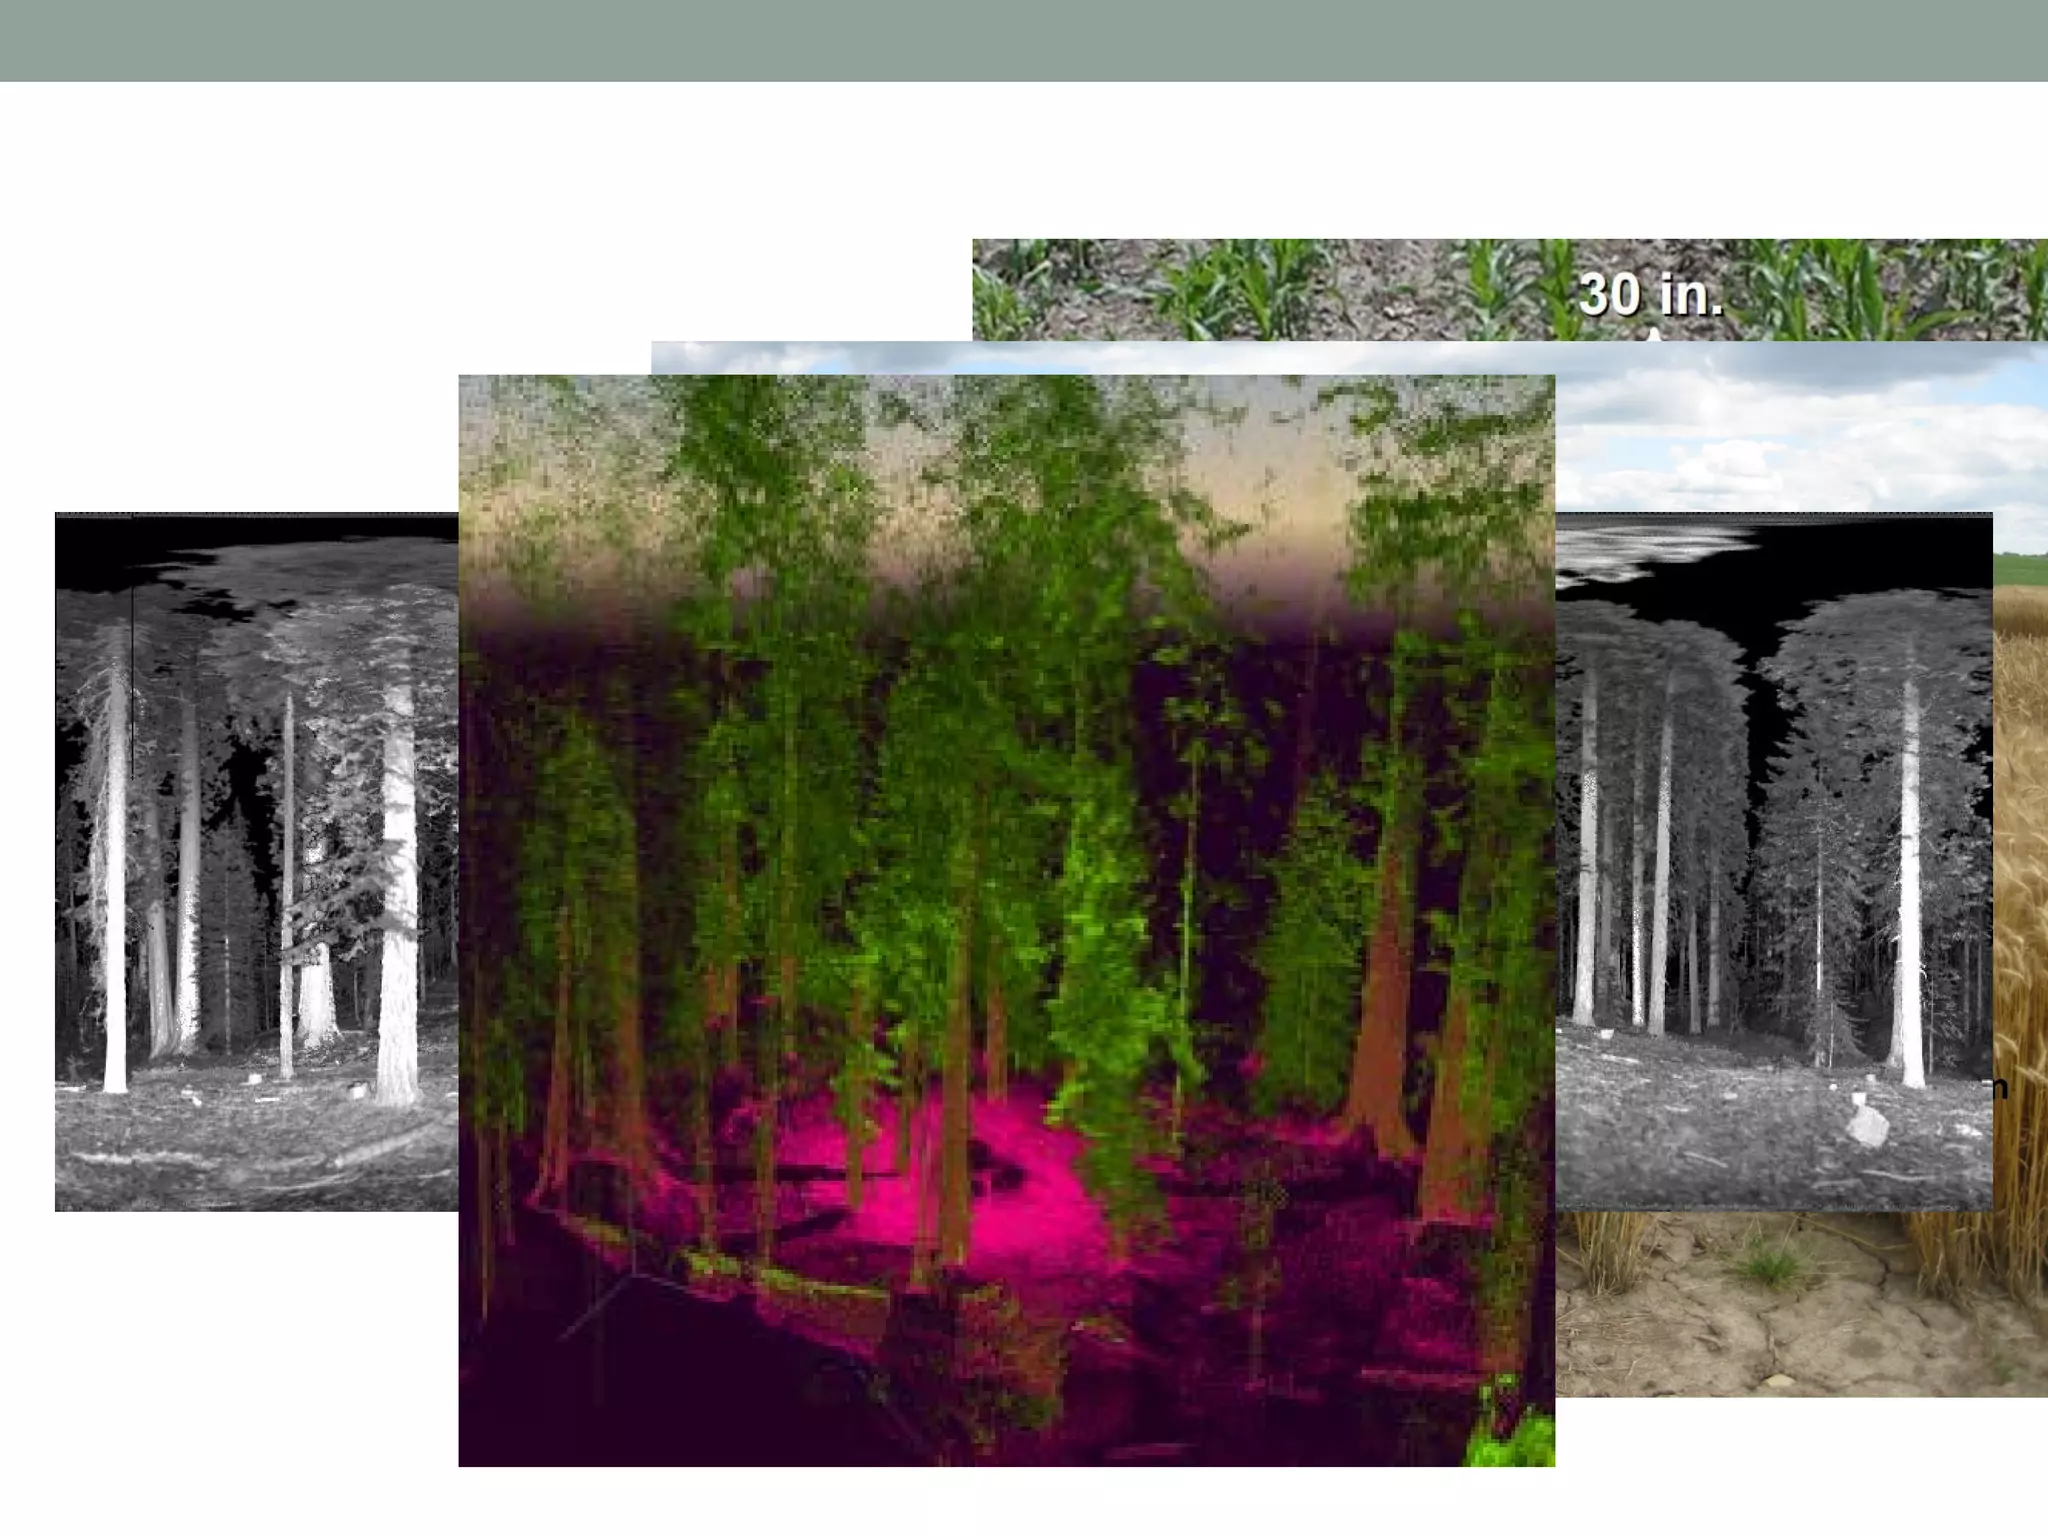
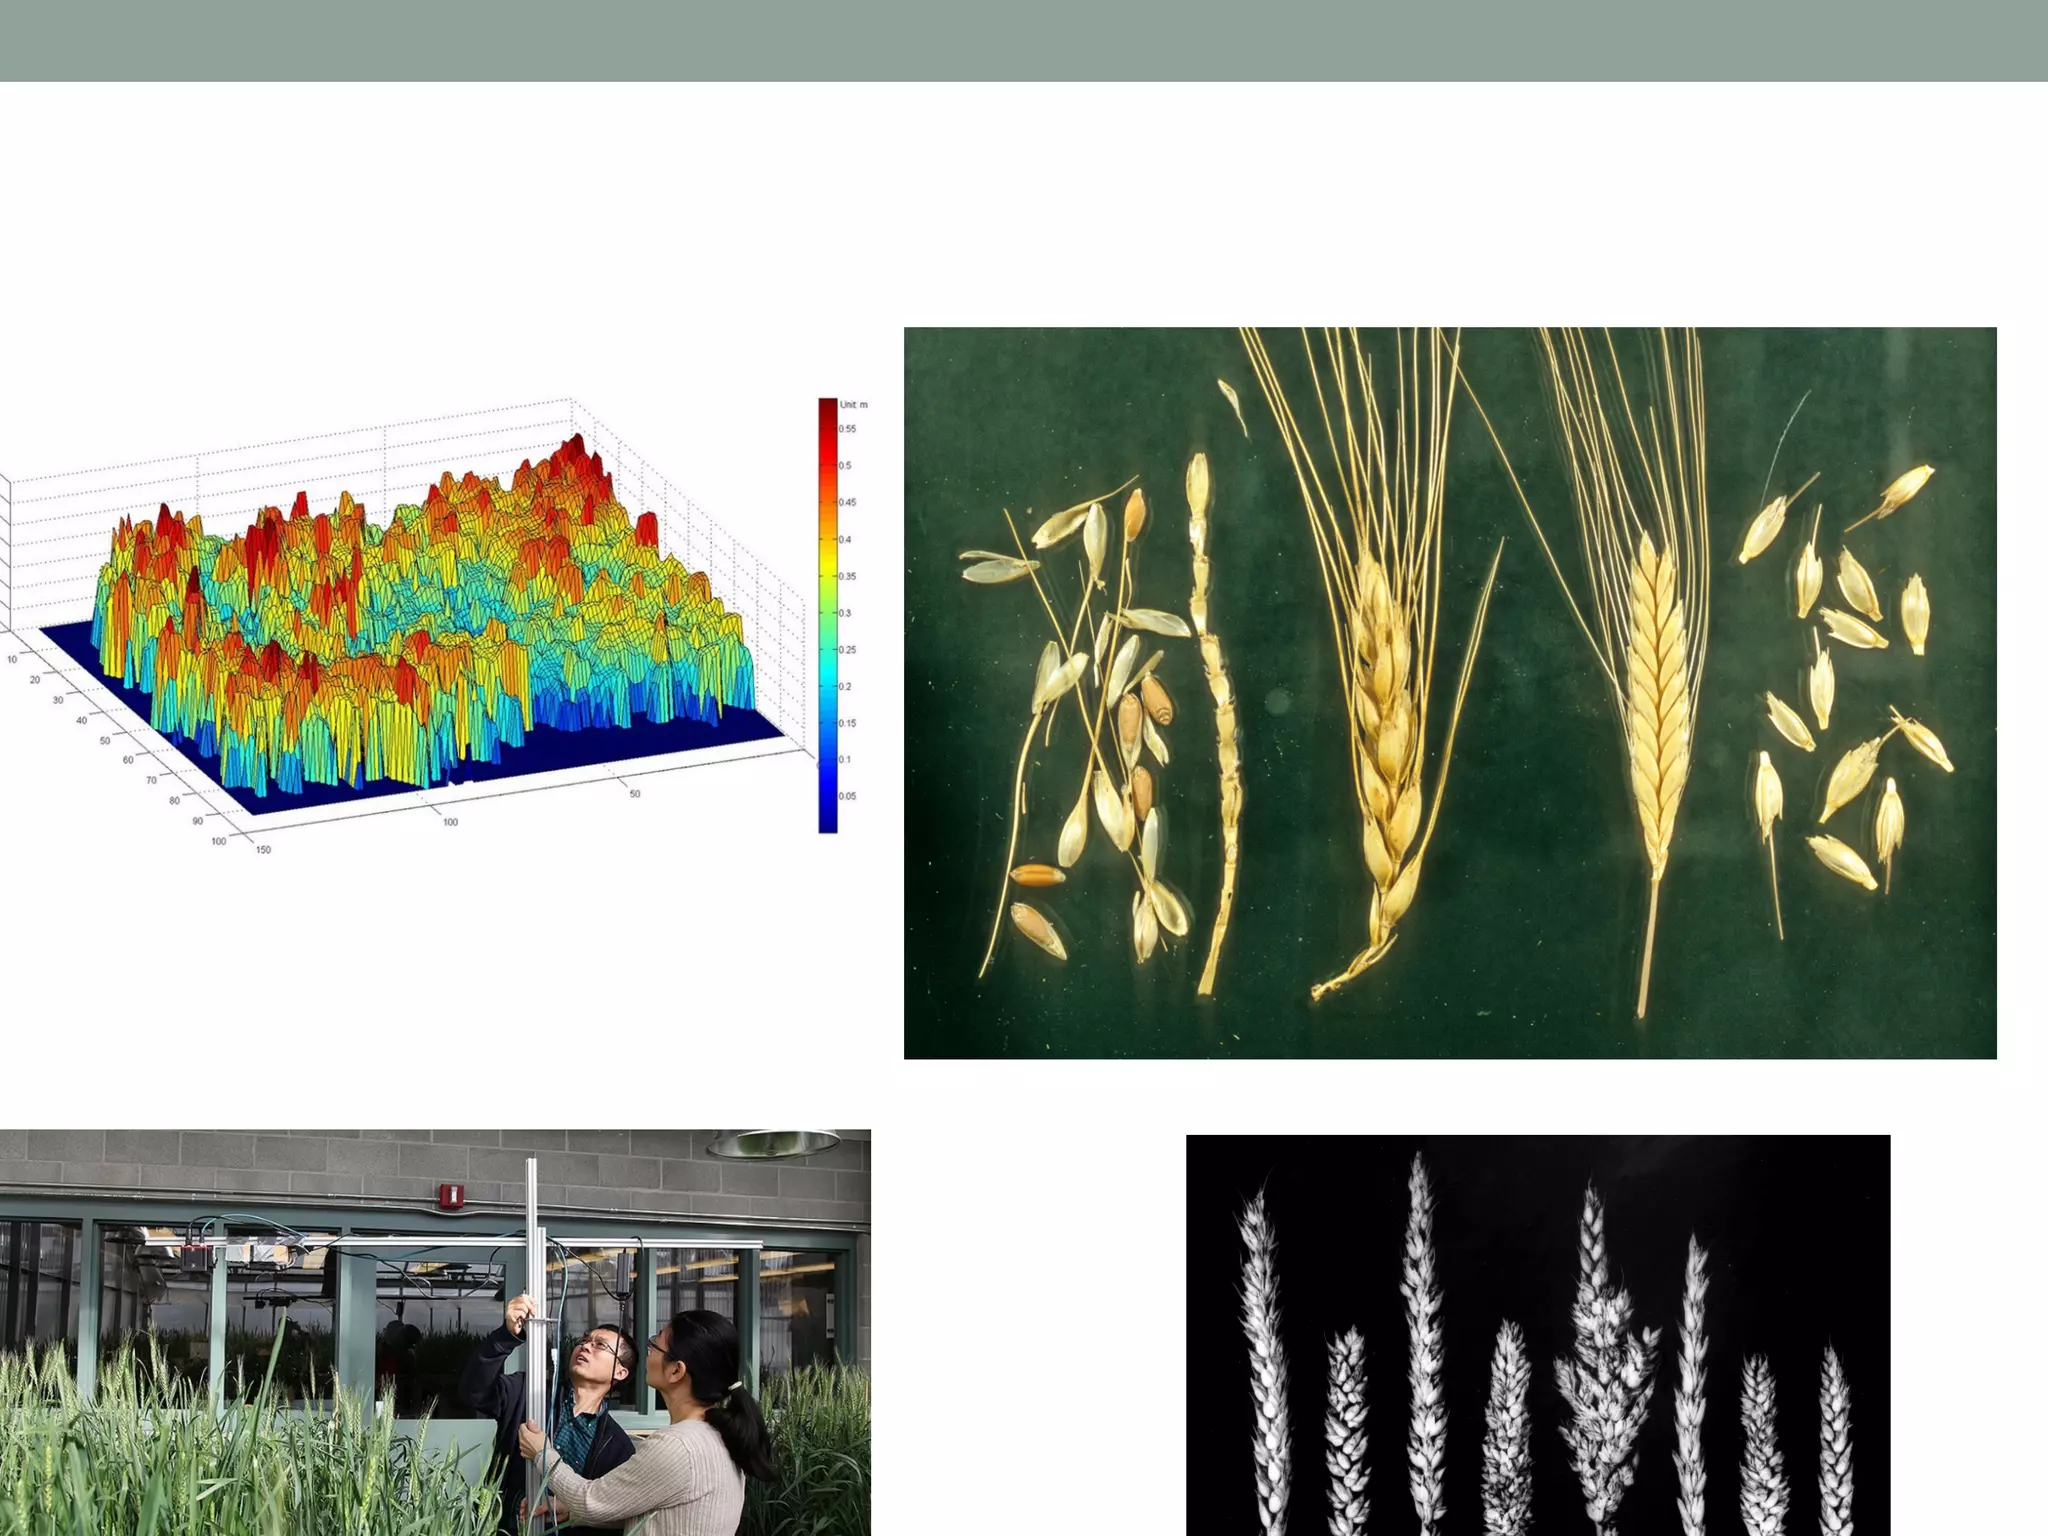
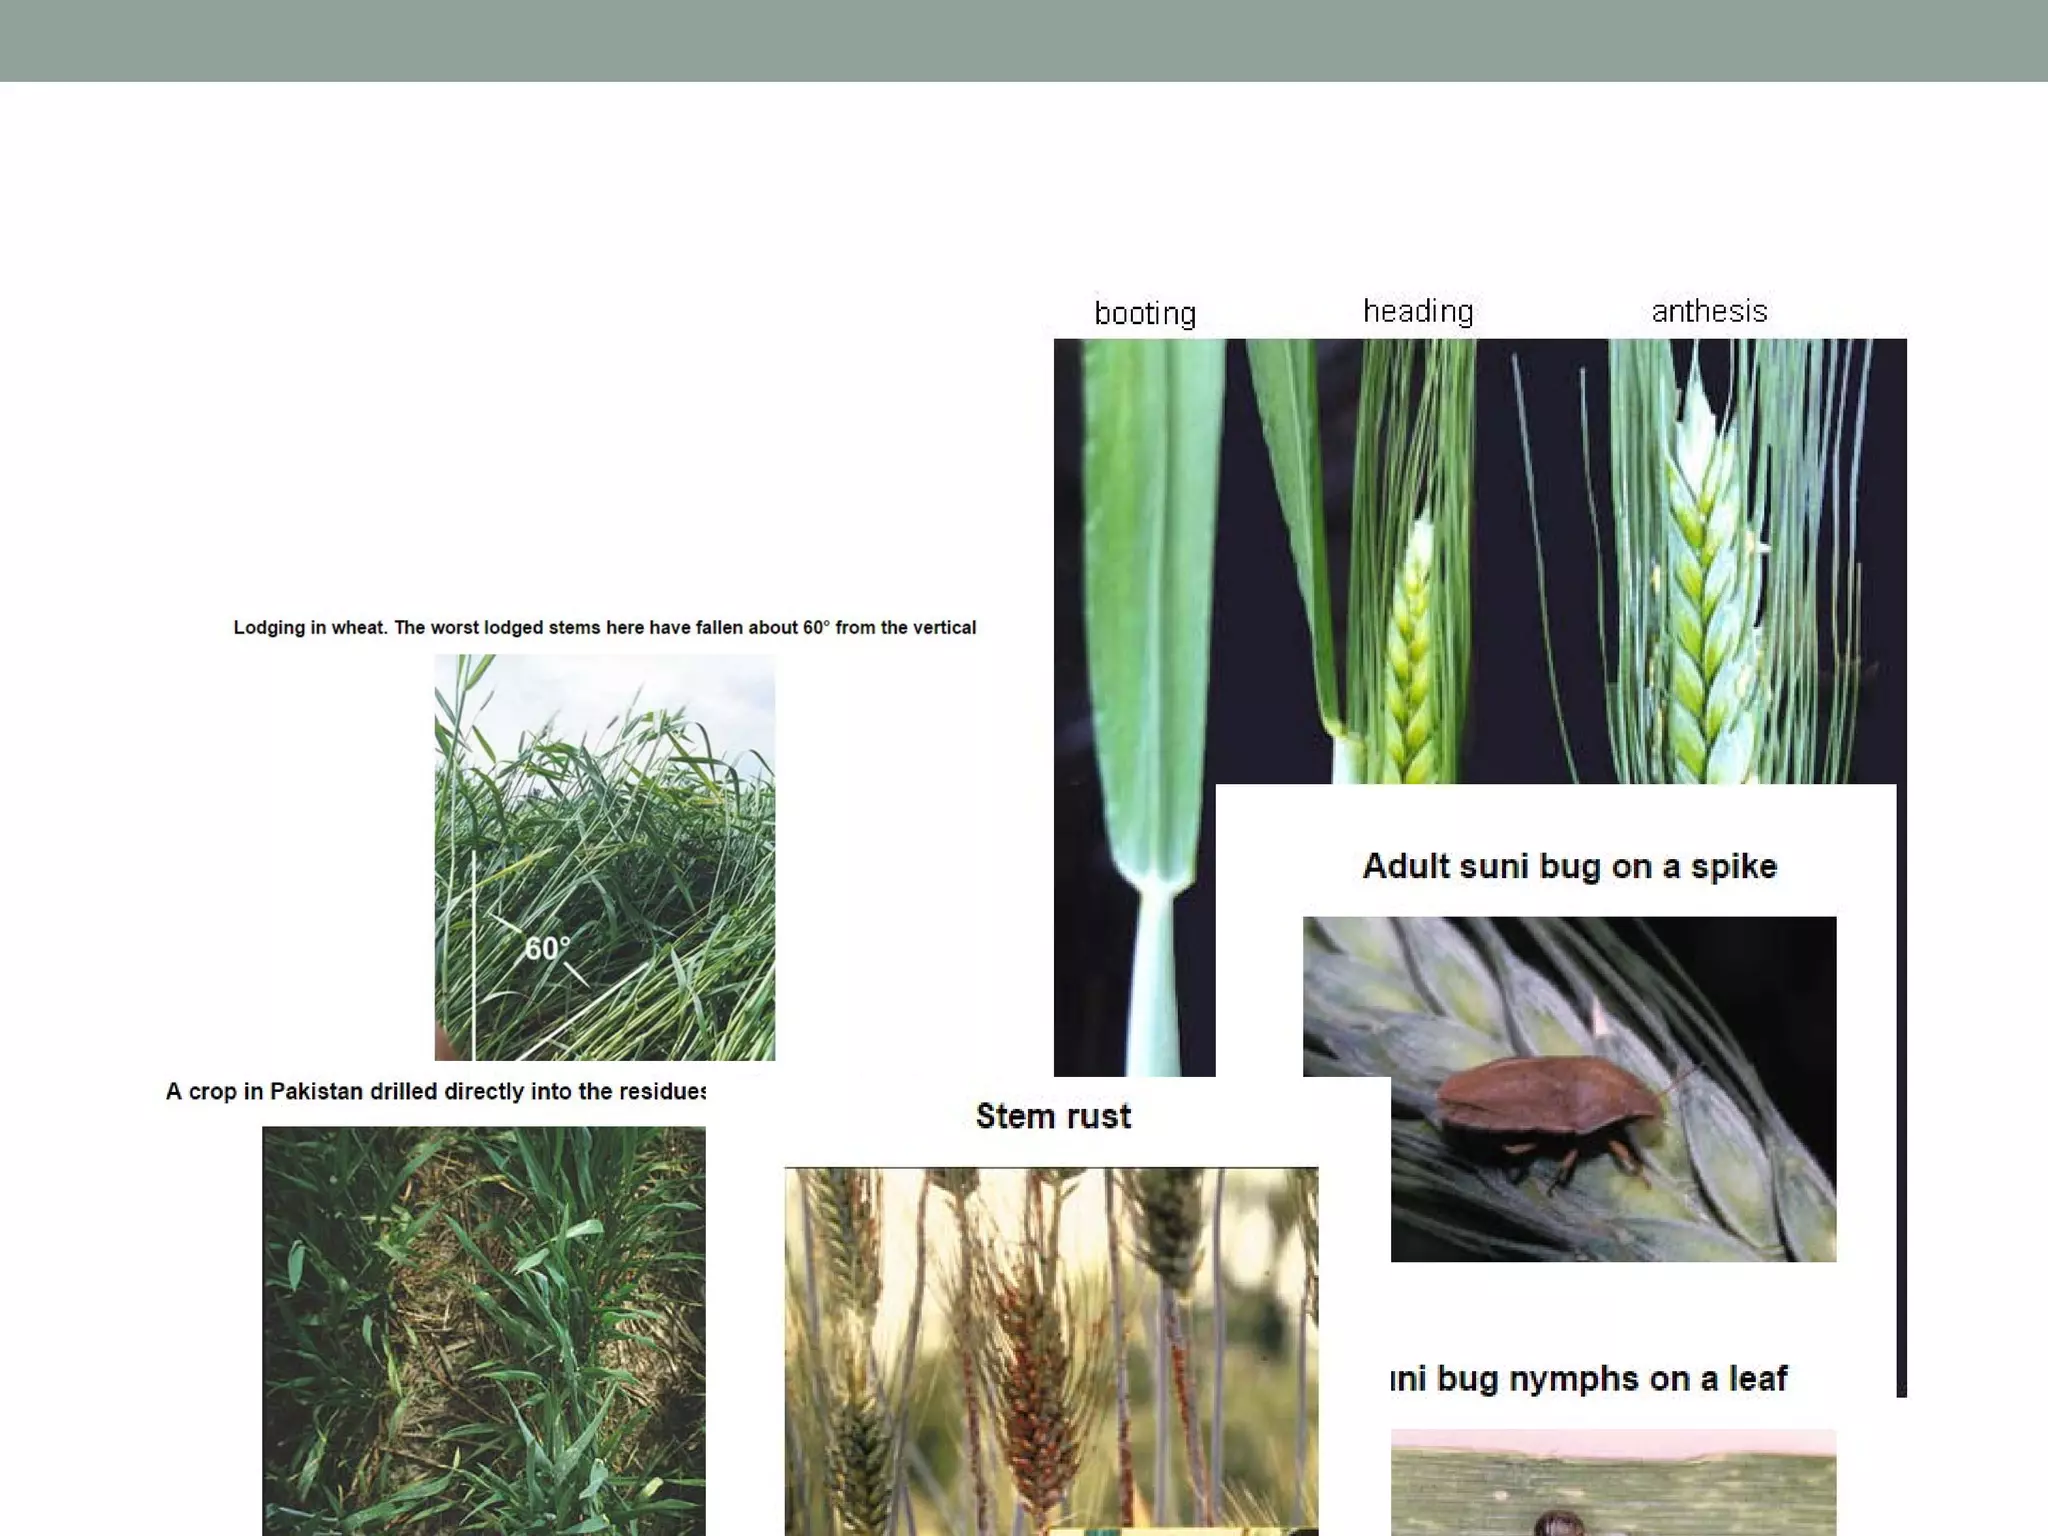
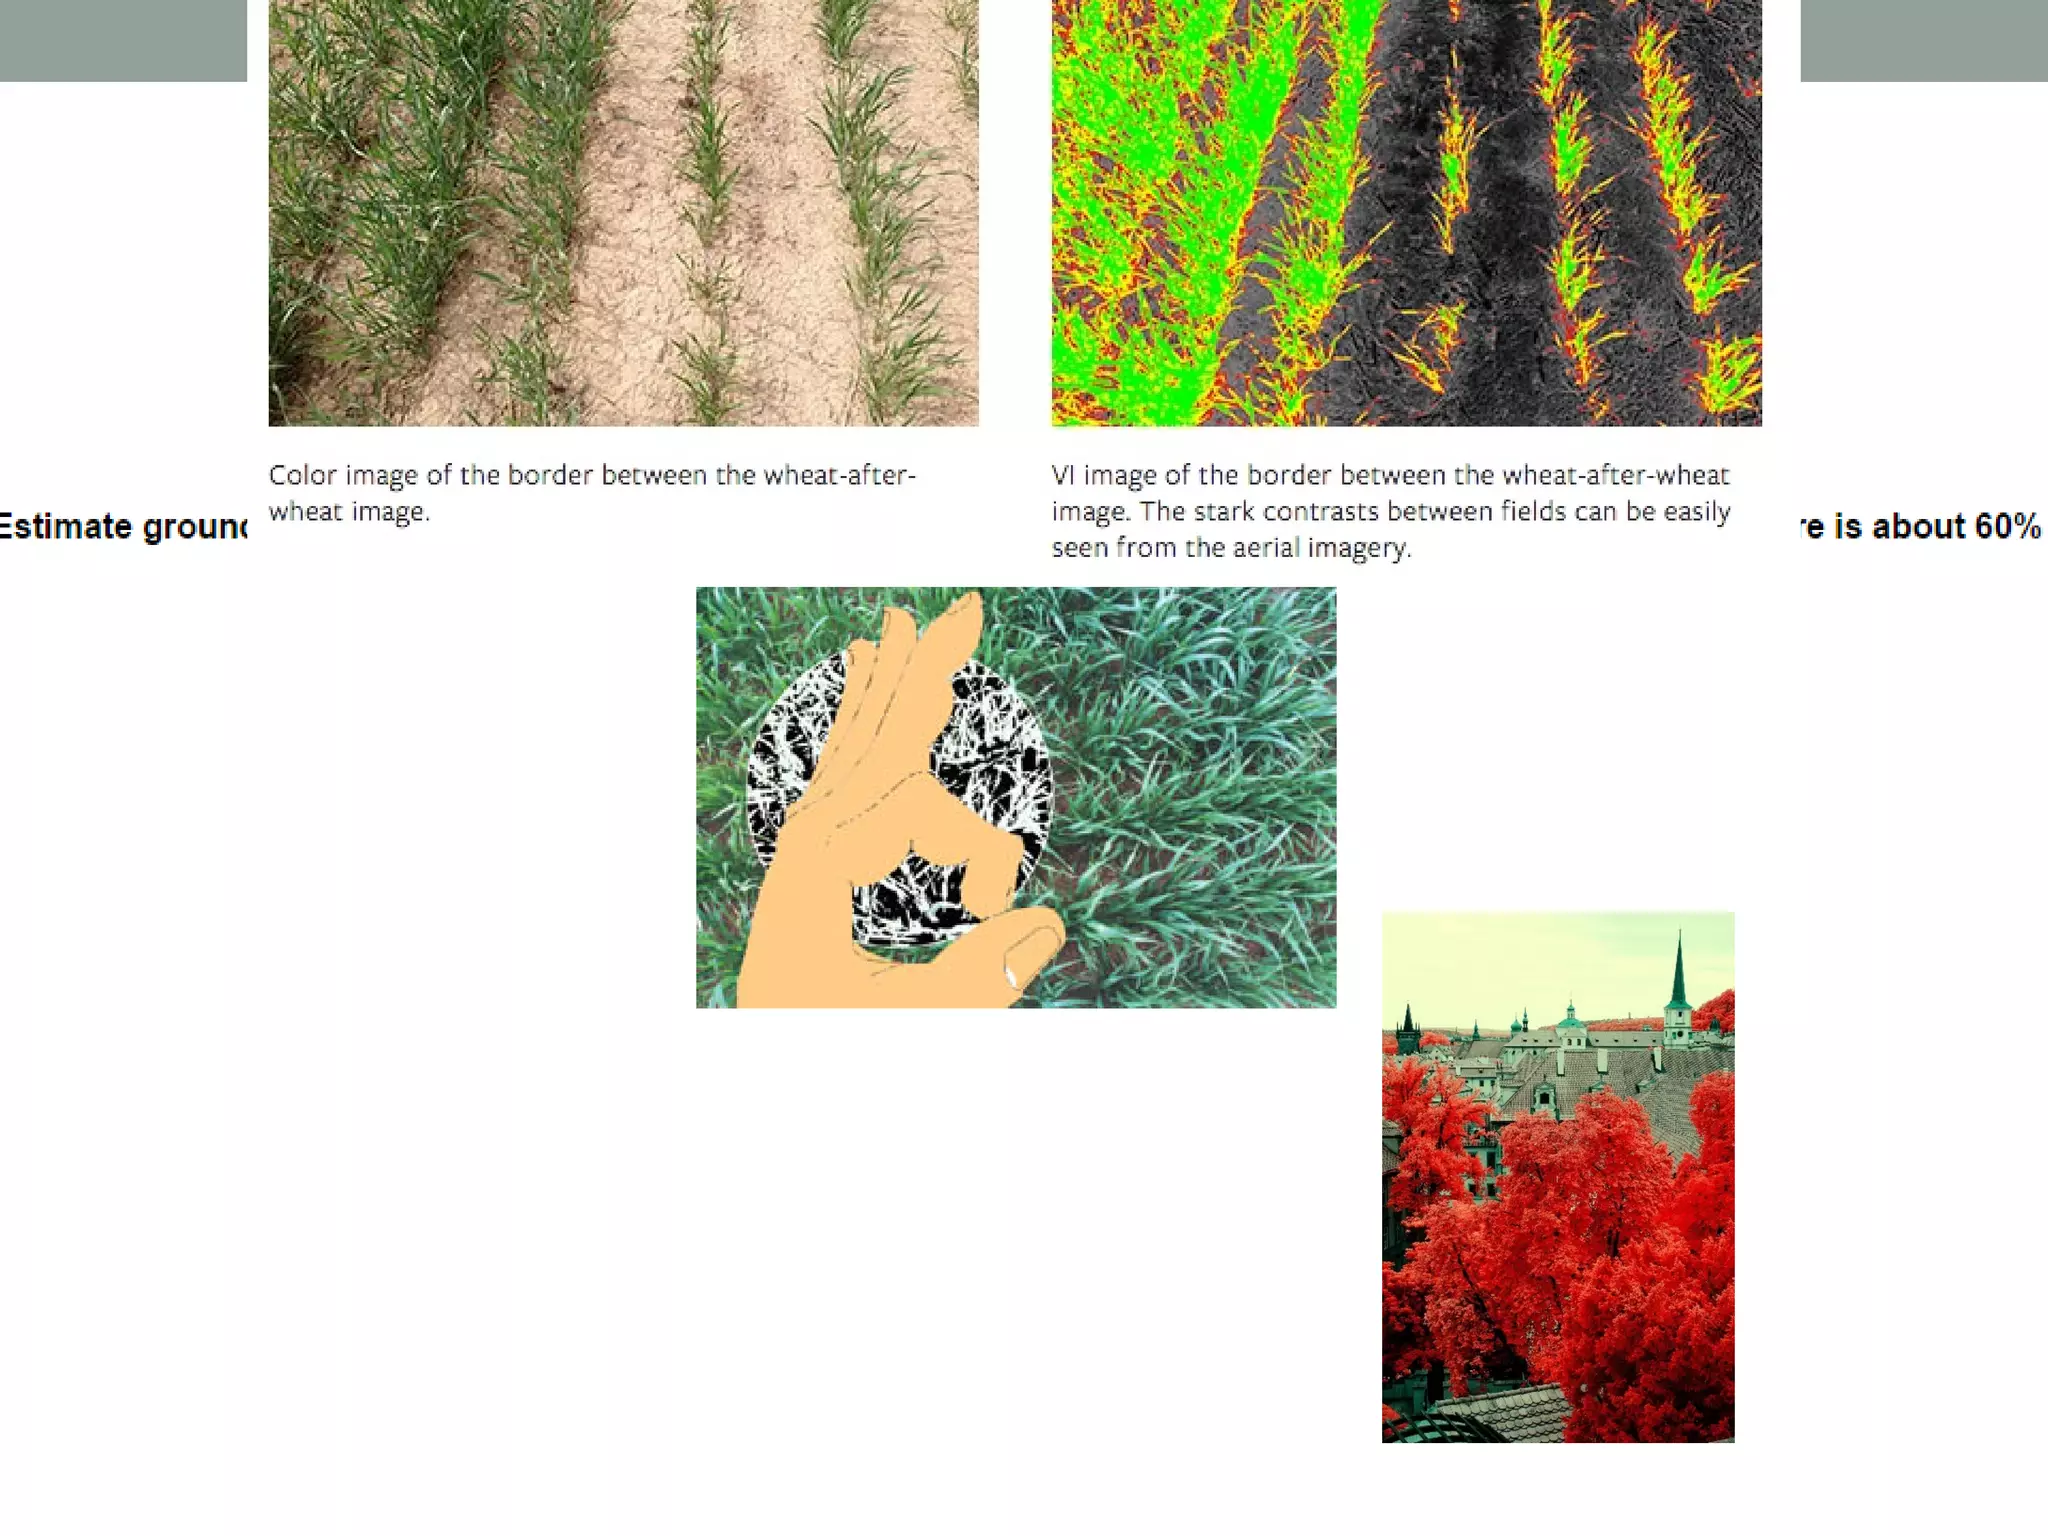
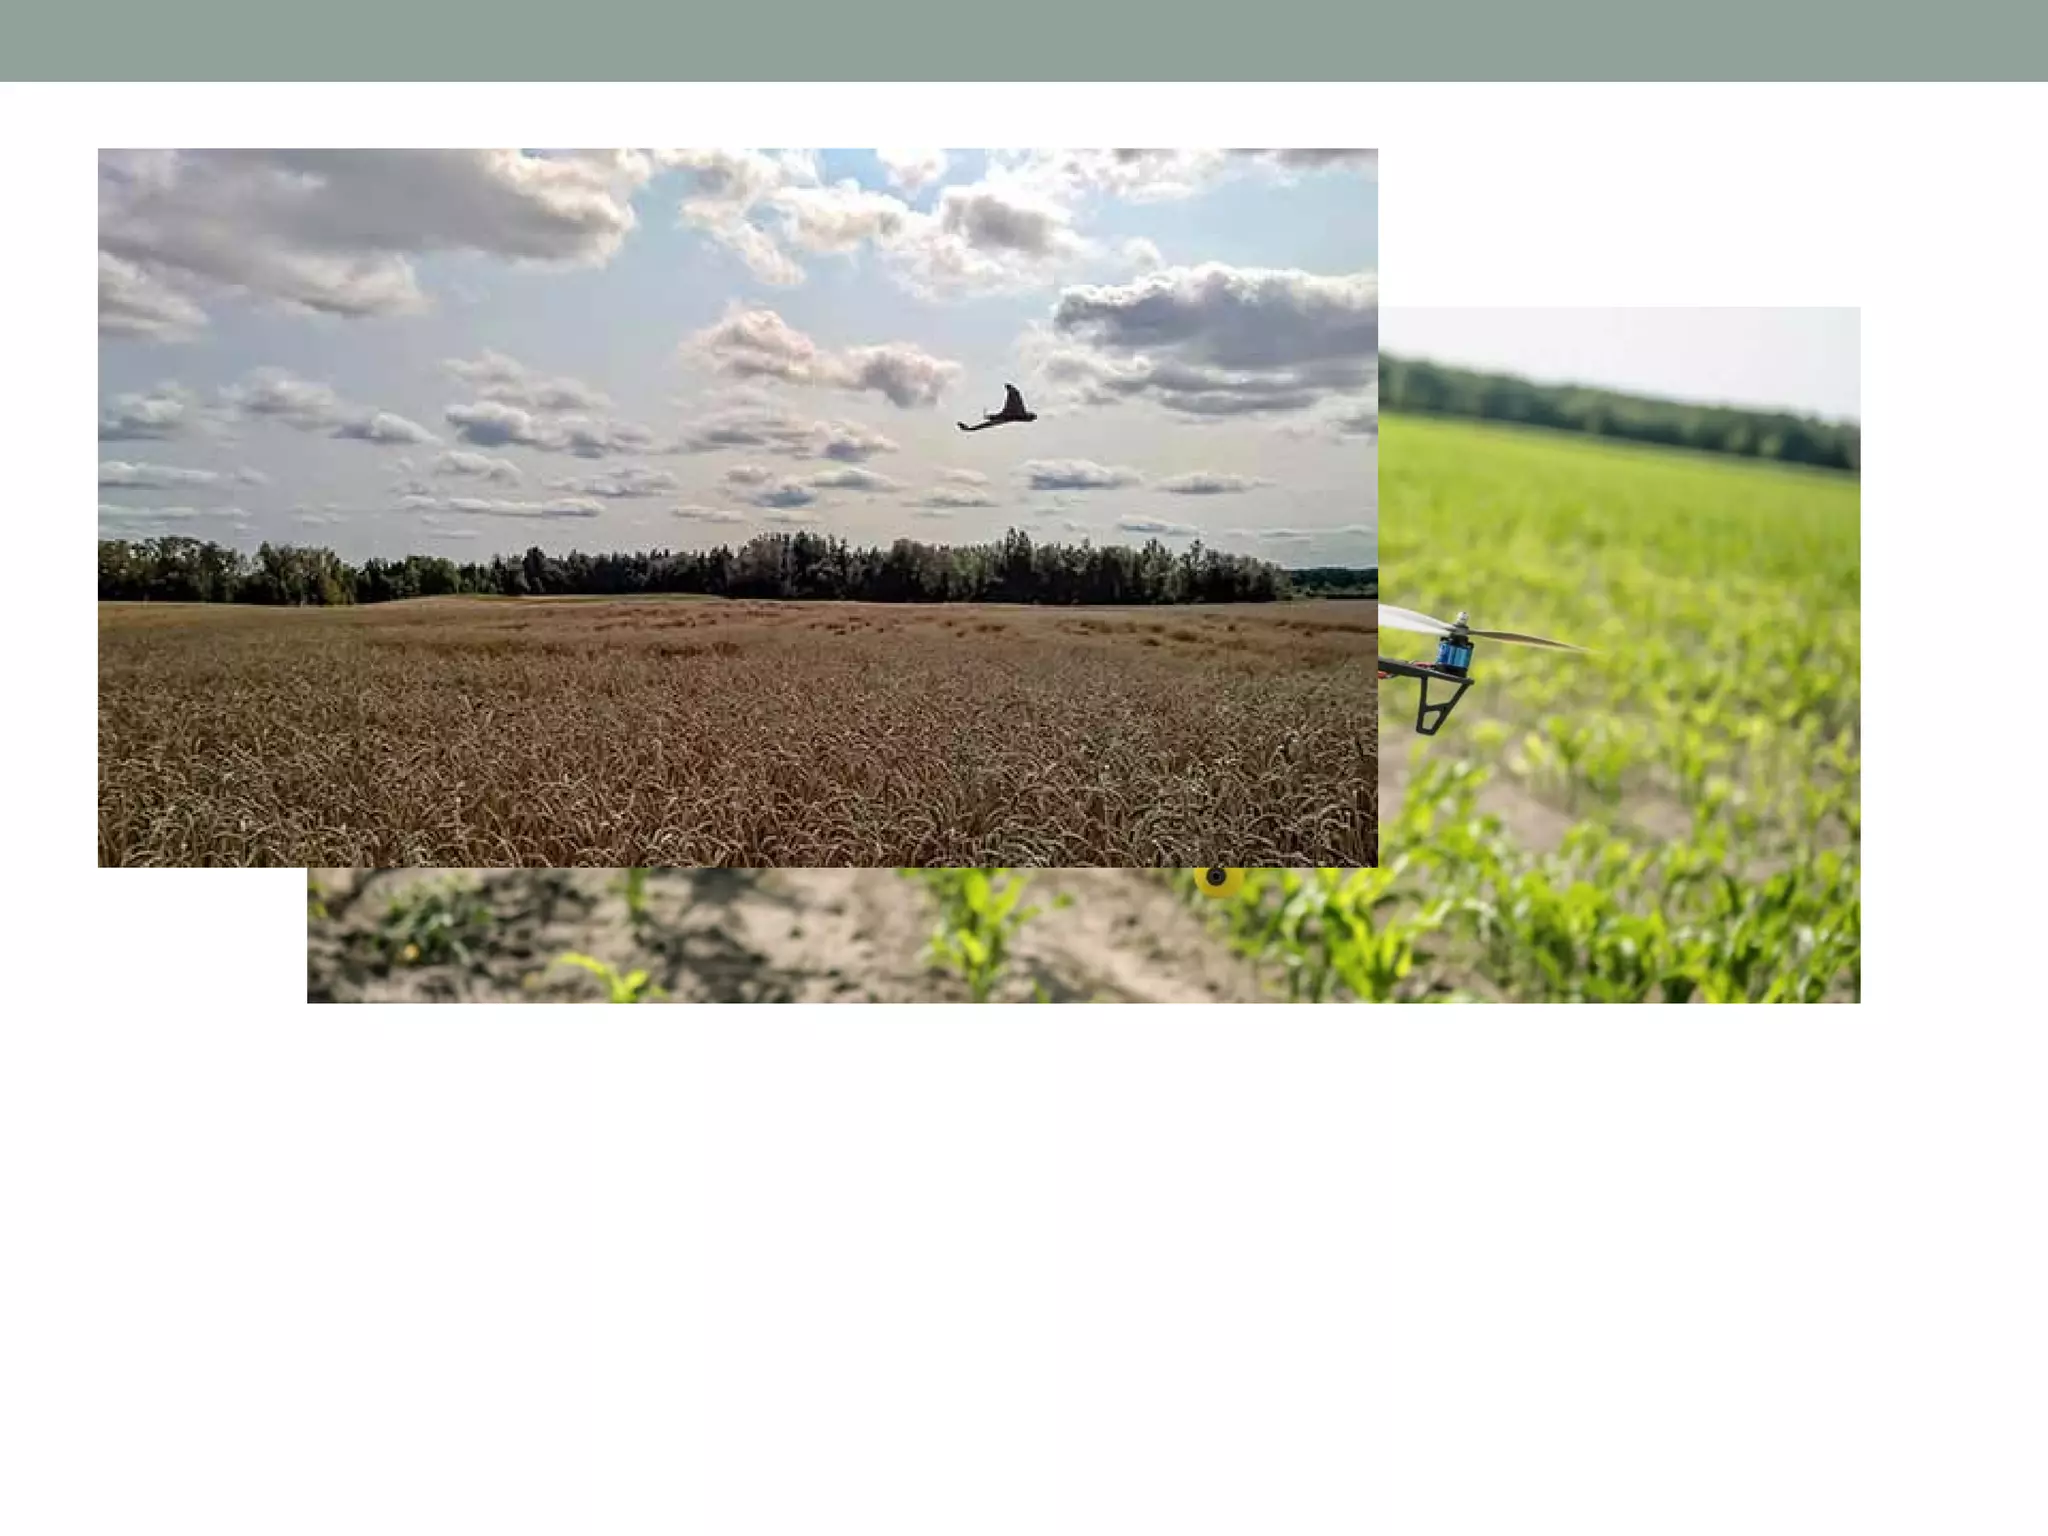
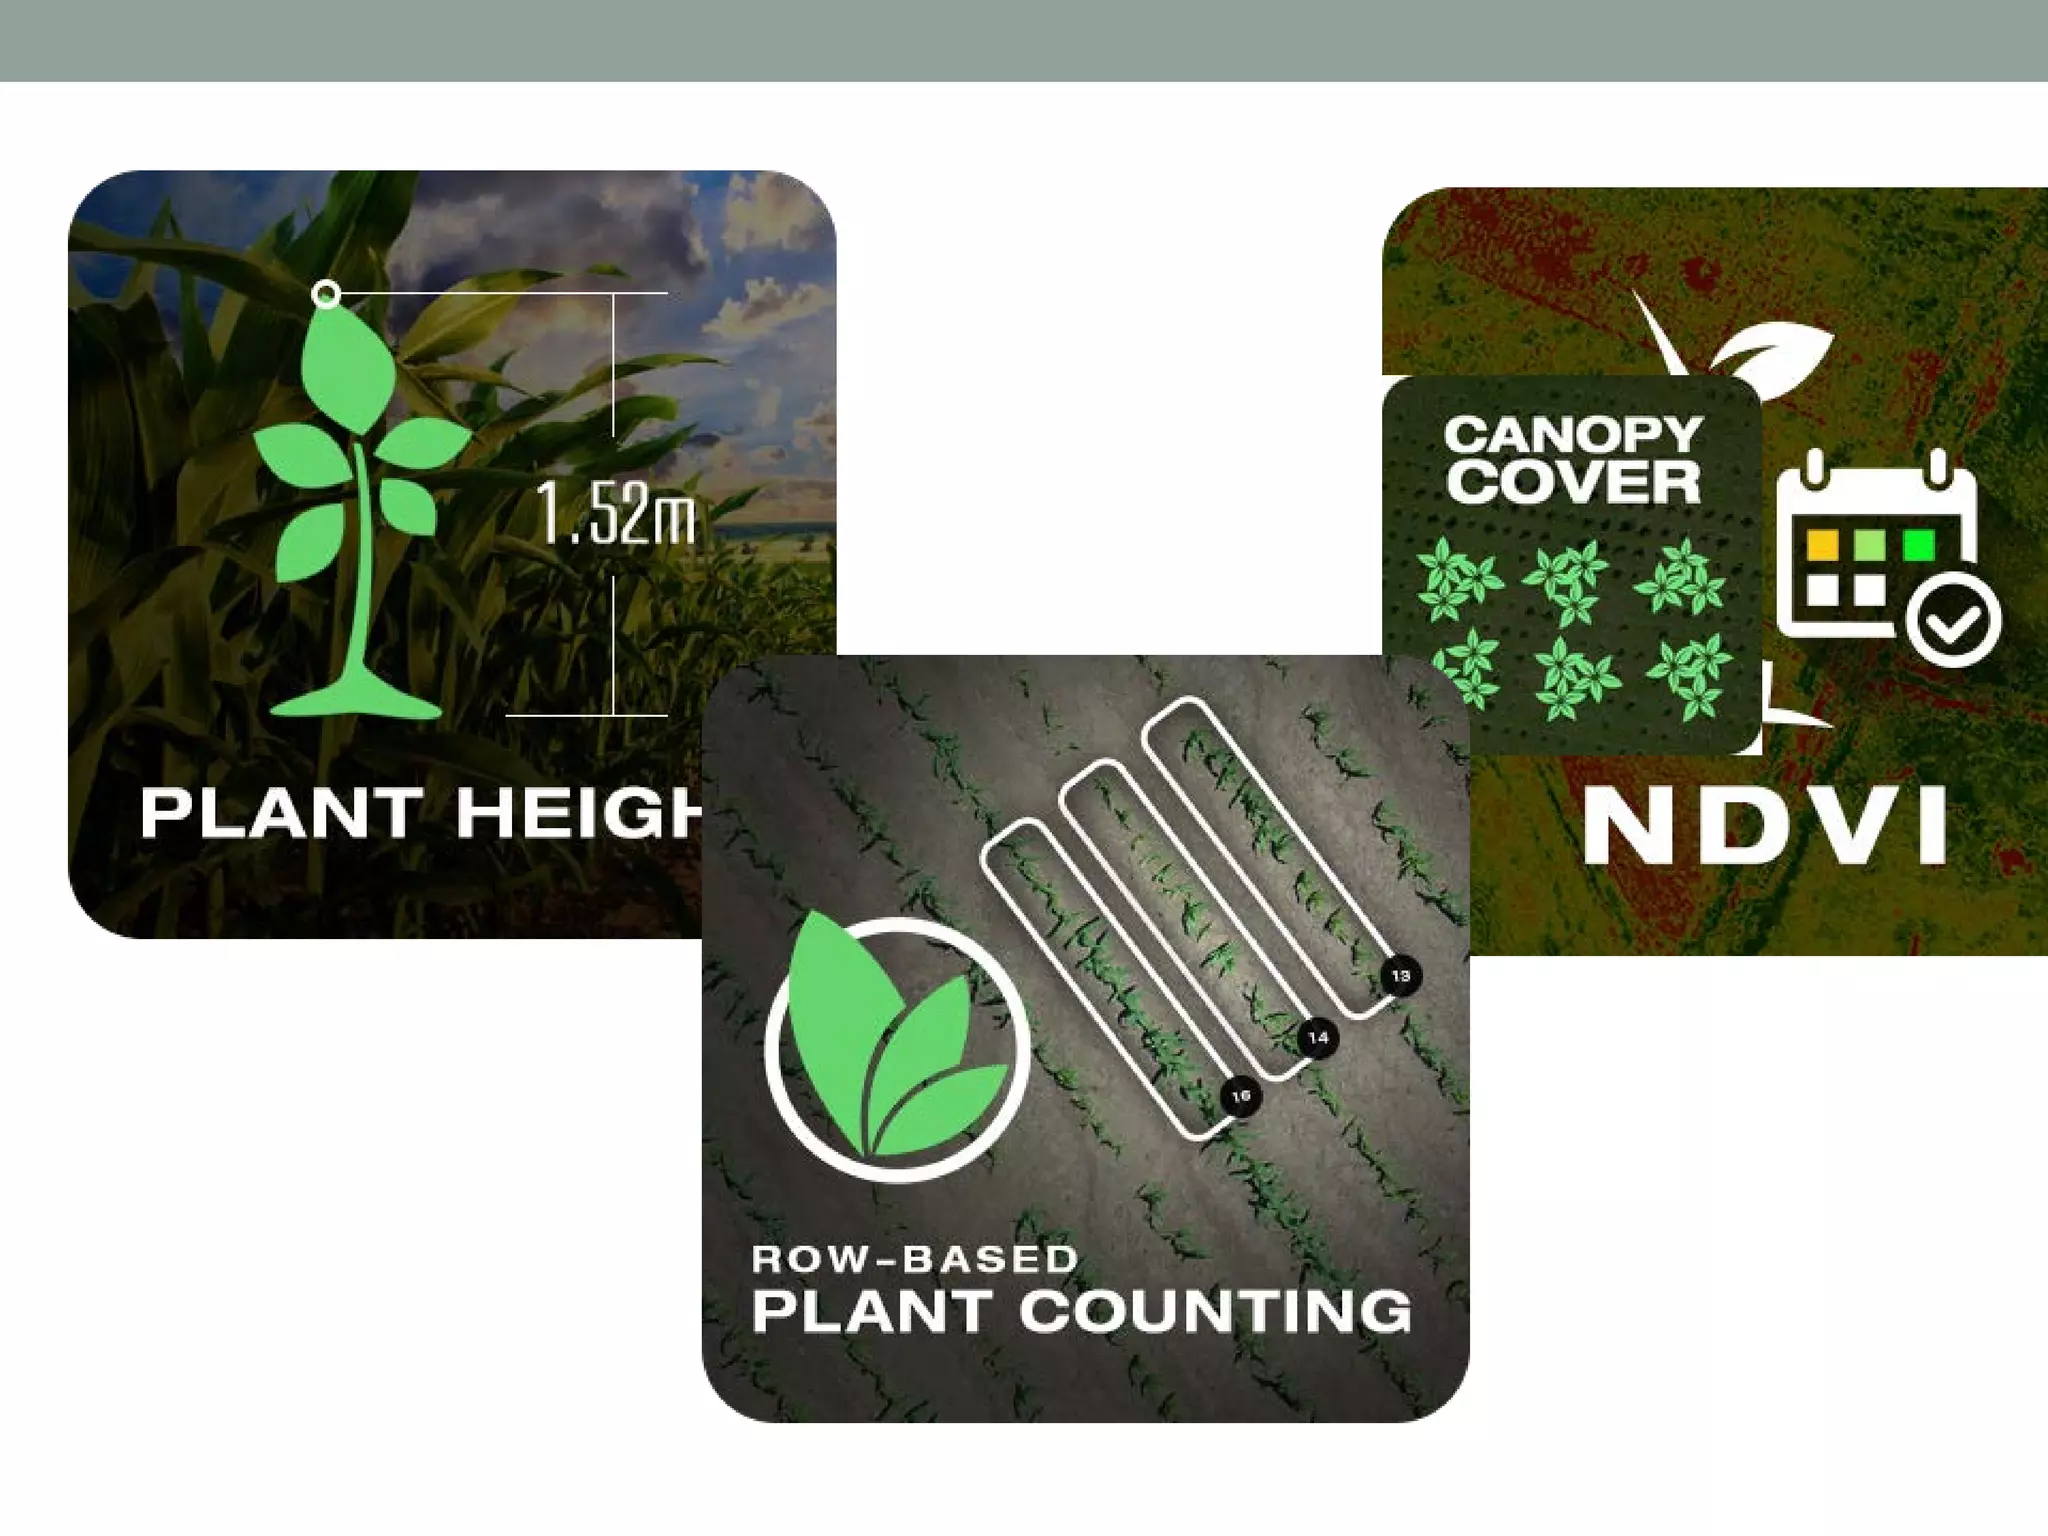
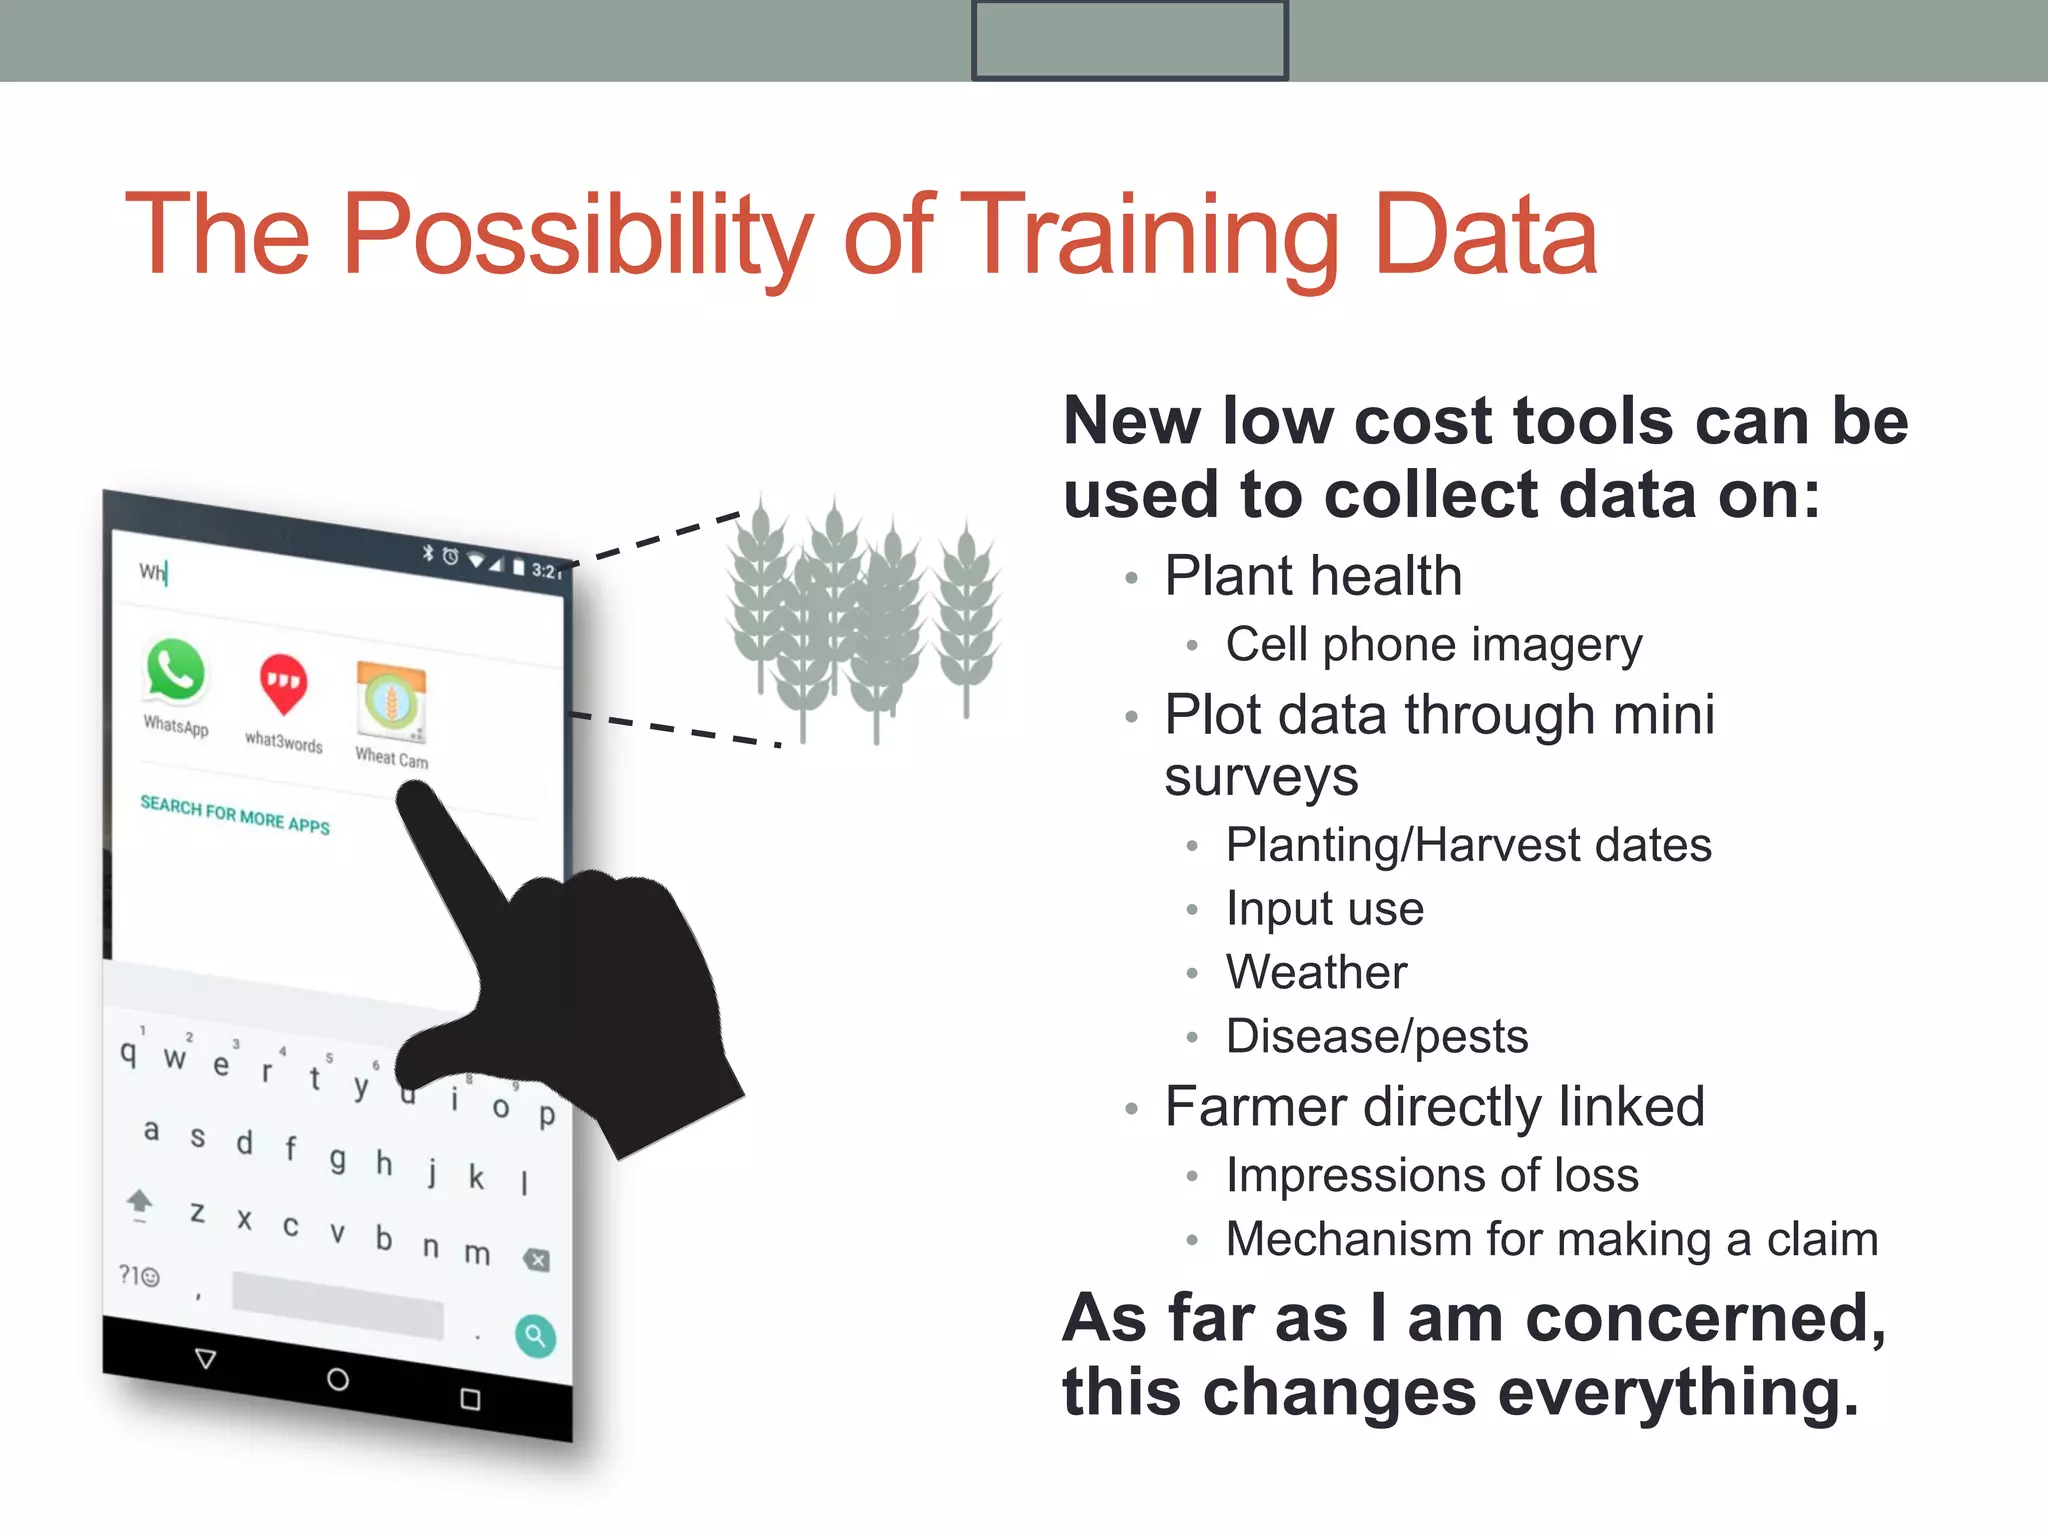
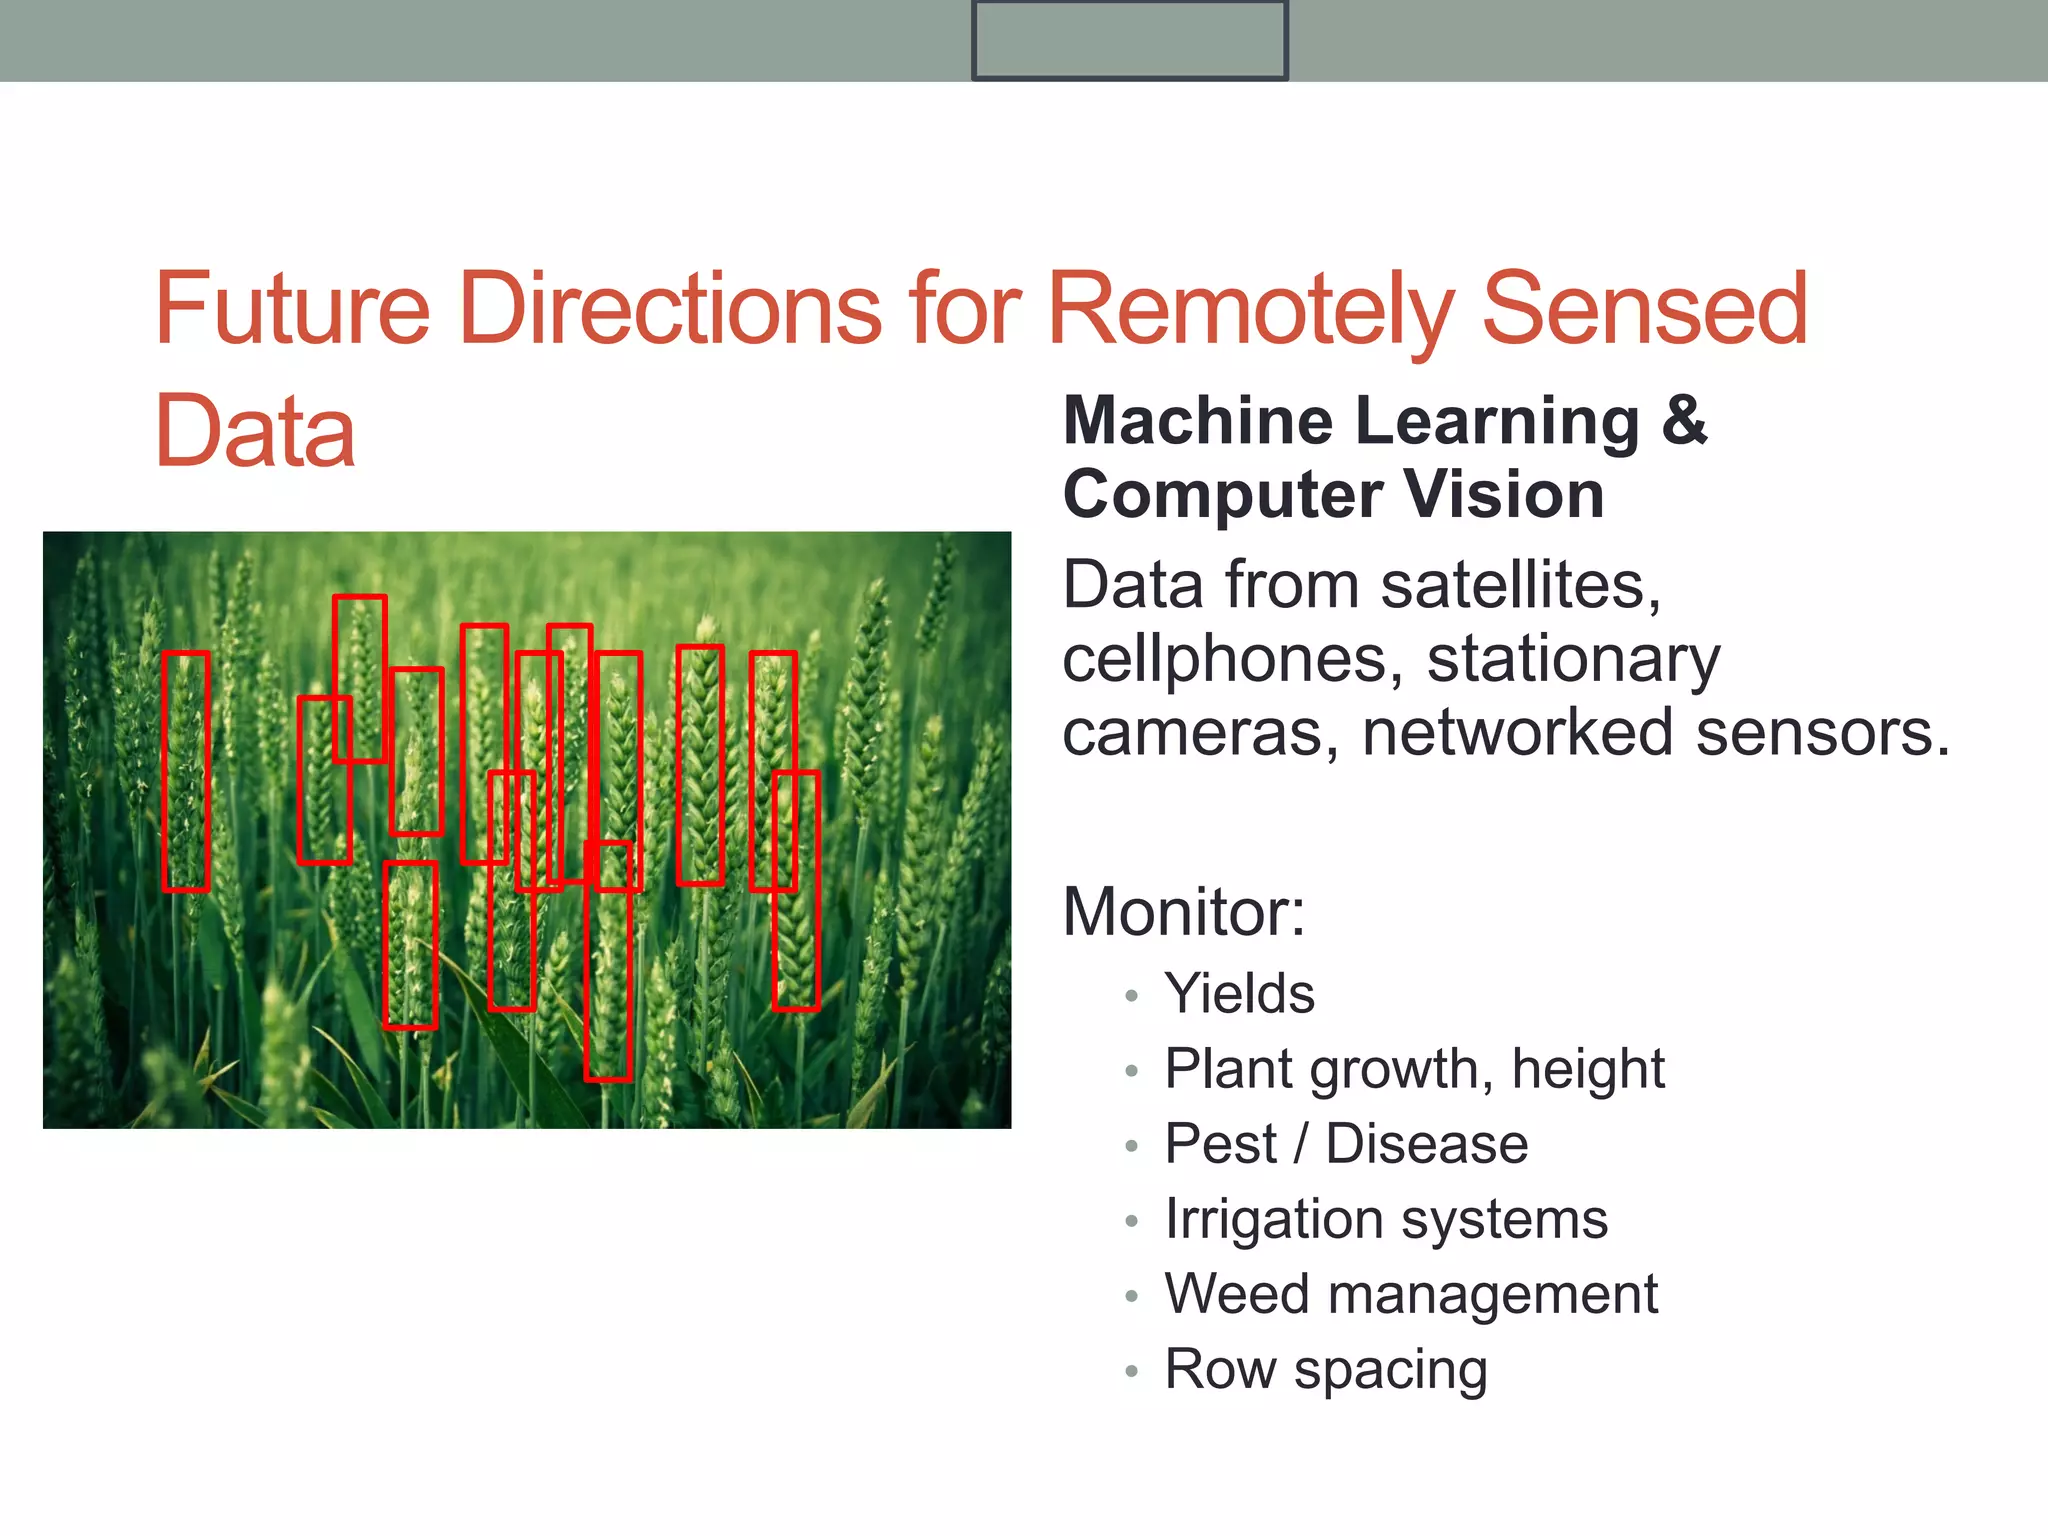

The document discusses using new technologies like satellites, drones, mobile devices, and machine learning to improve the accuracy of crop yield estimates and validation of crop cutting experiments. It outlines how various remote sensing platforms and sensors could be used to collect high-resolution plant characteristic data on factors like plant height, density, and health. Computer vision techniques on cell phone imagery could also count grains and flag disease. The data collected could help address sources of bias in traditional crop cuts and potentially generate more accurate yield estimates and loss assessments through machine learning models trained on the diverse data sources.


