Downloaded 17 times
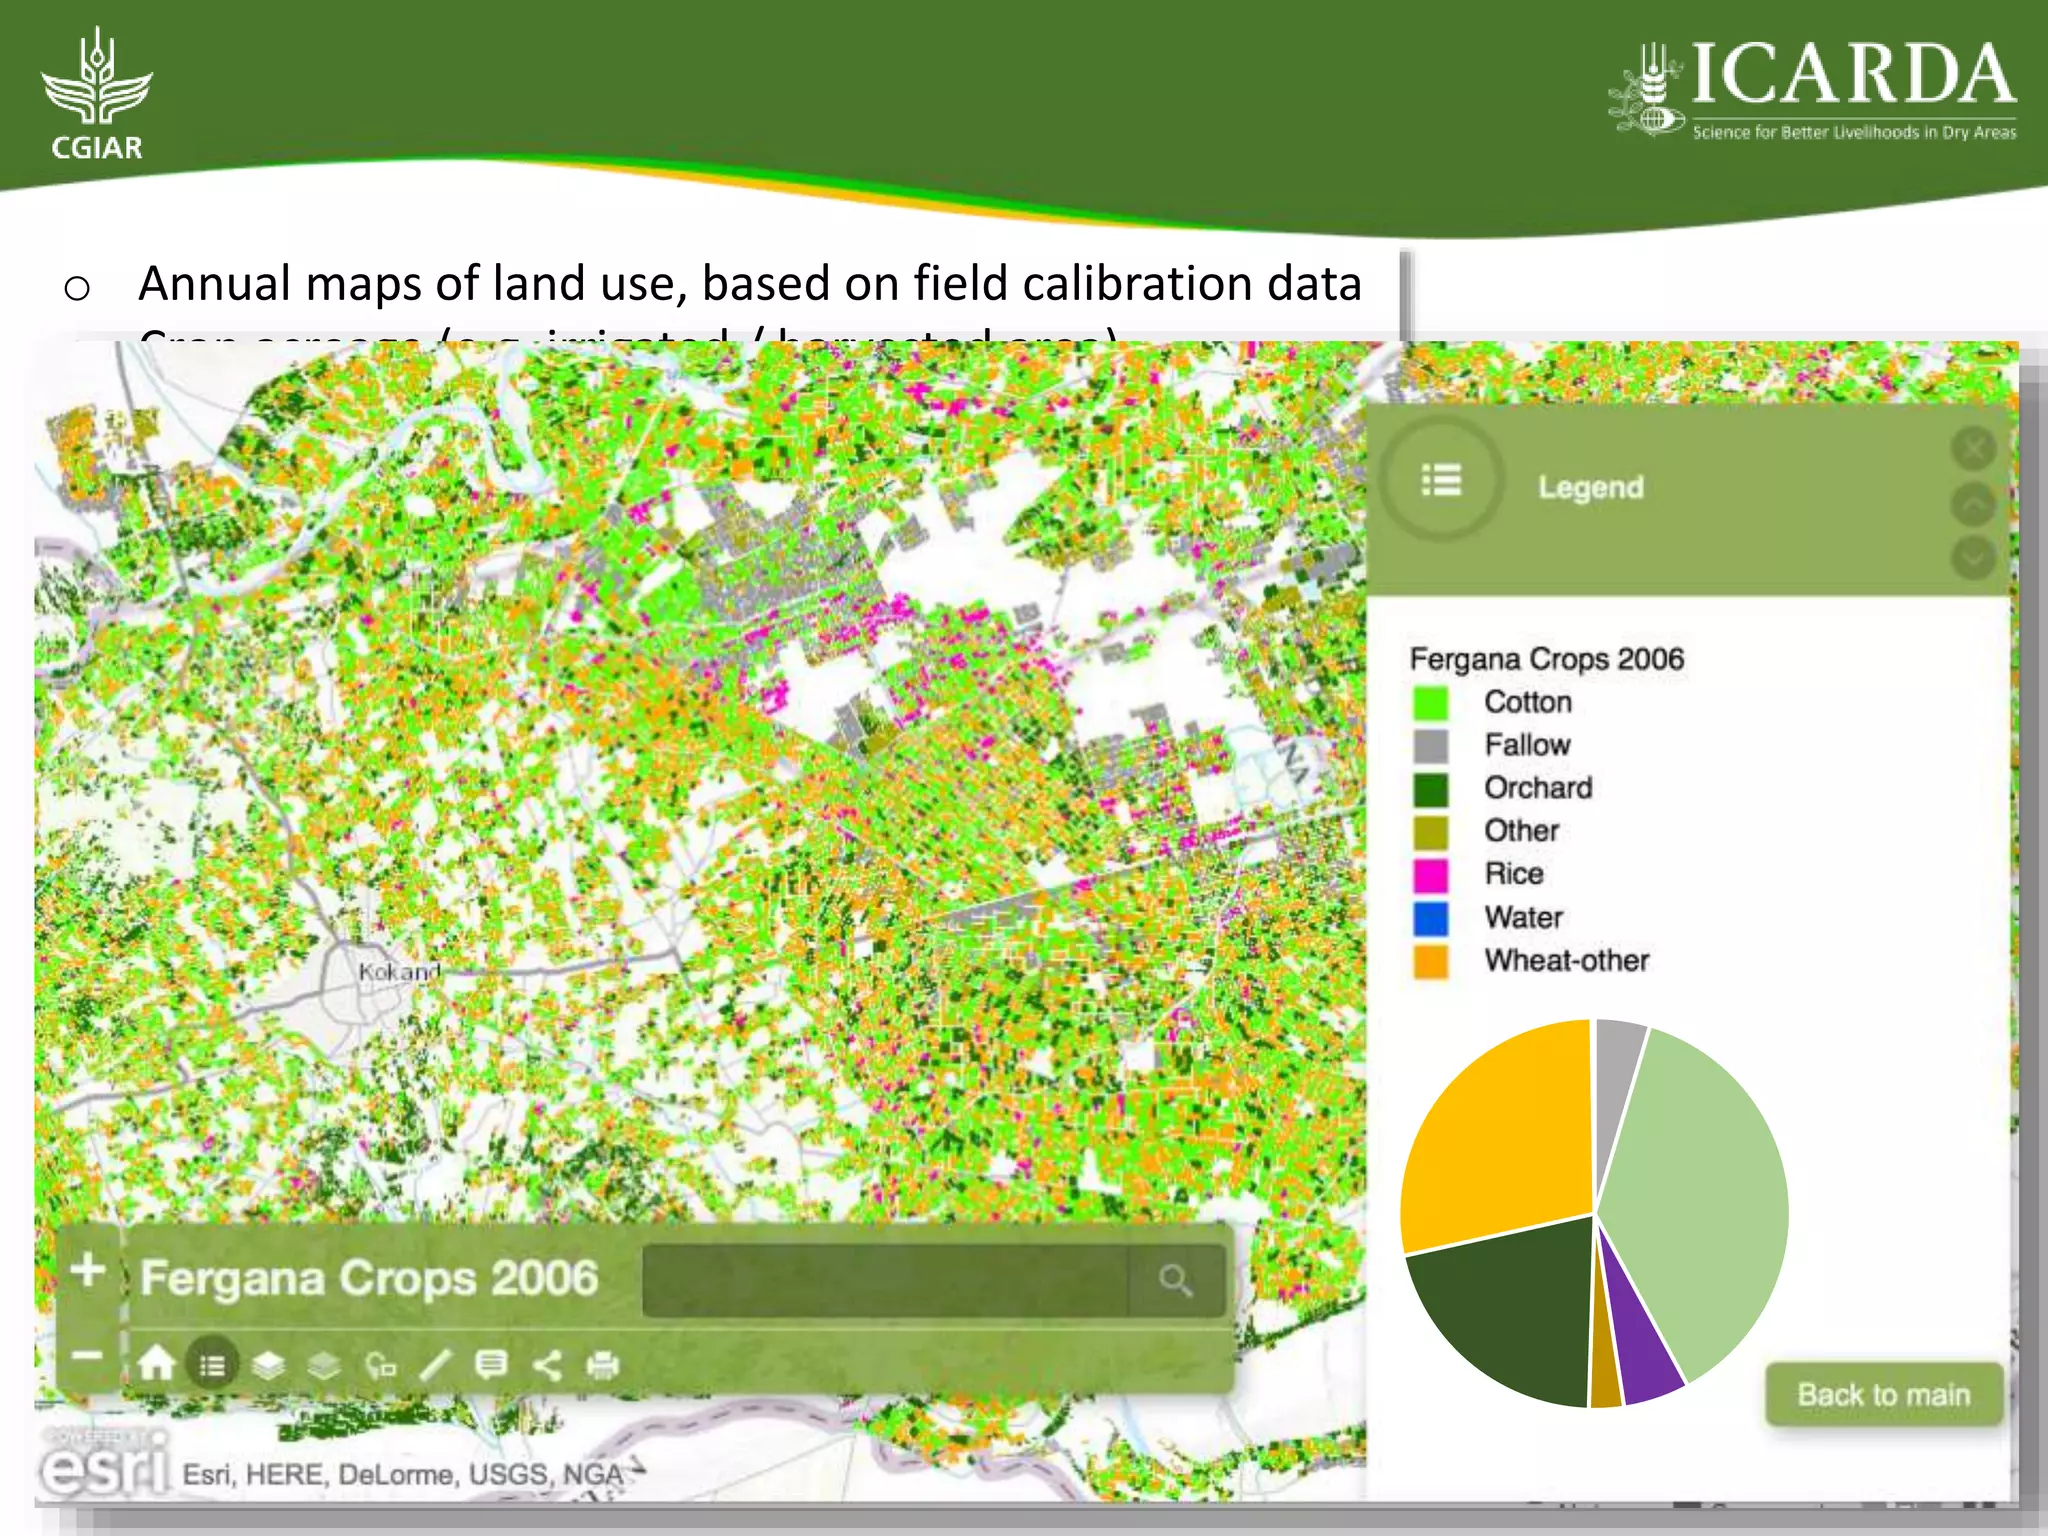
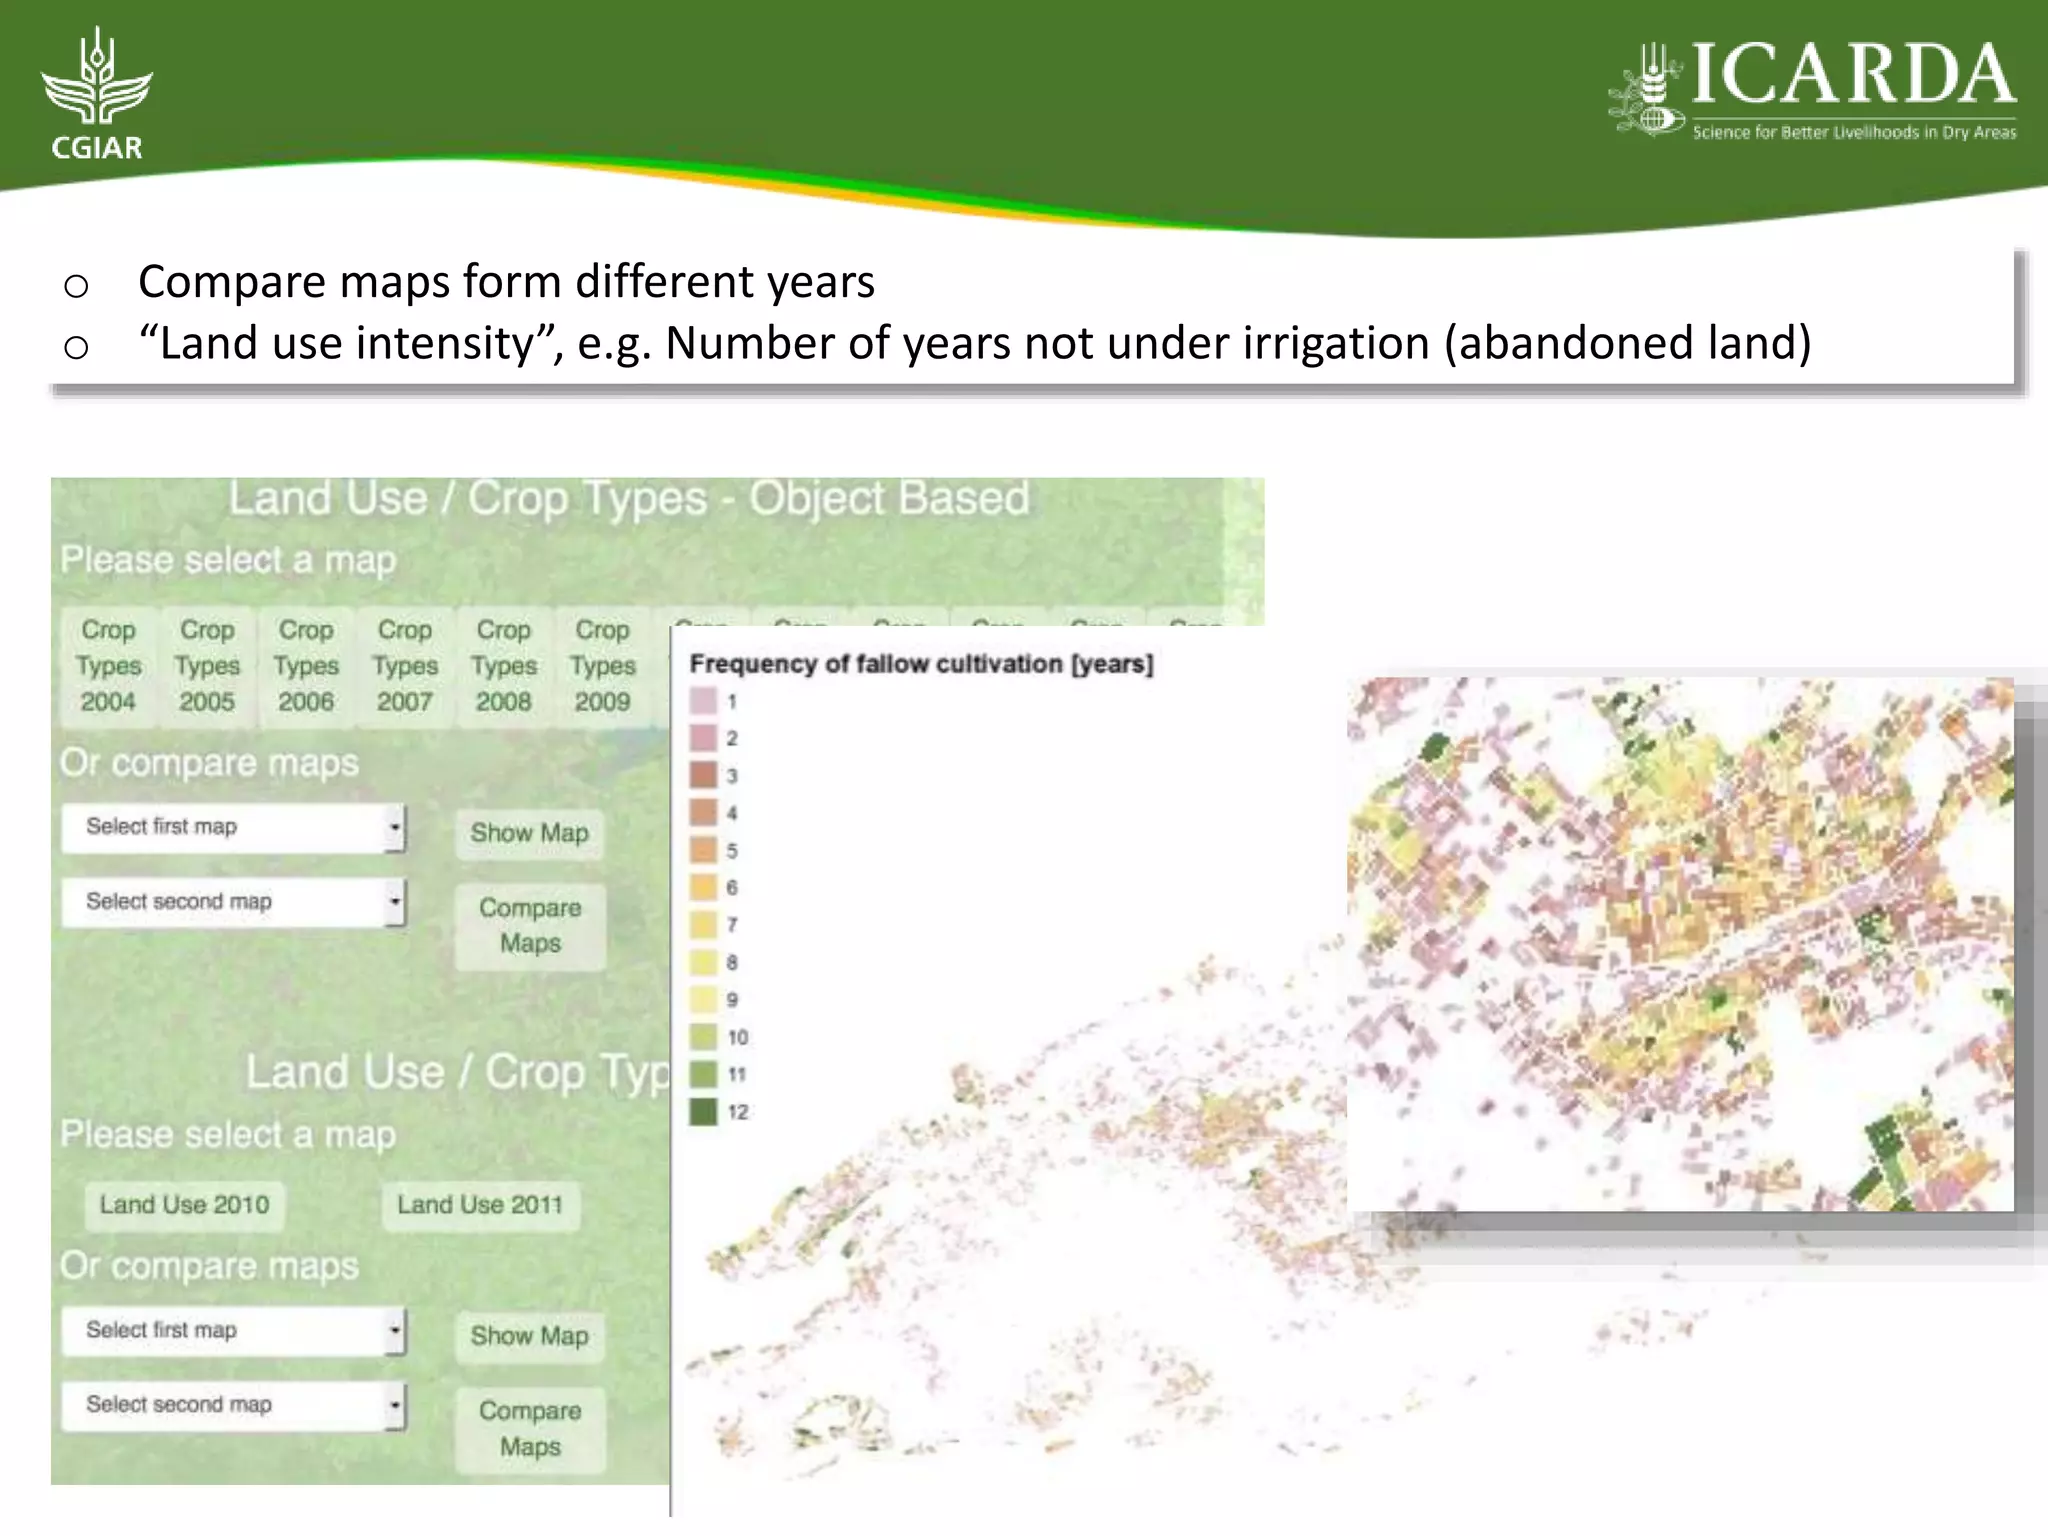
![o Aggregate statistics (e.g. administrative units: oblast, rayon)
o Change in acreage across observation years
o Outlook: user defined zones (polygons), water distribution
(“Planning zones”, WUA, smaller channel levels UIS…)
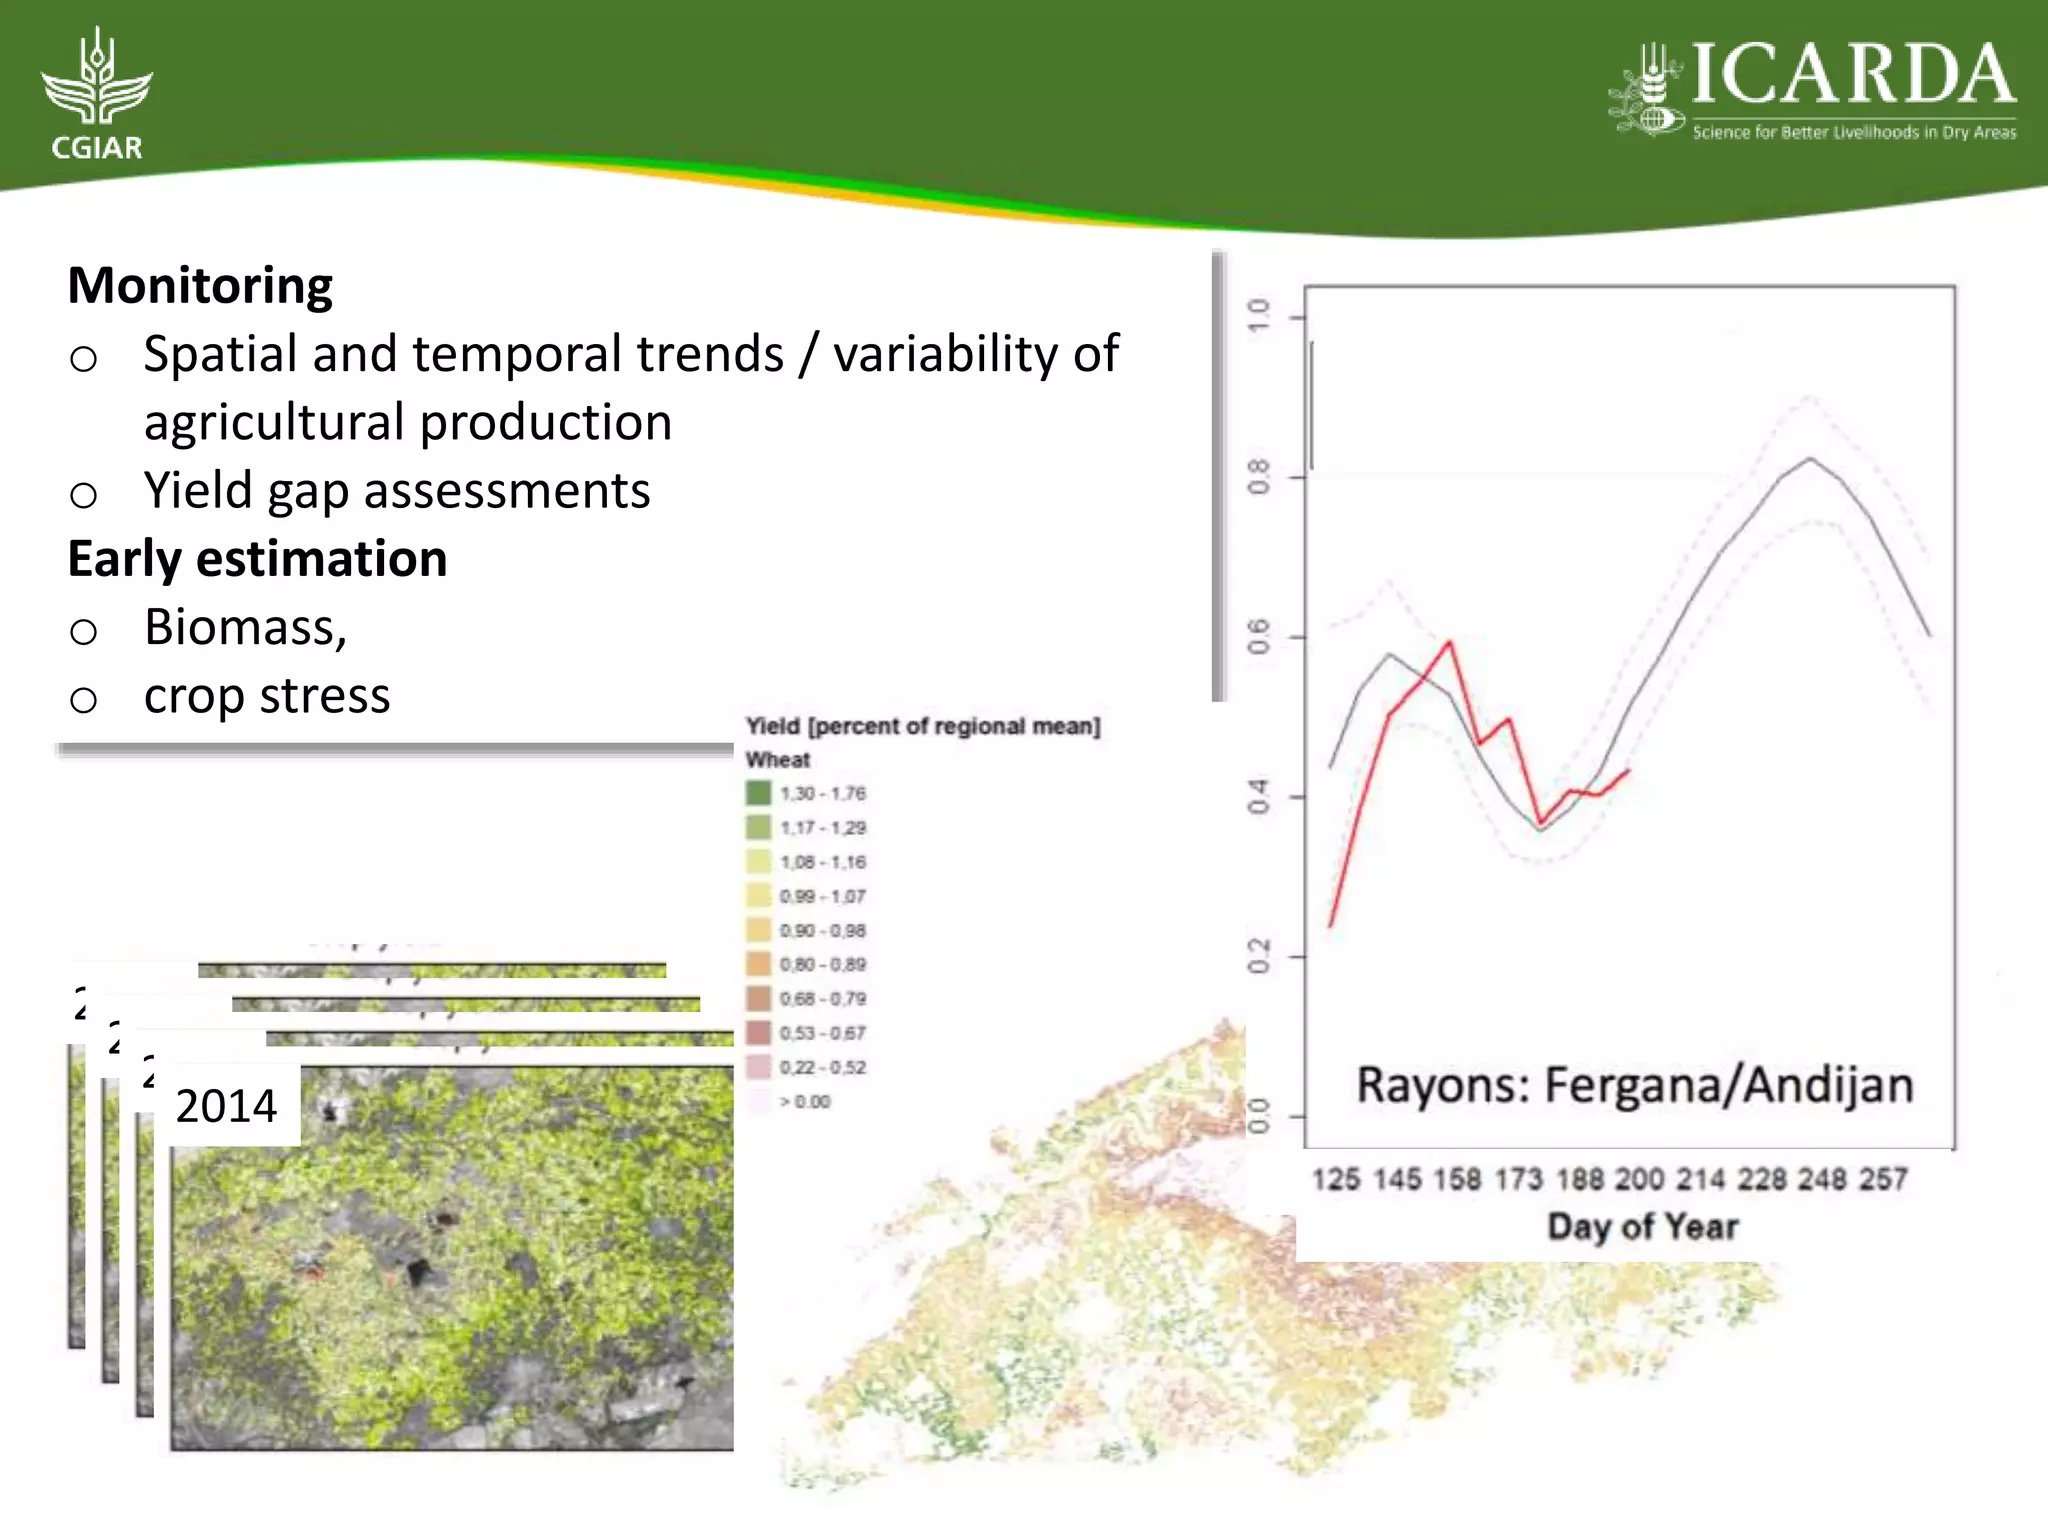
2010
2011
2012
2013
0
0.05
0.1
0.15
0.2
0.25
0.3
0.35
0.4
0.45
2004 2005 2006 2007 2008 2009 2010 2011 2012 2013 2014 2015
Proportioncultivatedarea[%]
Cotton Wheat-other](https://image.slidesharecdn.com/04-160920152234/75/Geospatial-Science-Technology-and-Application-in-Agro-Ecosystem-Research-10-2048.jpg)

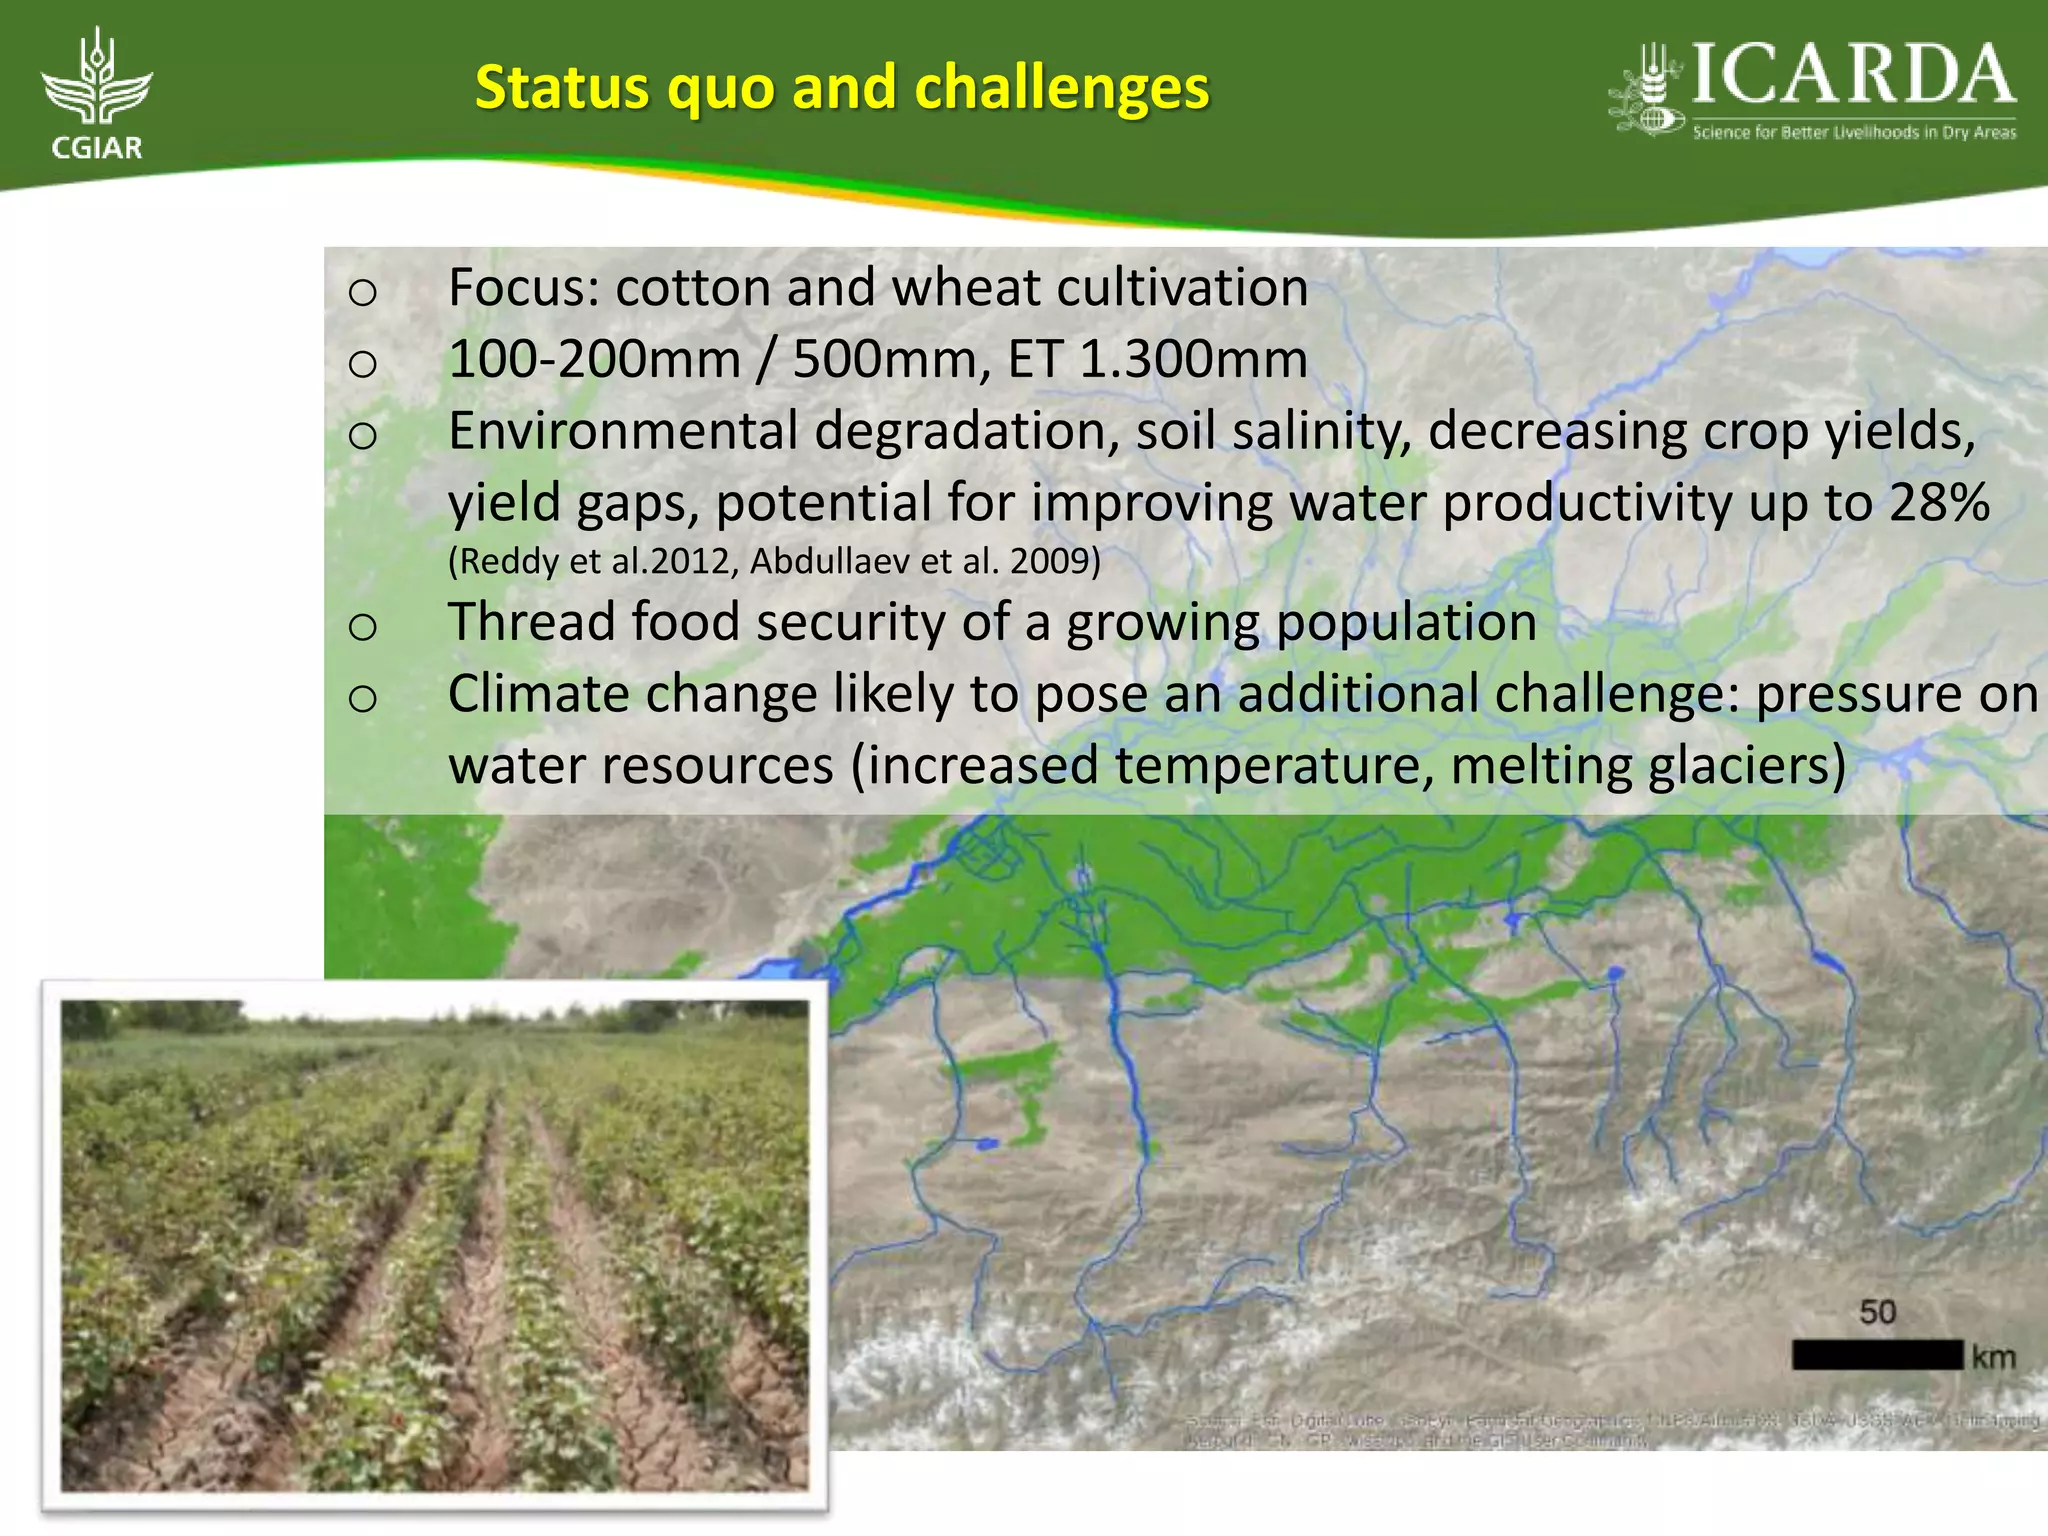
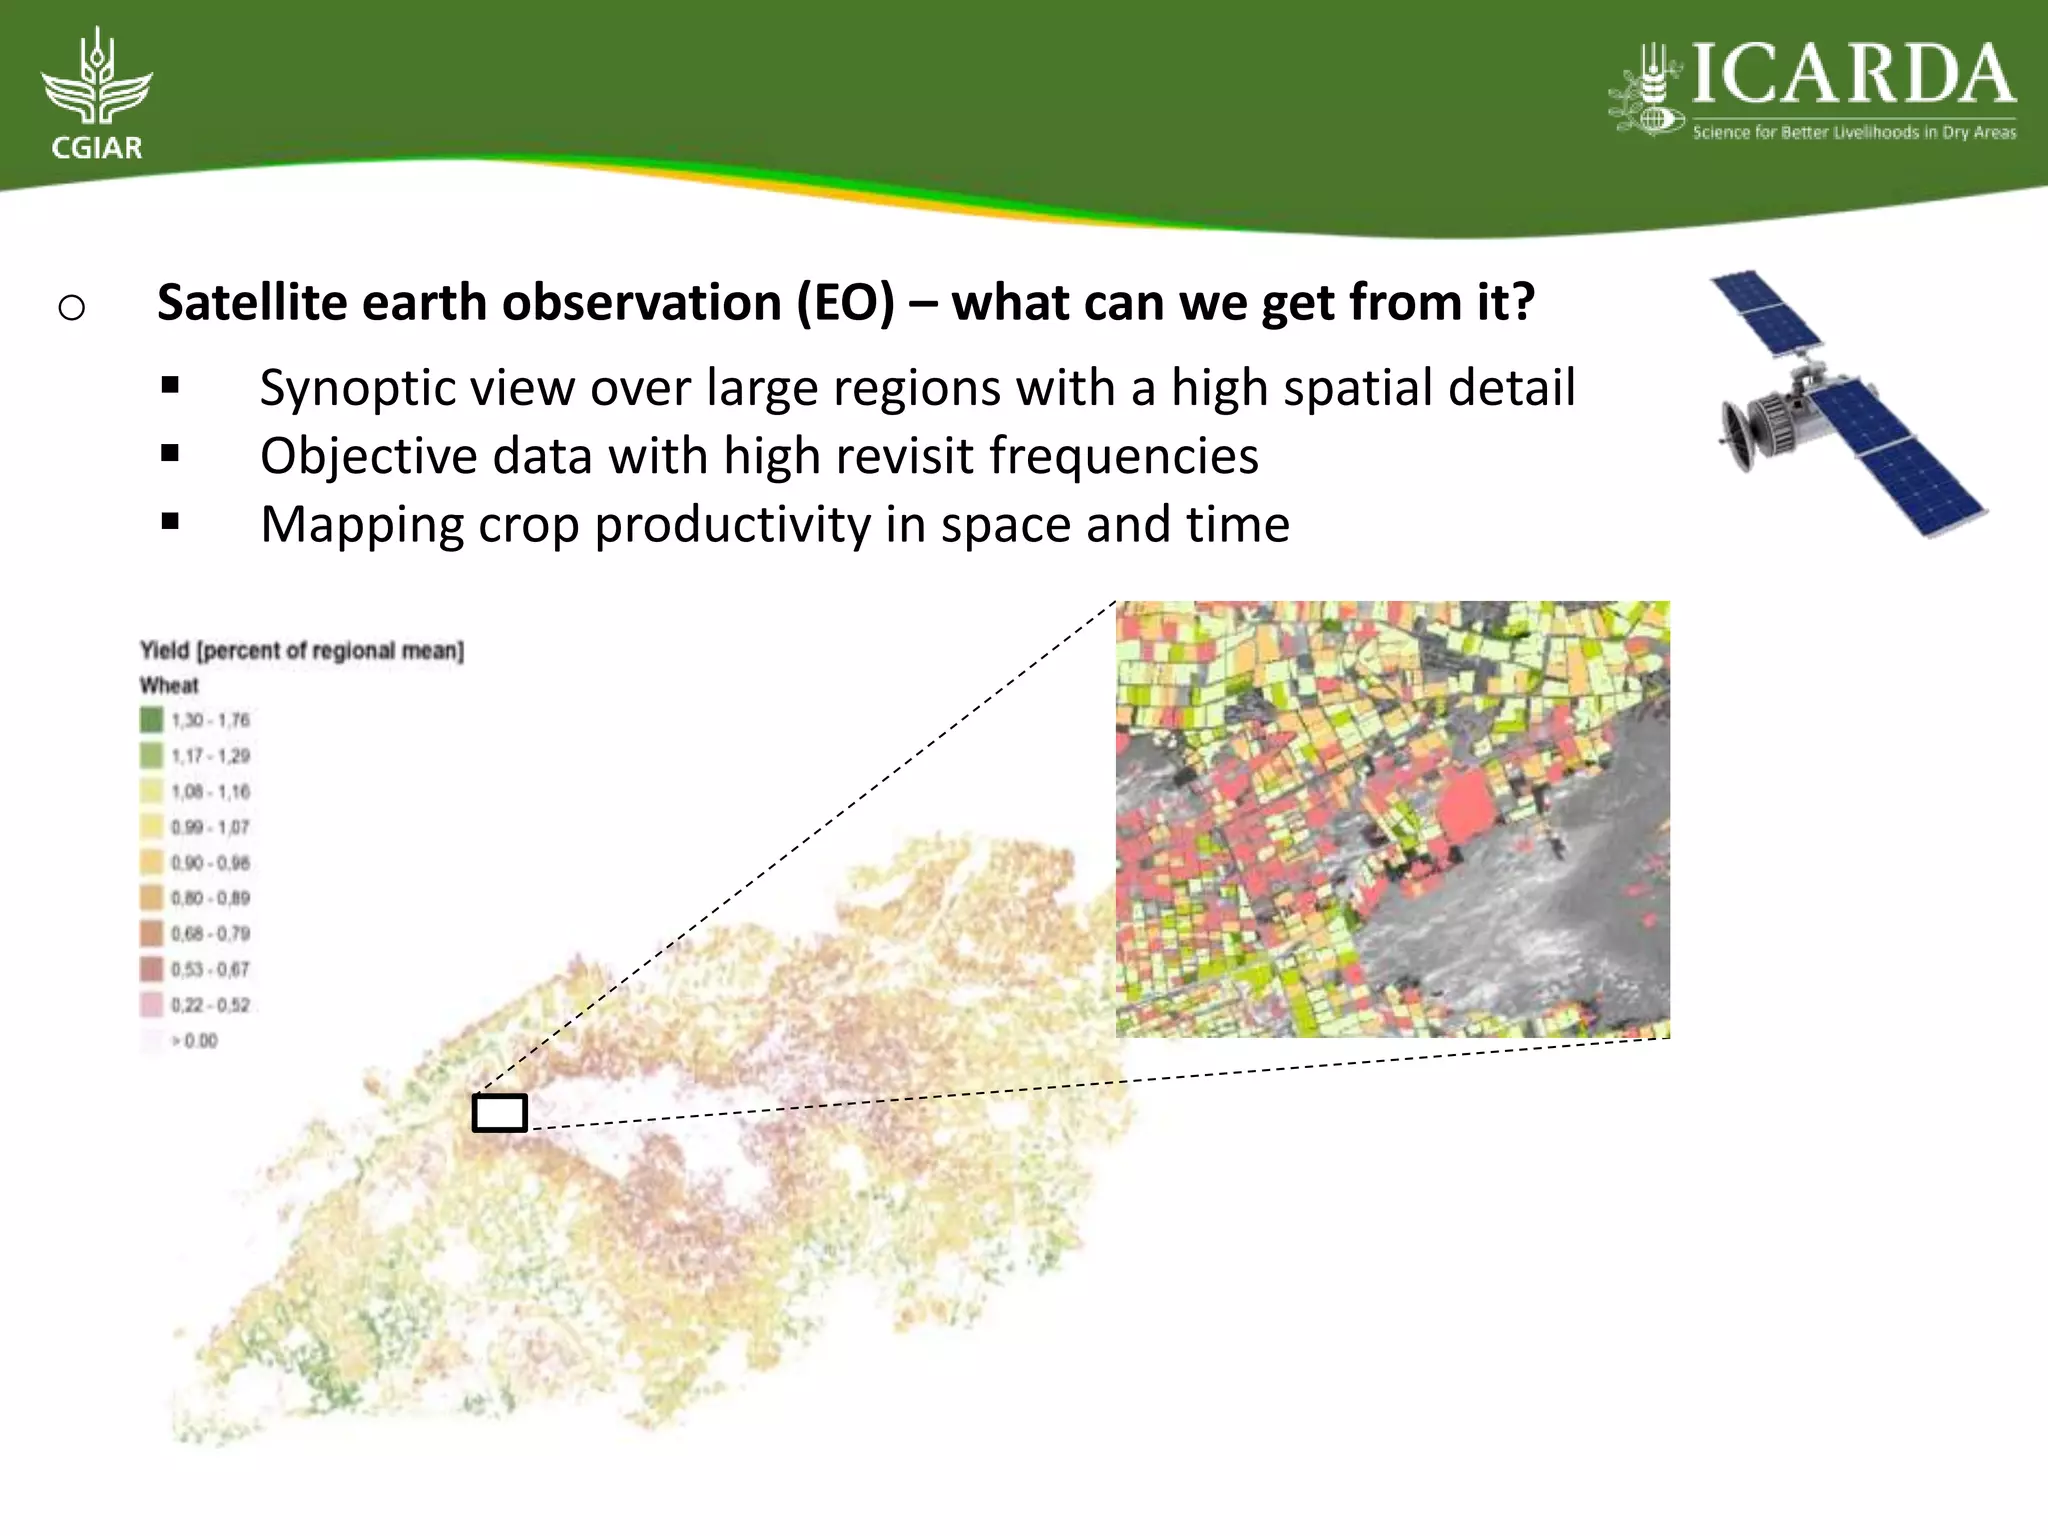
The document presents findings from a workshop on climate-smart agriculture in Central Asia, focusing on remote sensing assessments of crop productivity, particularly for cotton and wheat. It highlights challenges such as environmental degradation, climate change impacts on water resources, and the potential for improving water productivity. The use of satellite Earth observation is promoted for enhancing agricultural monitoring and decision-making, with plans for a fully automated online tool to provide timely crop condition information.


![[Day 2] Center Presentation: ICARDA](https://cdn.slidesharecdn.com/ss_thumbnails/cgiar-csi-day2-1apr2009-center-icarda-090405003350-phpapp01-thumbnail.jpg?width=640&height=640&fit=bounds)


