Download as PDF, PPTX

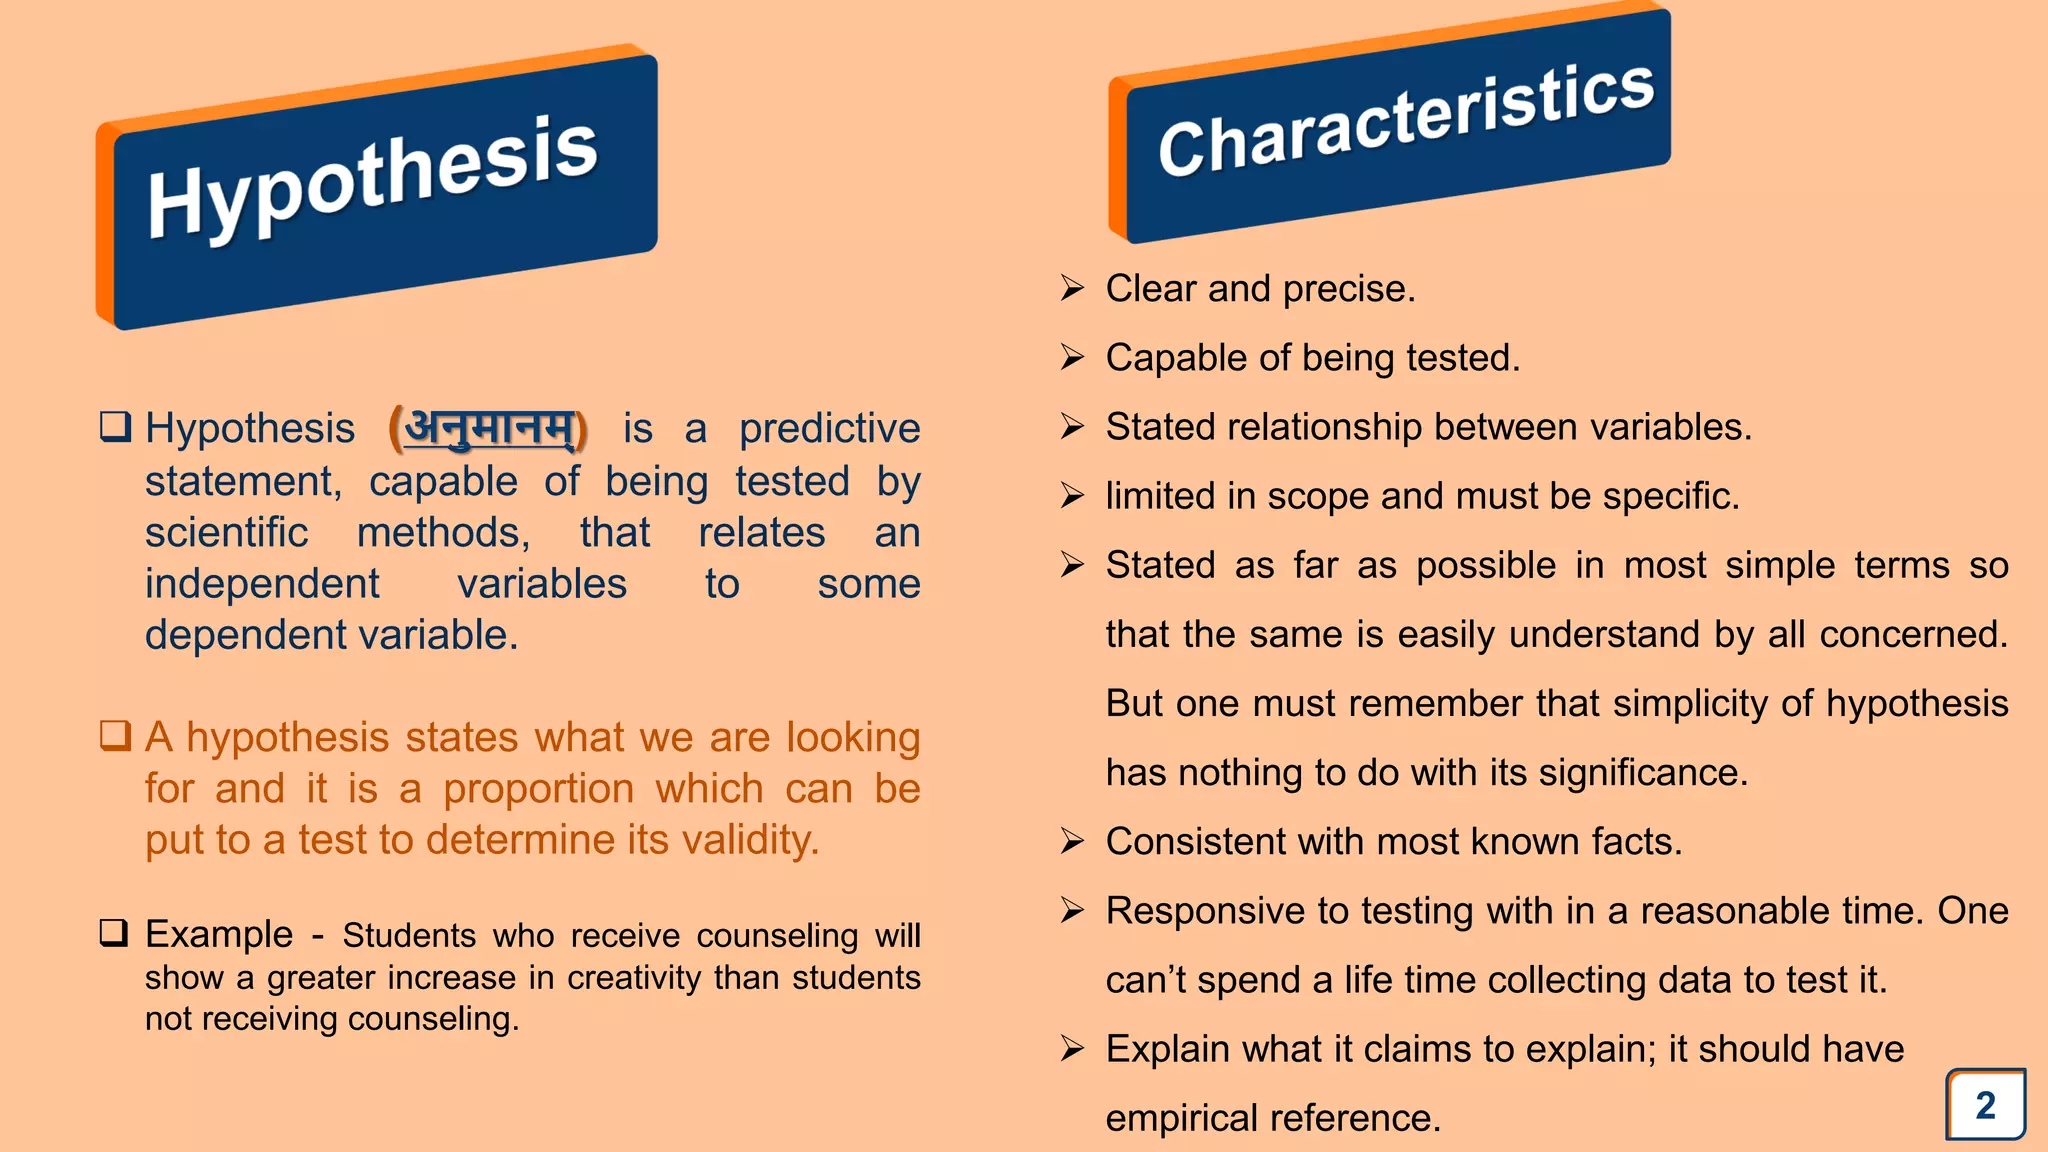
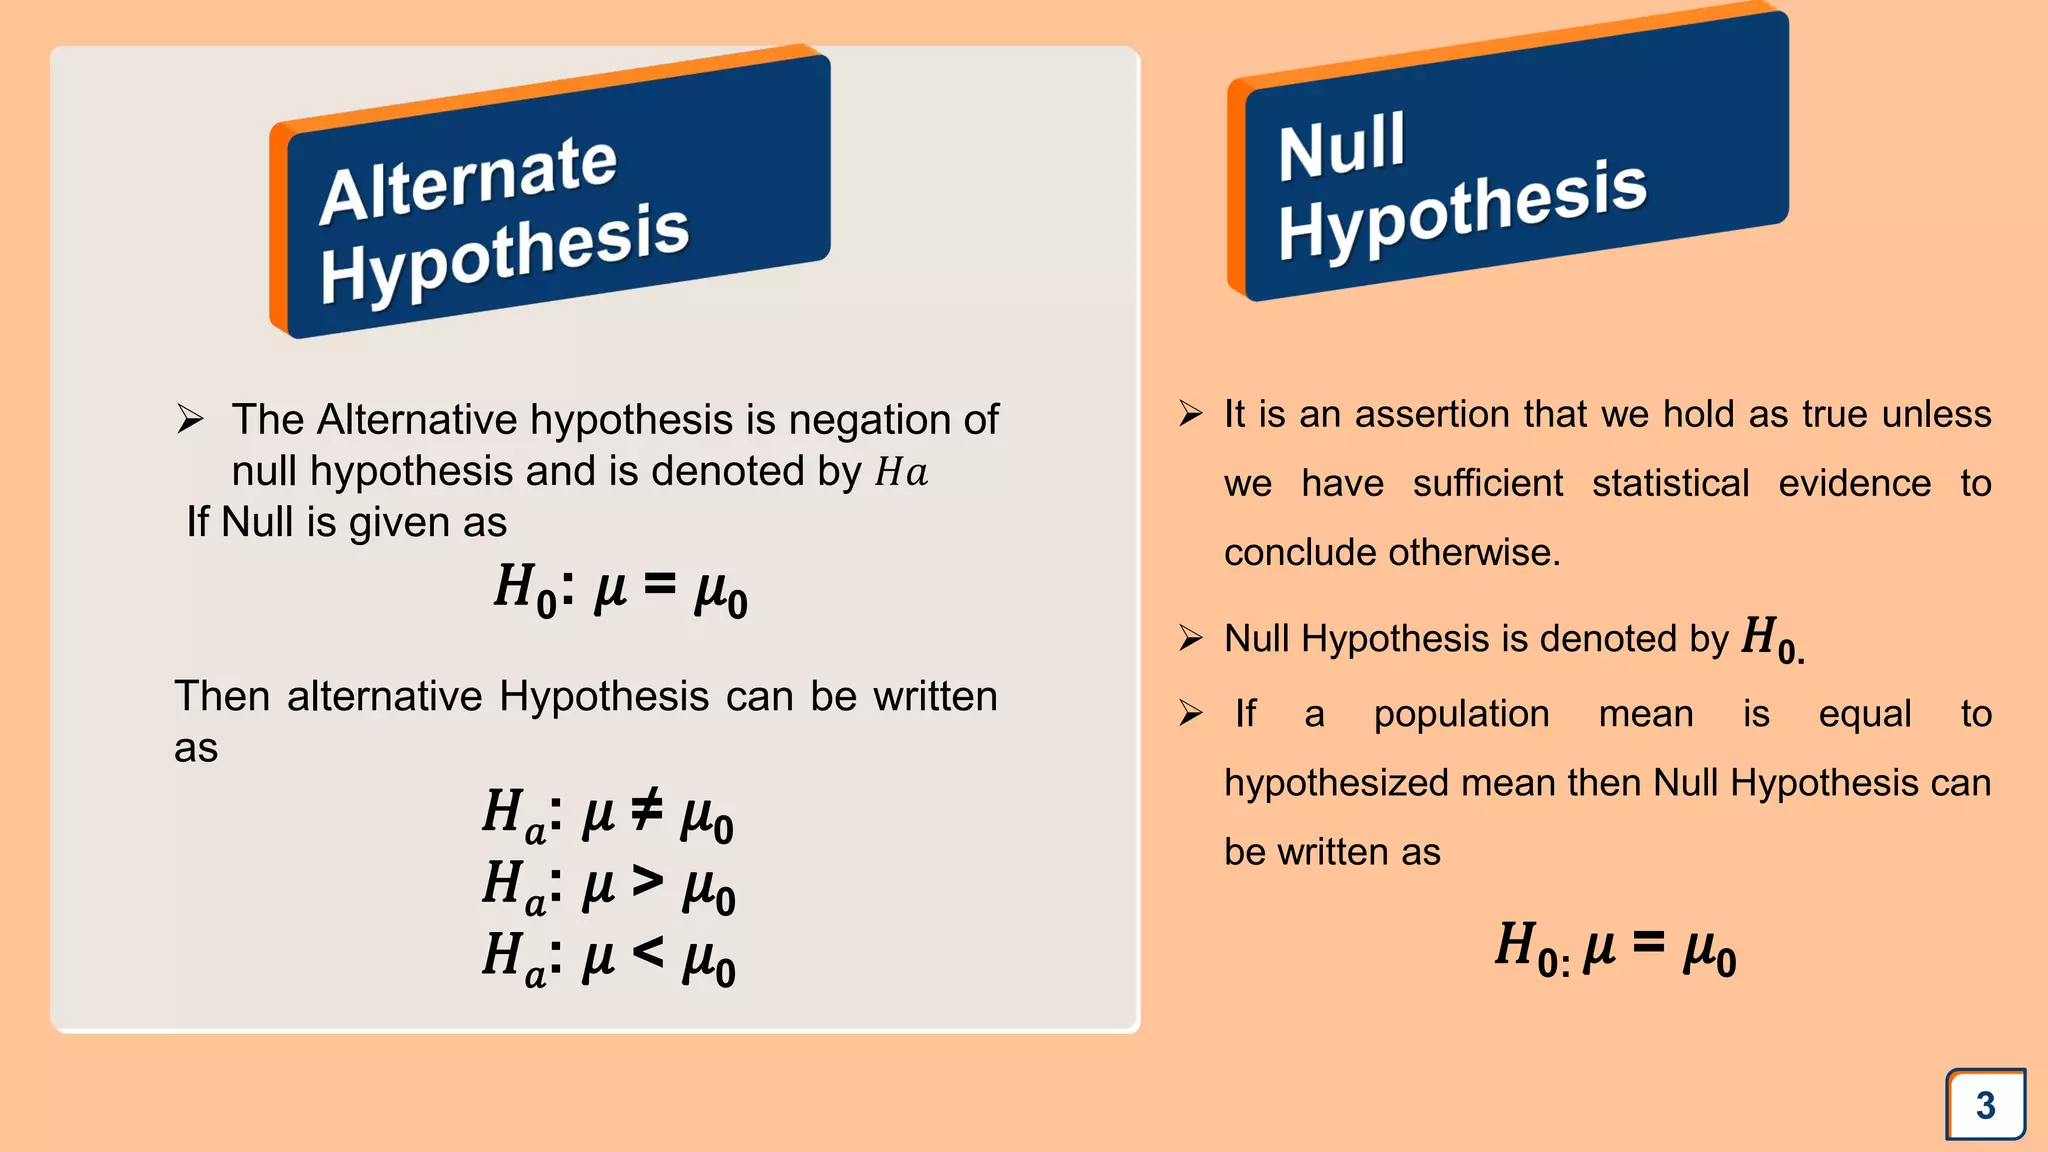
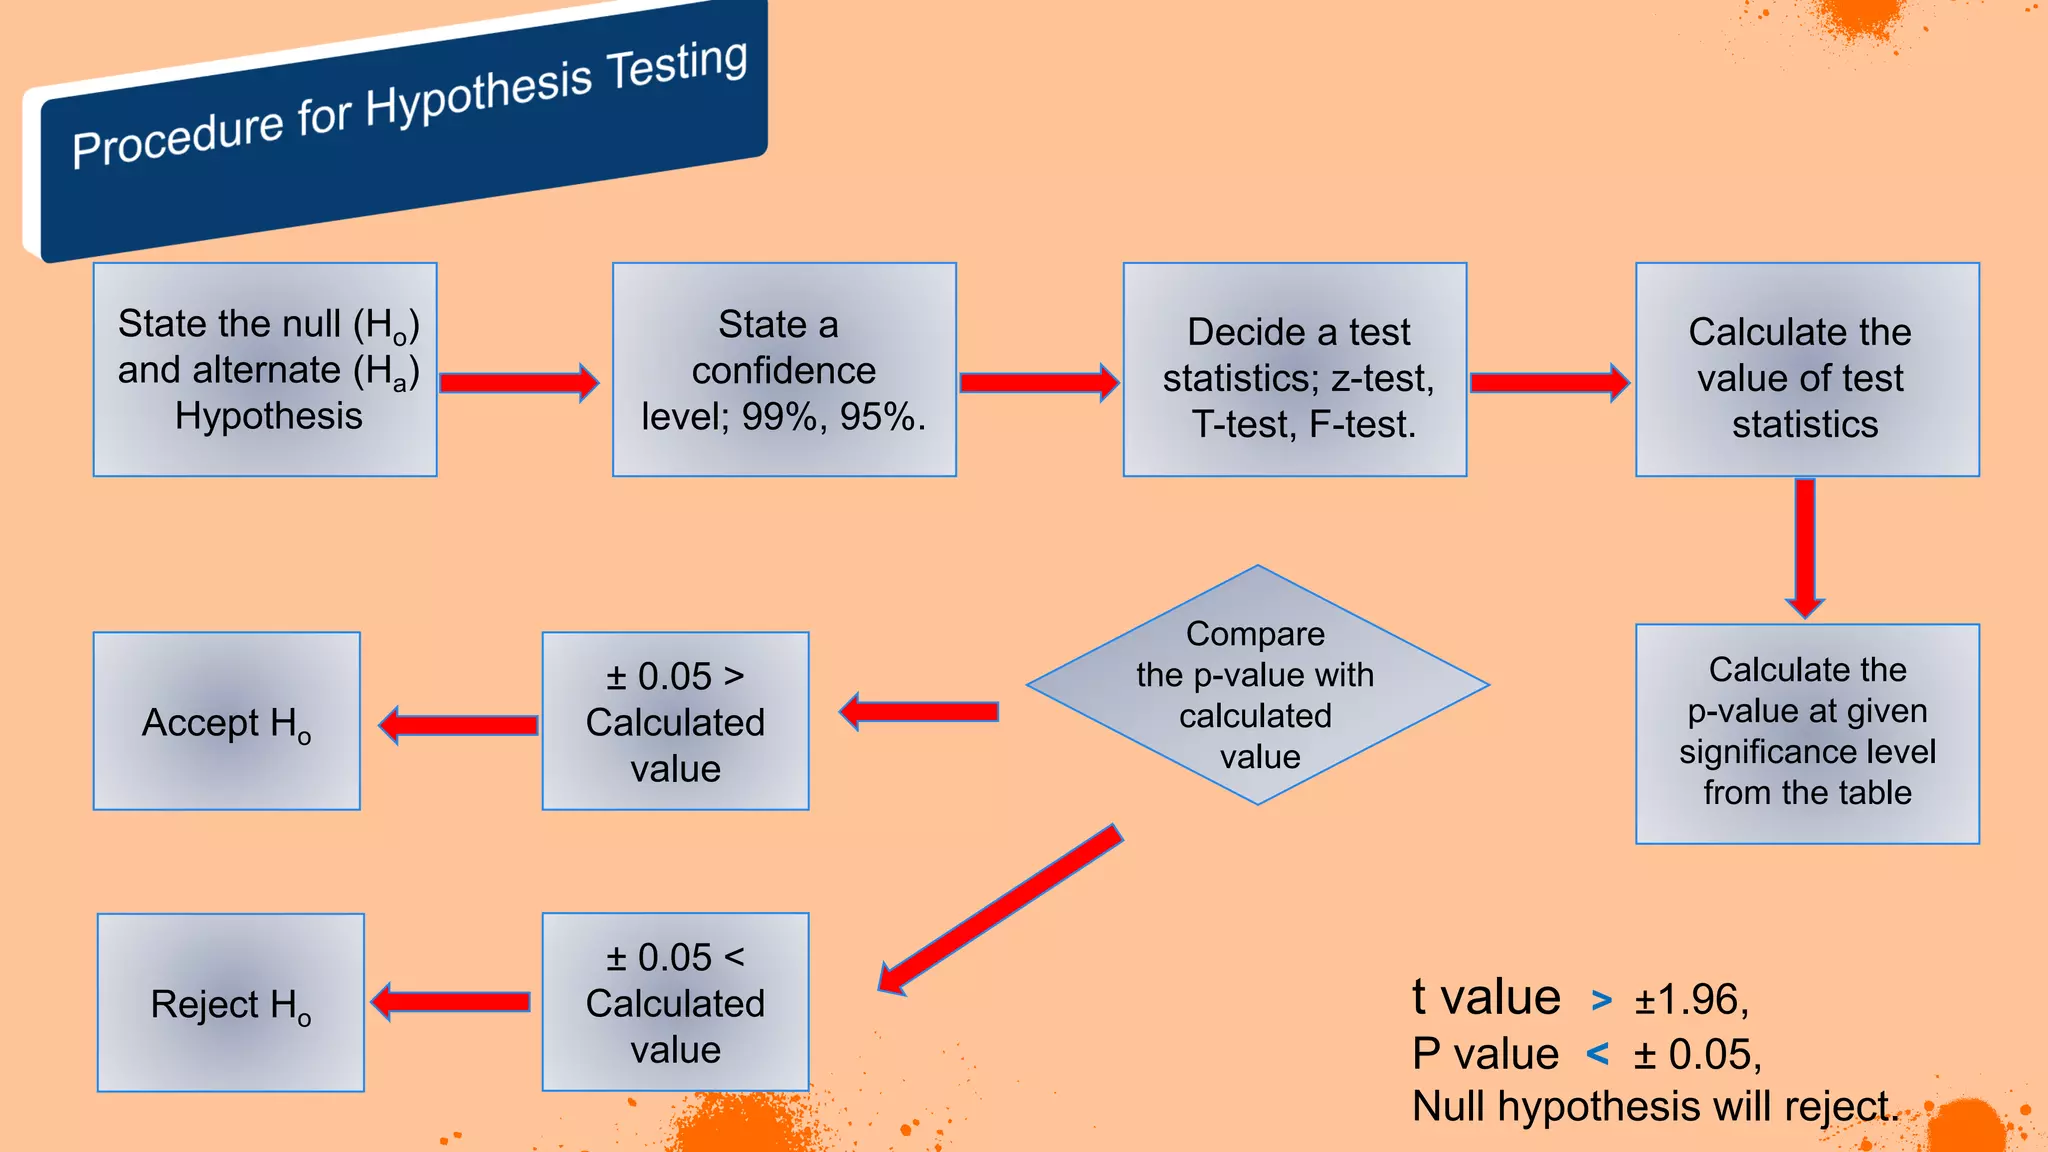
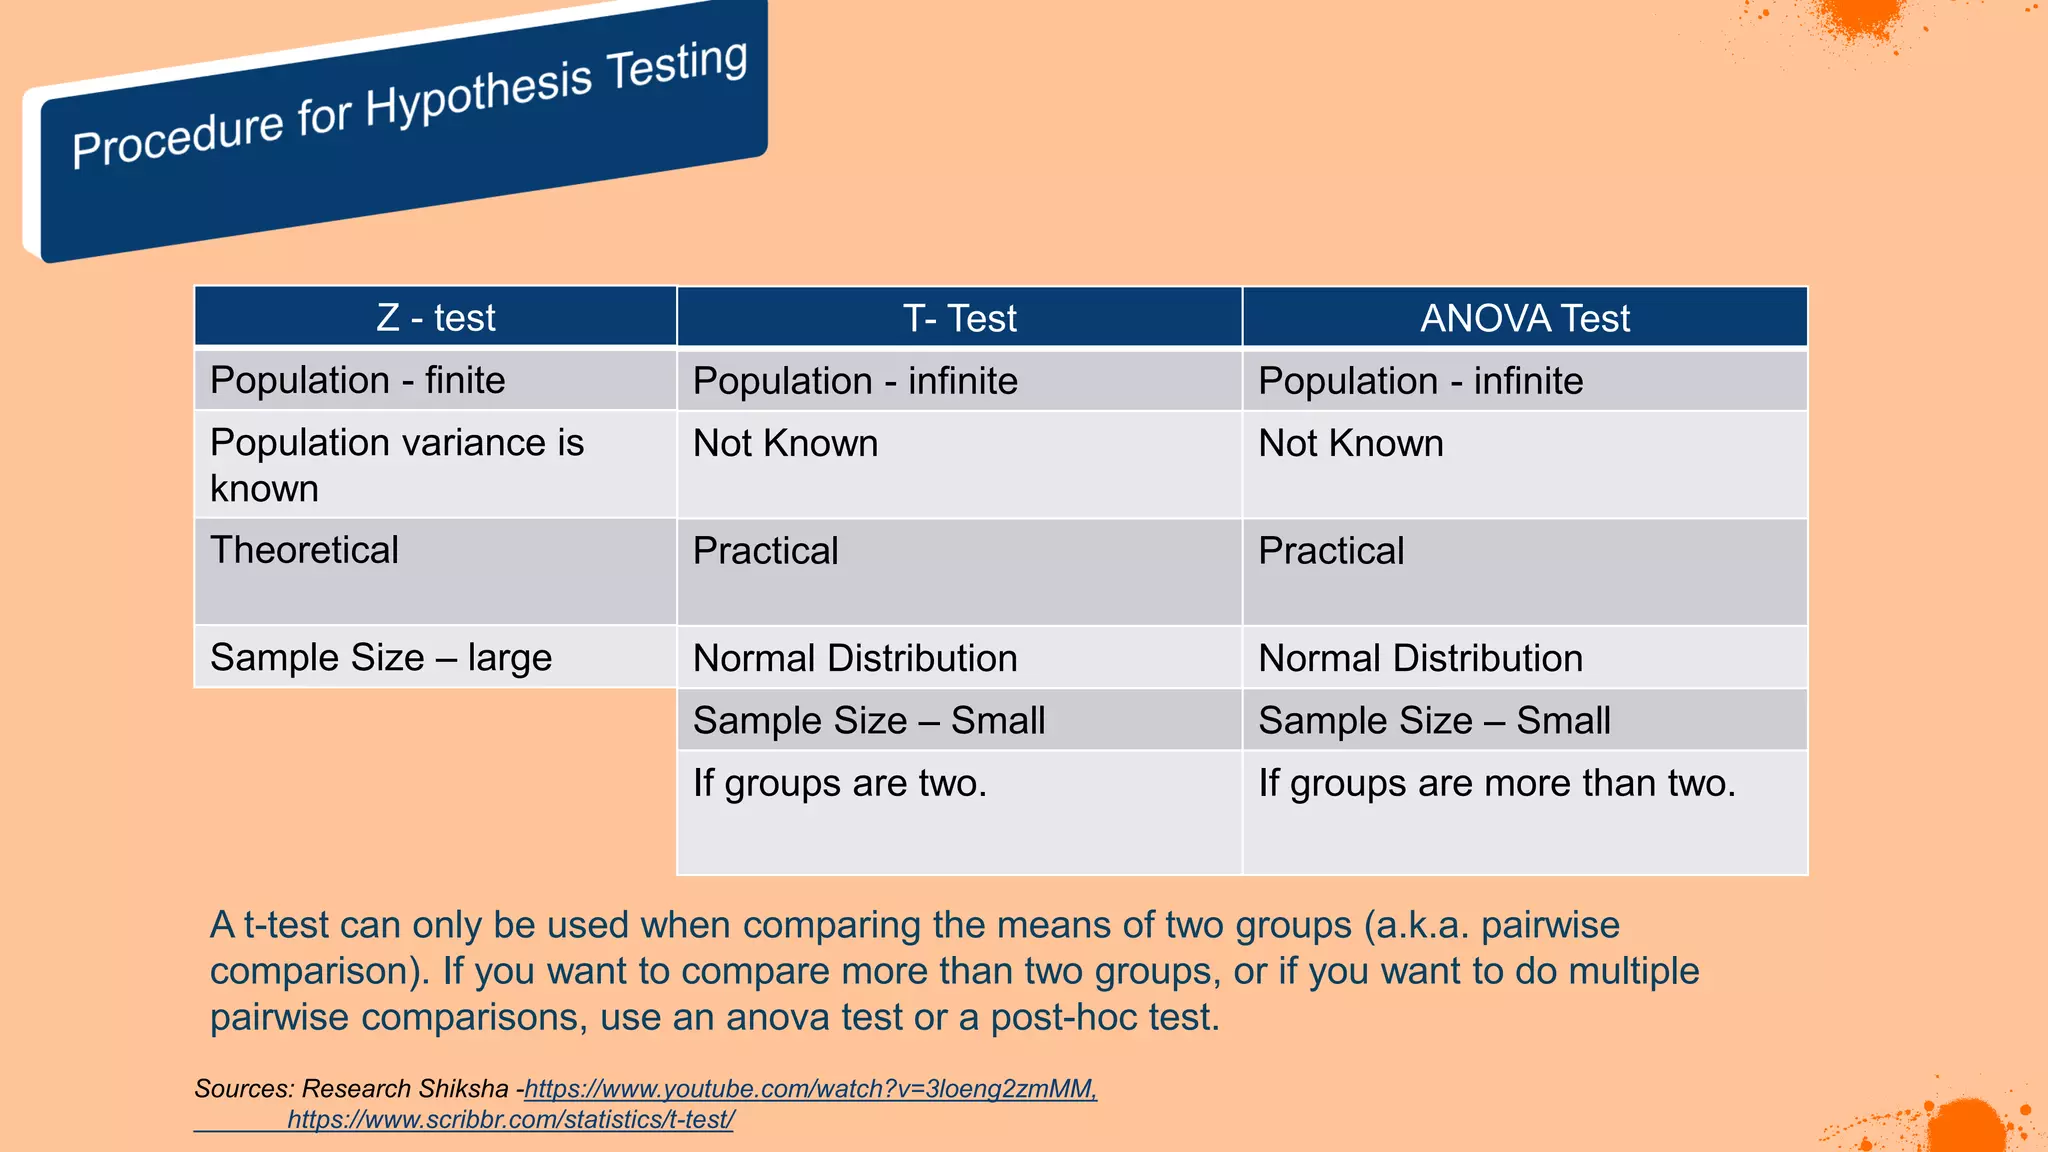
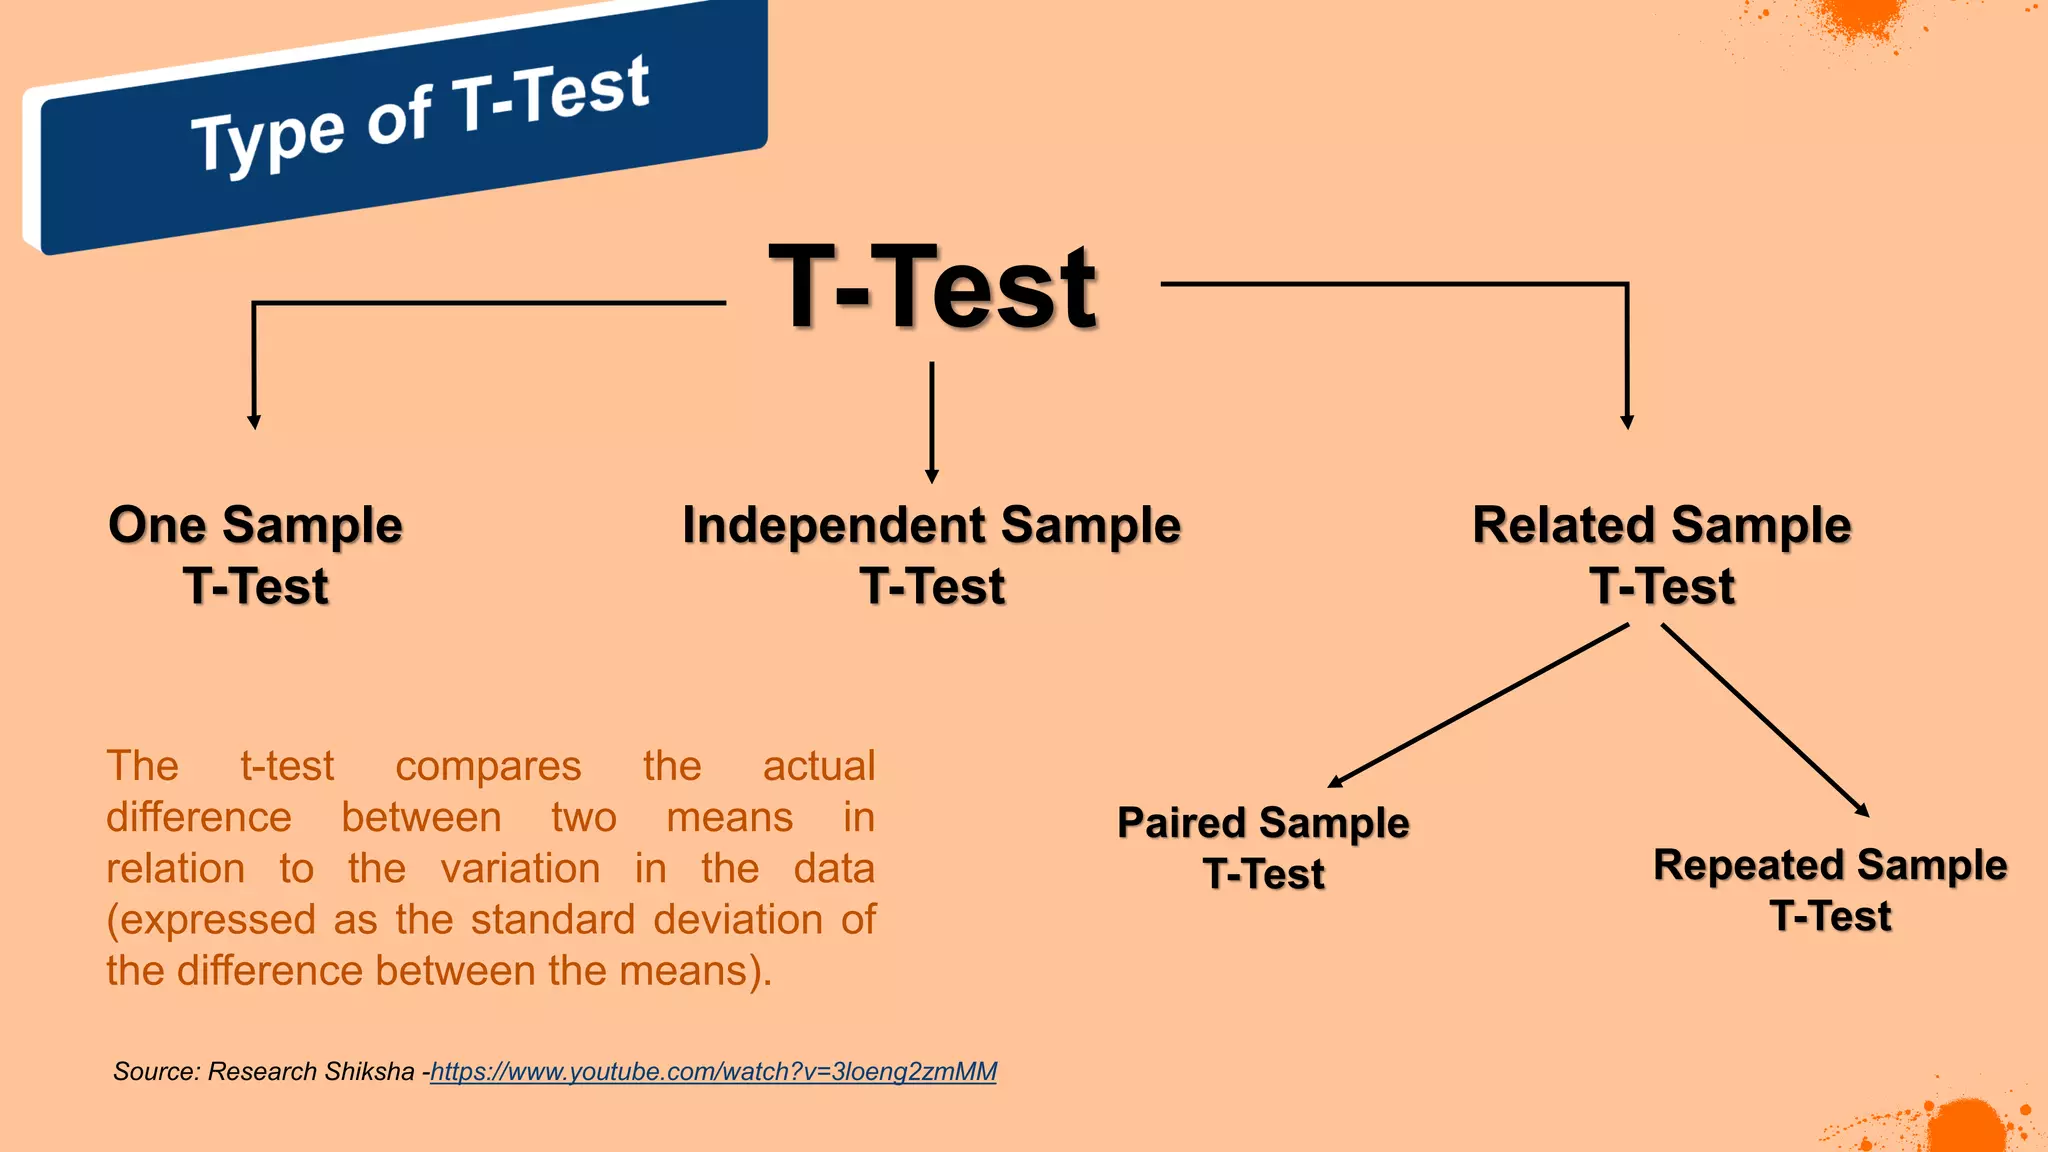
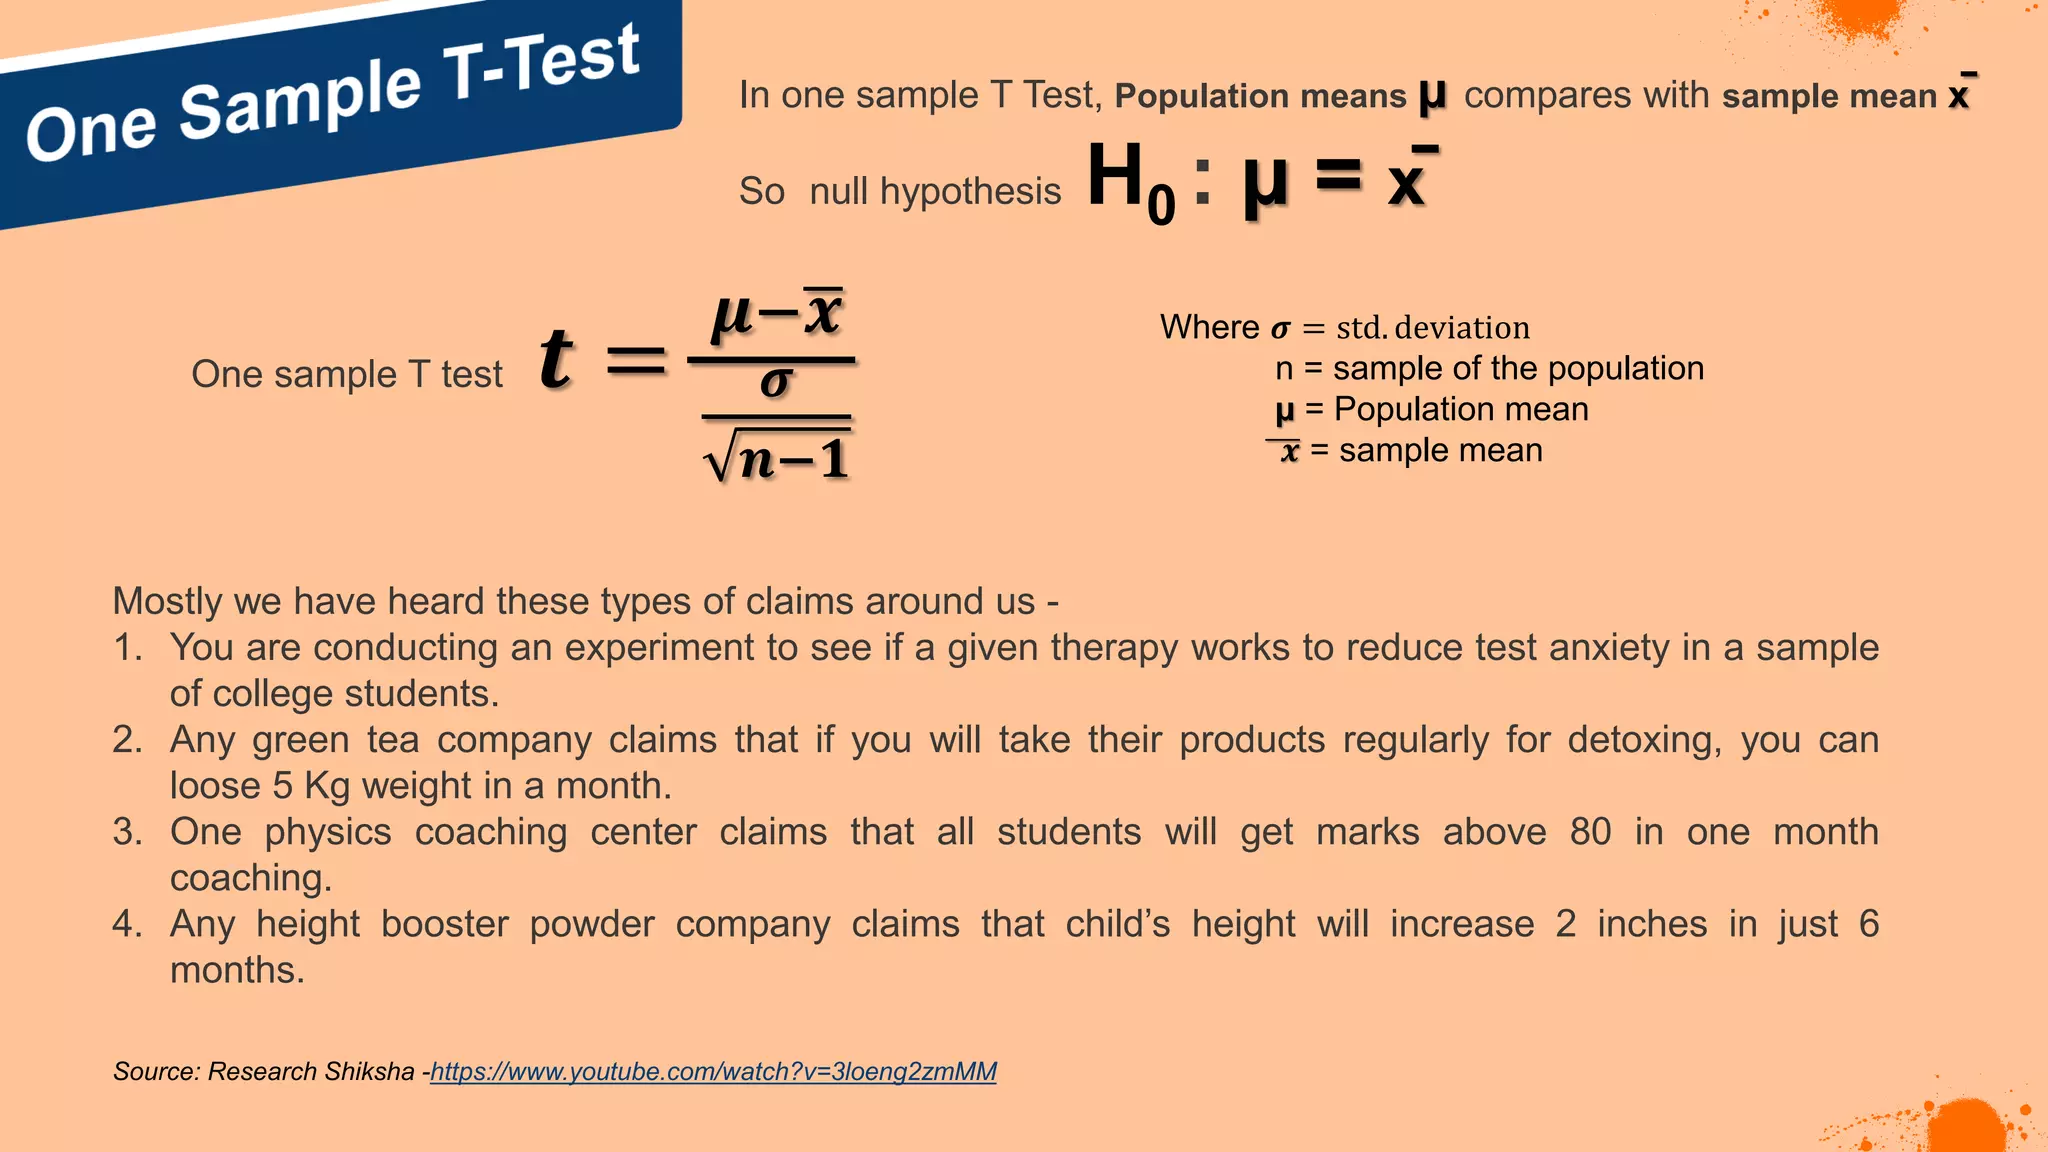
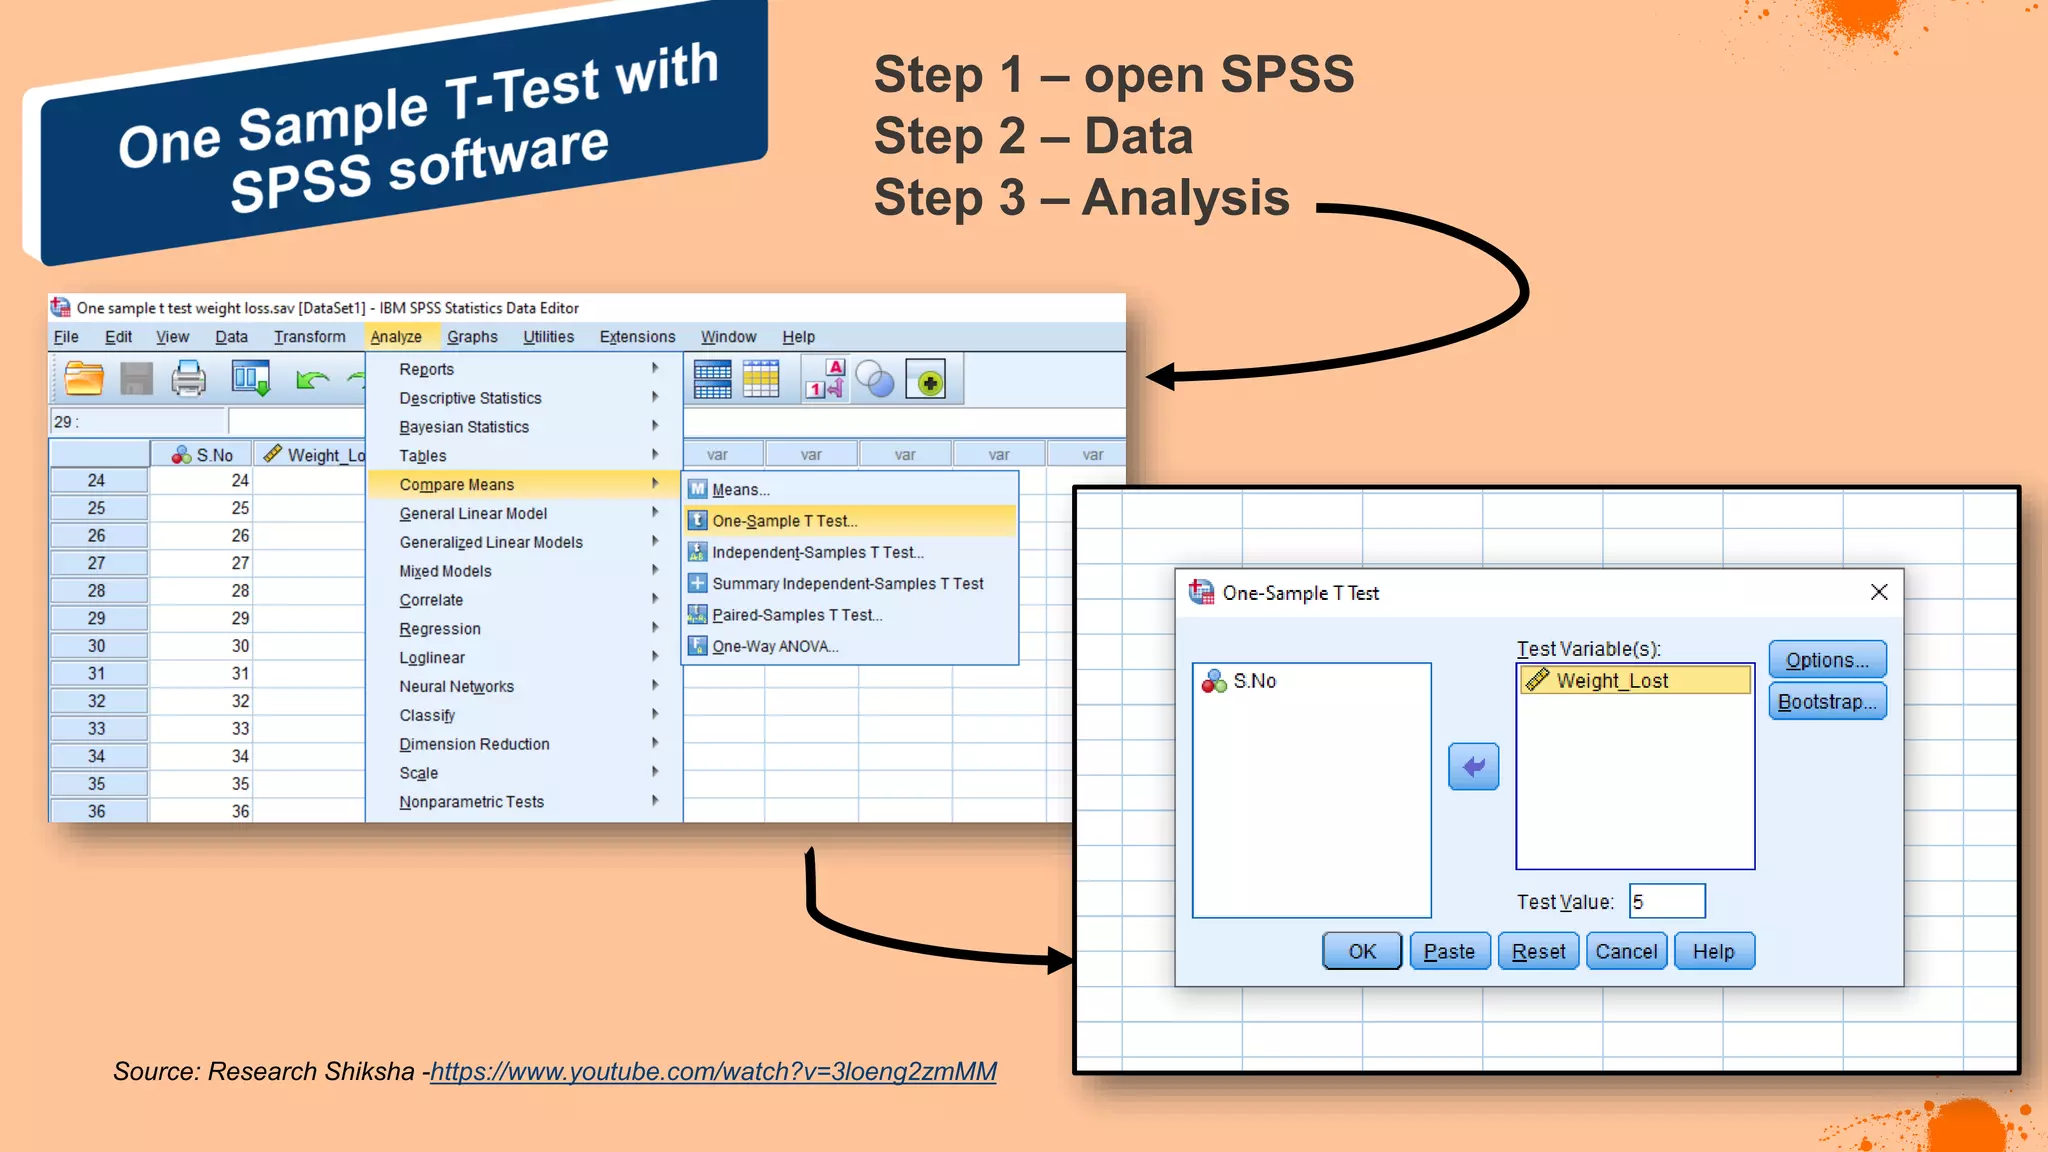
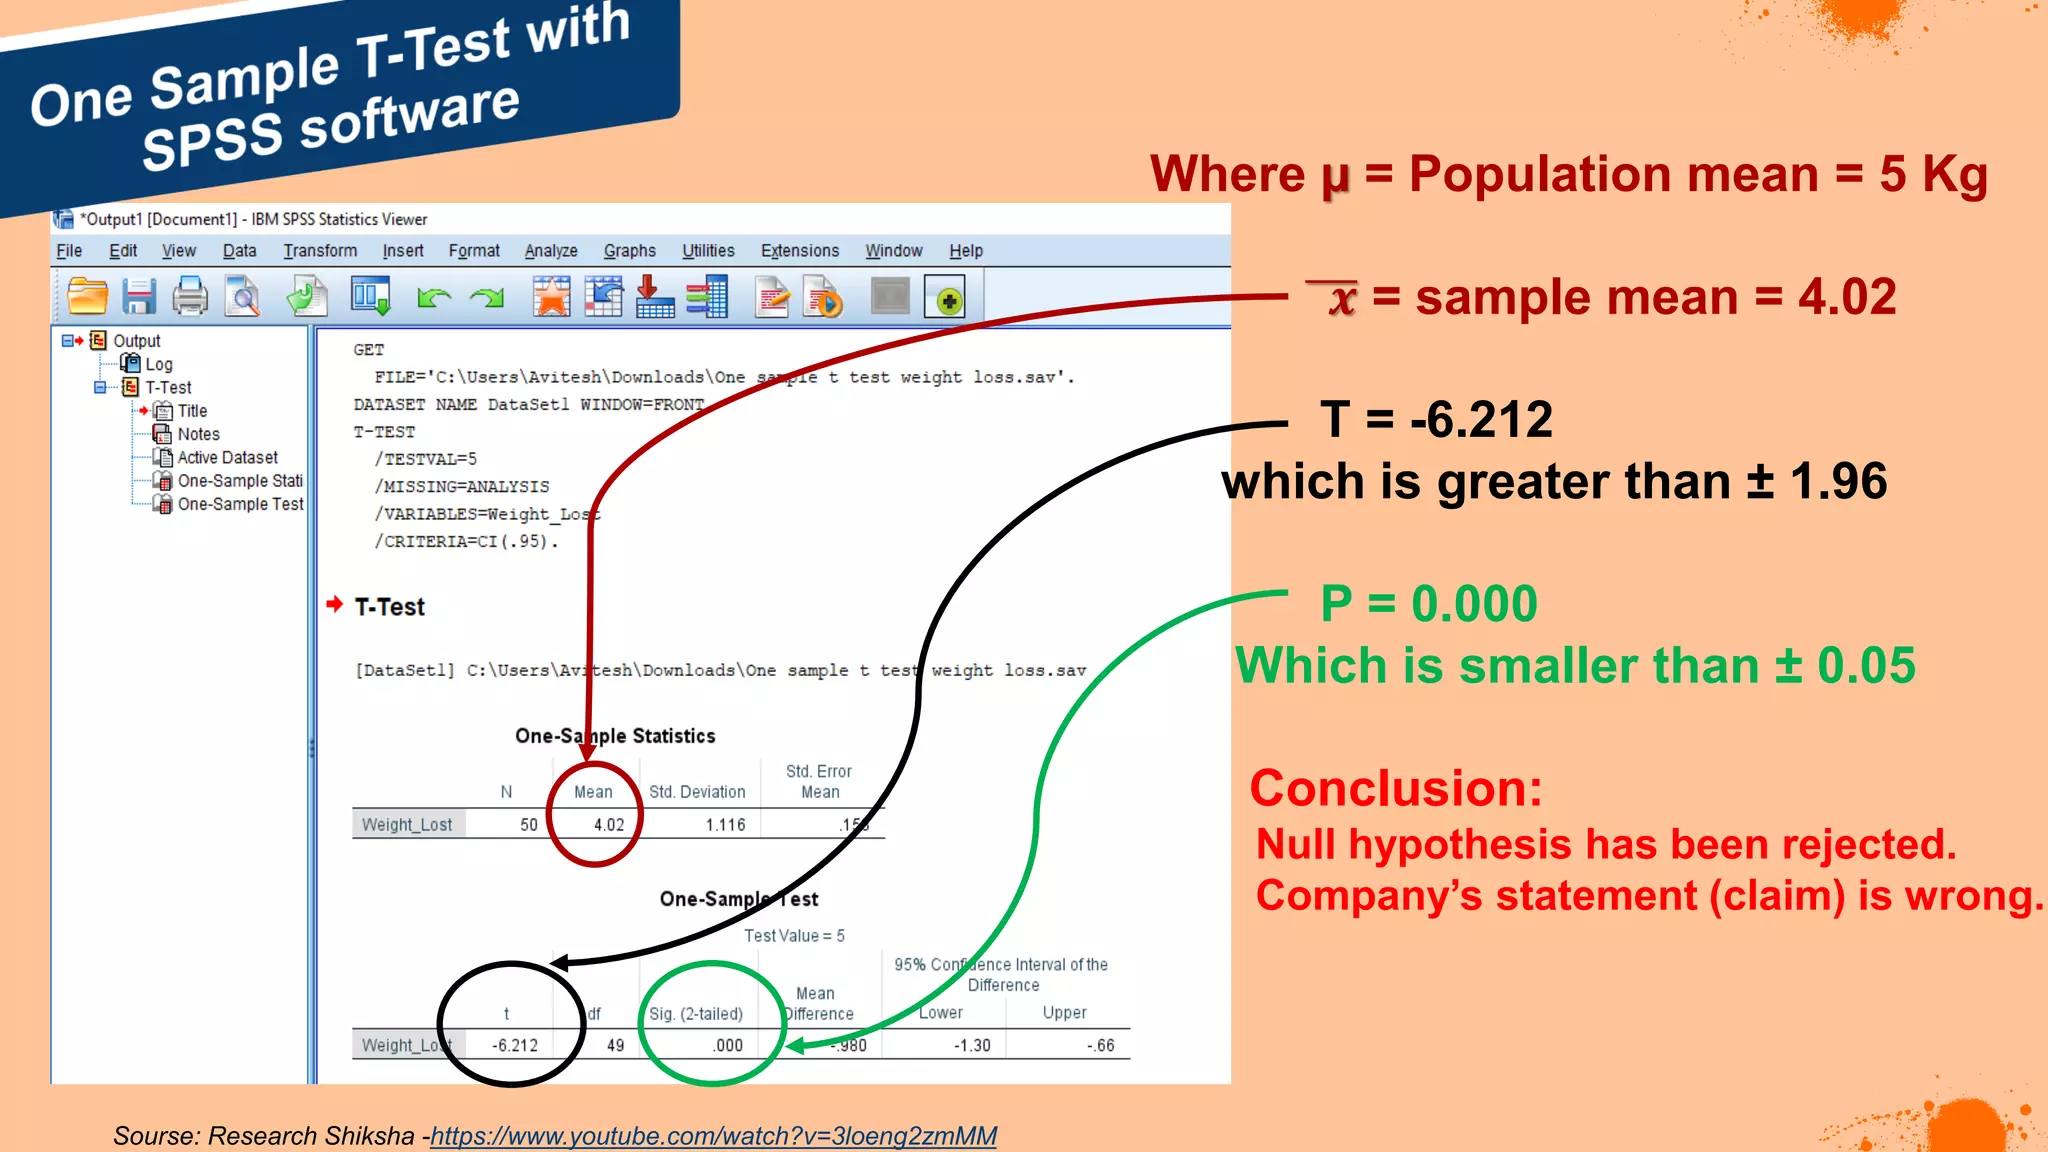
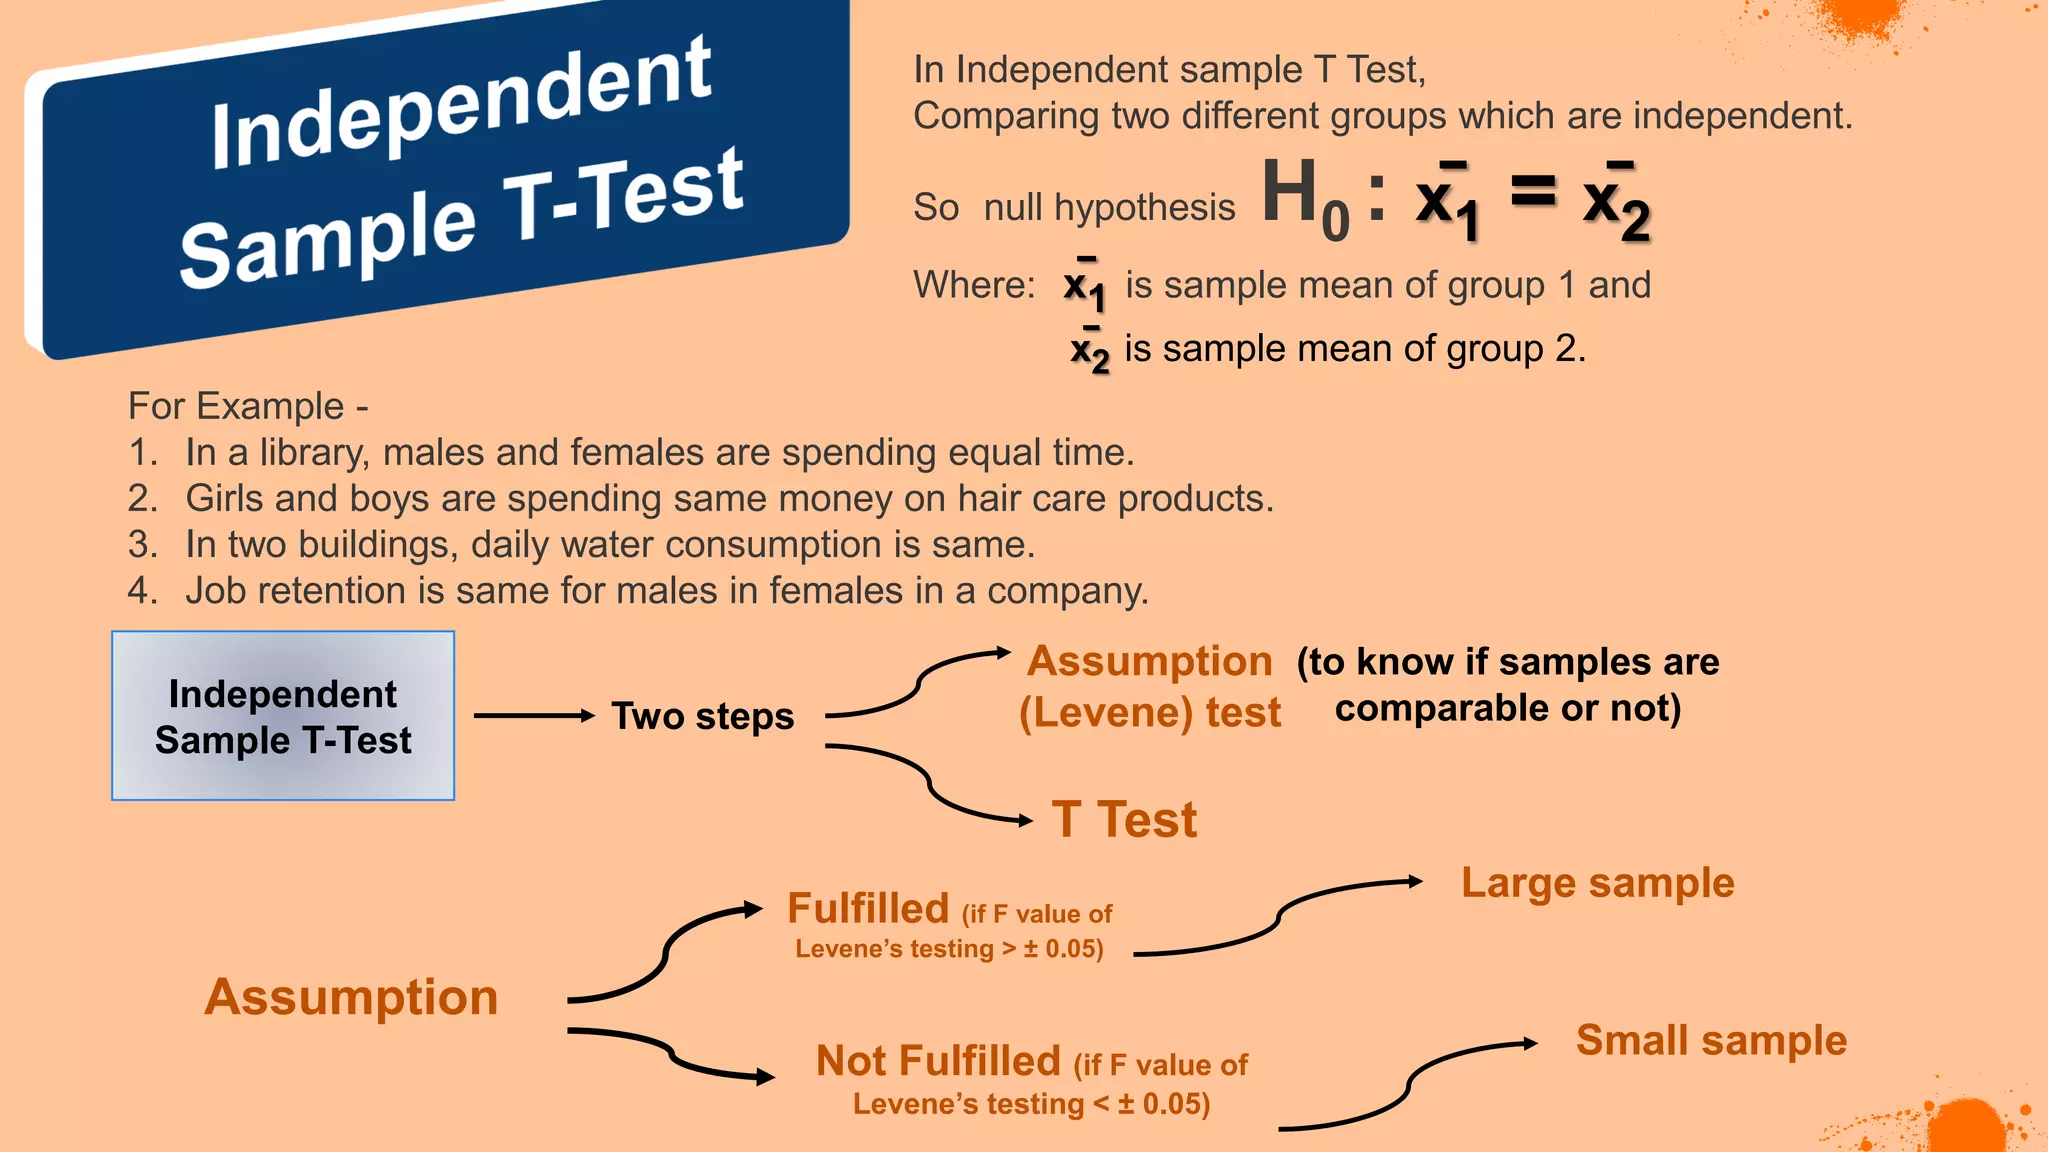
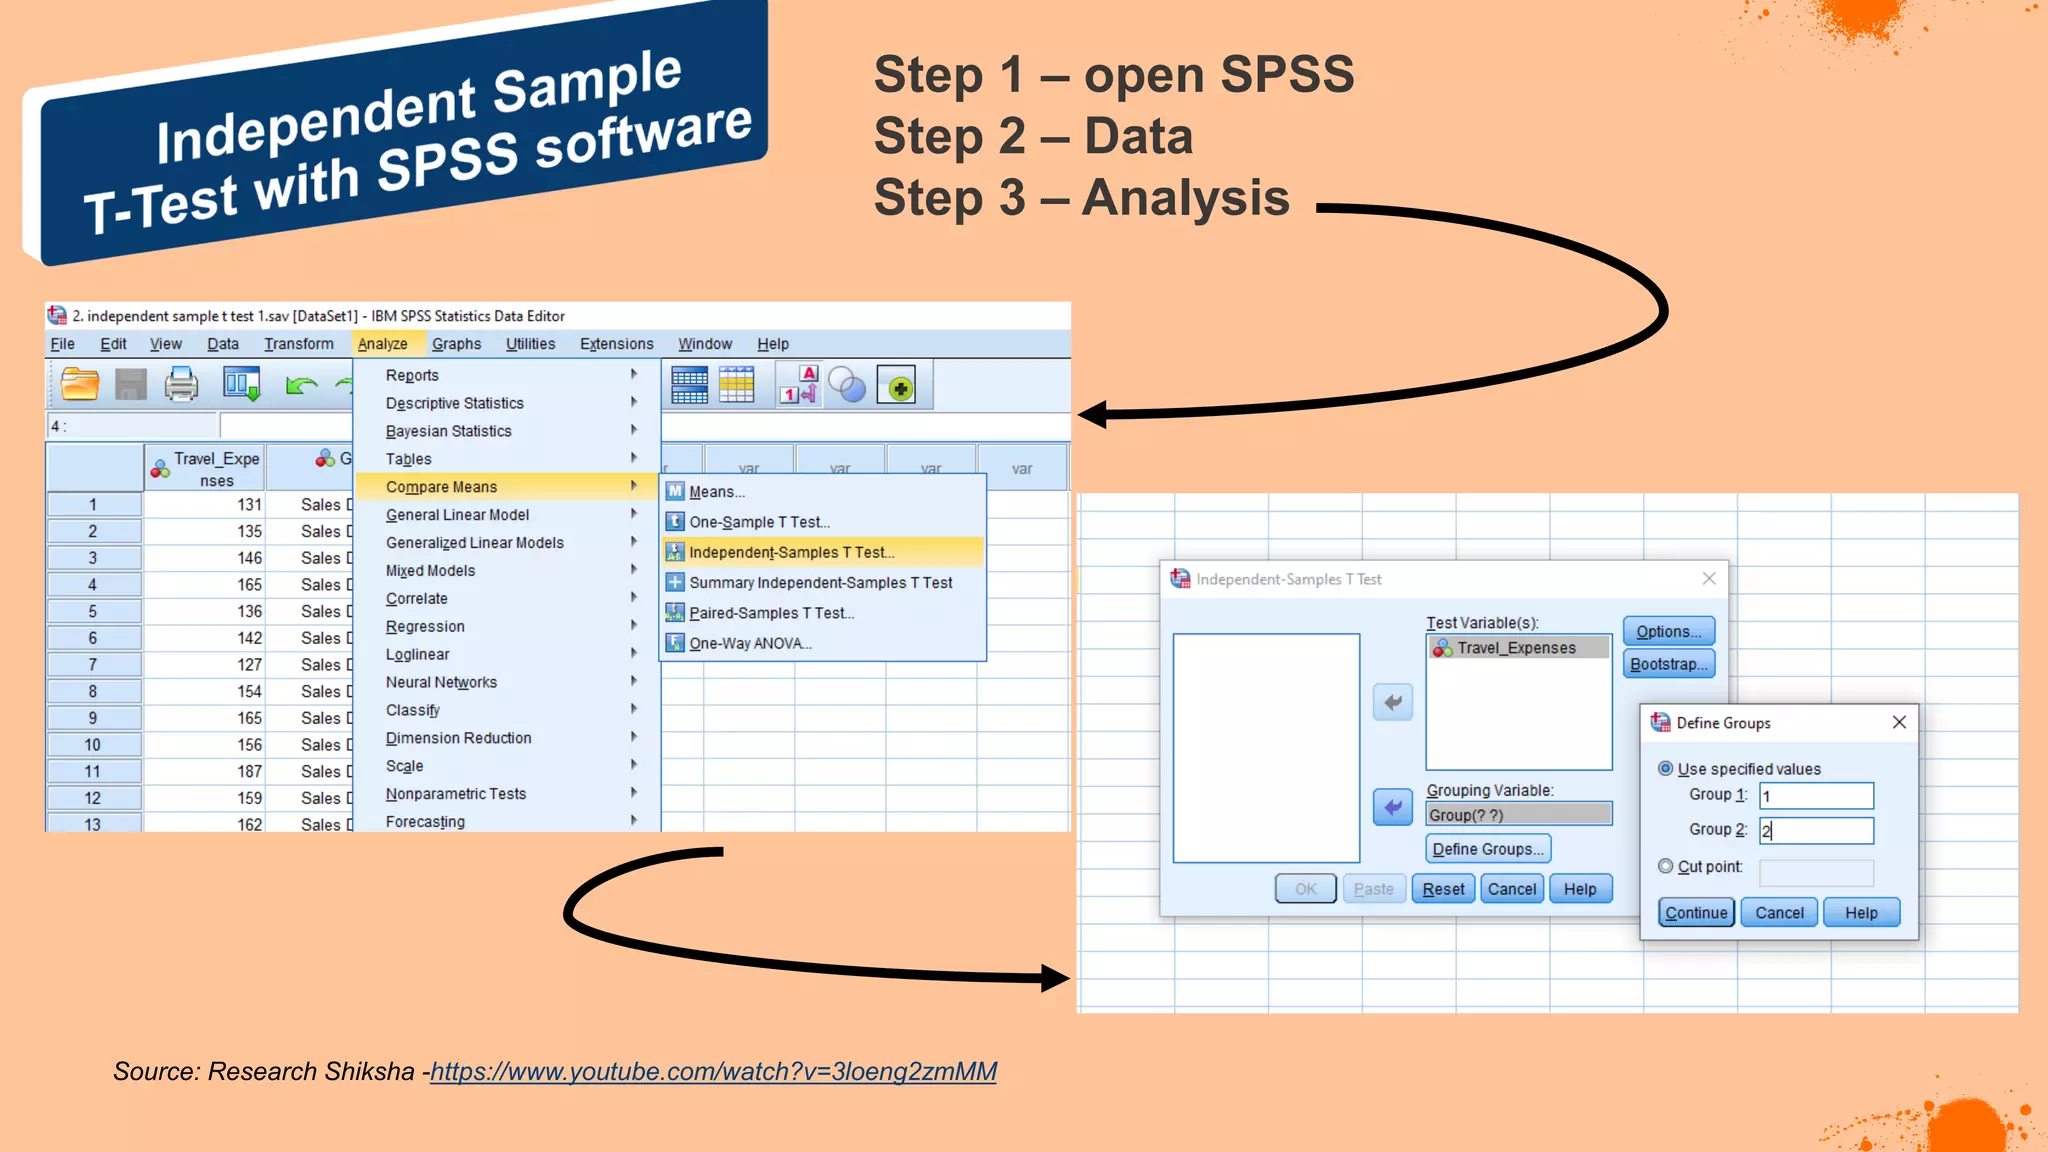
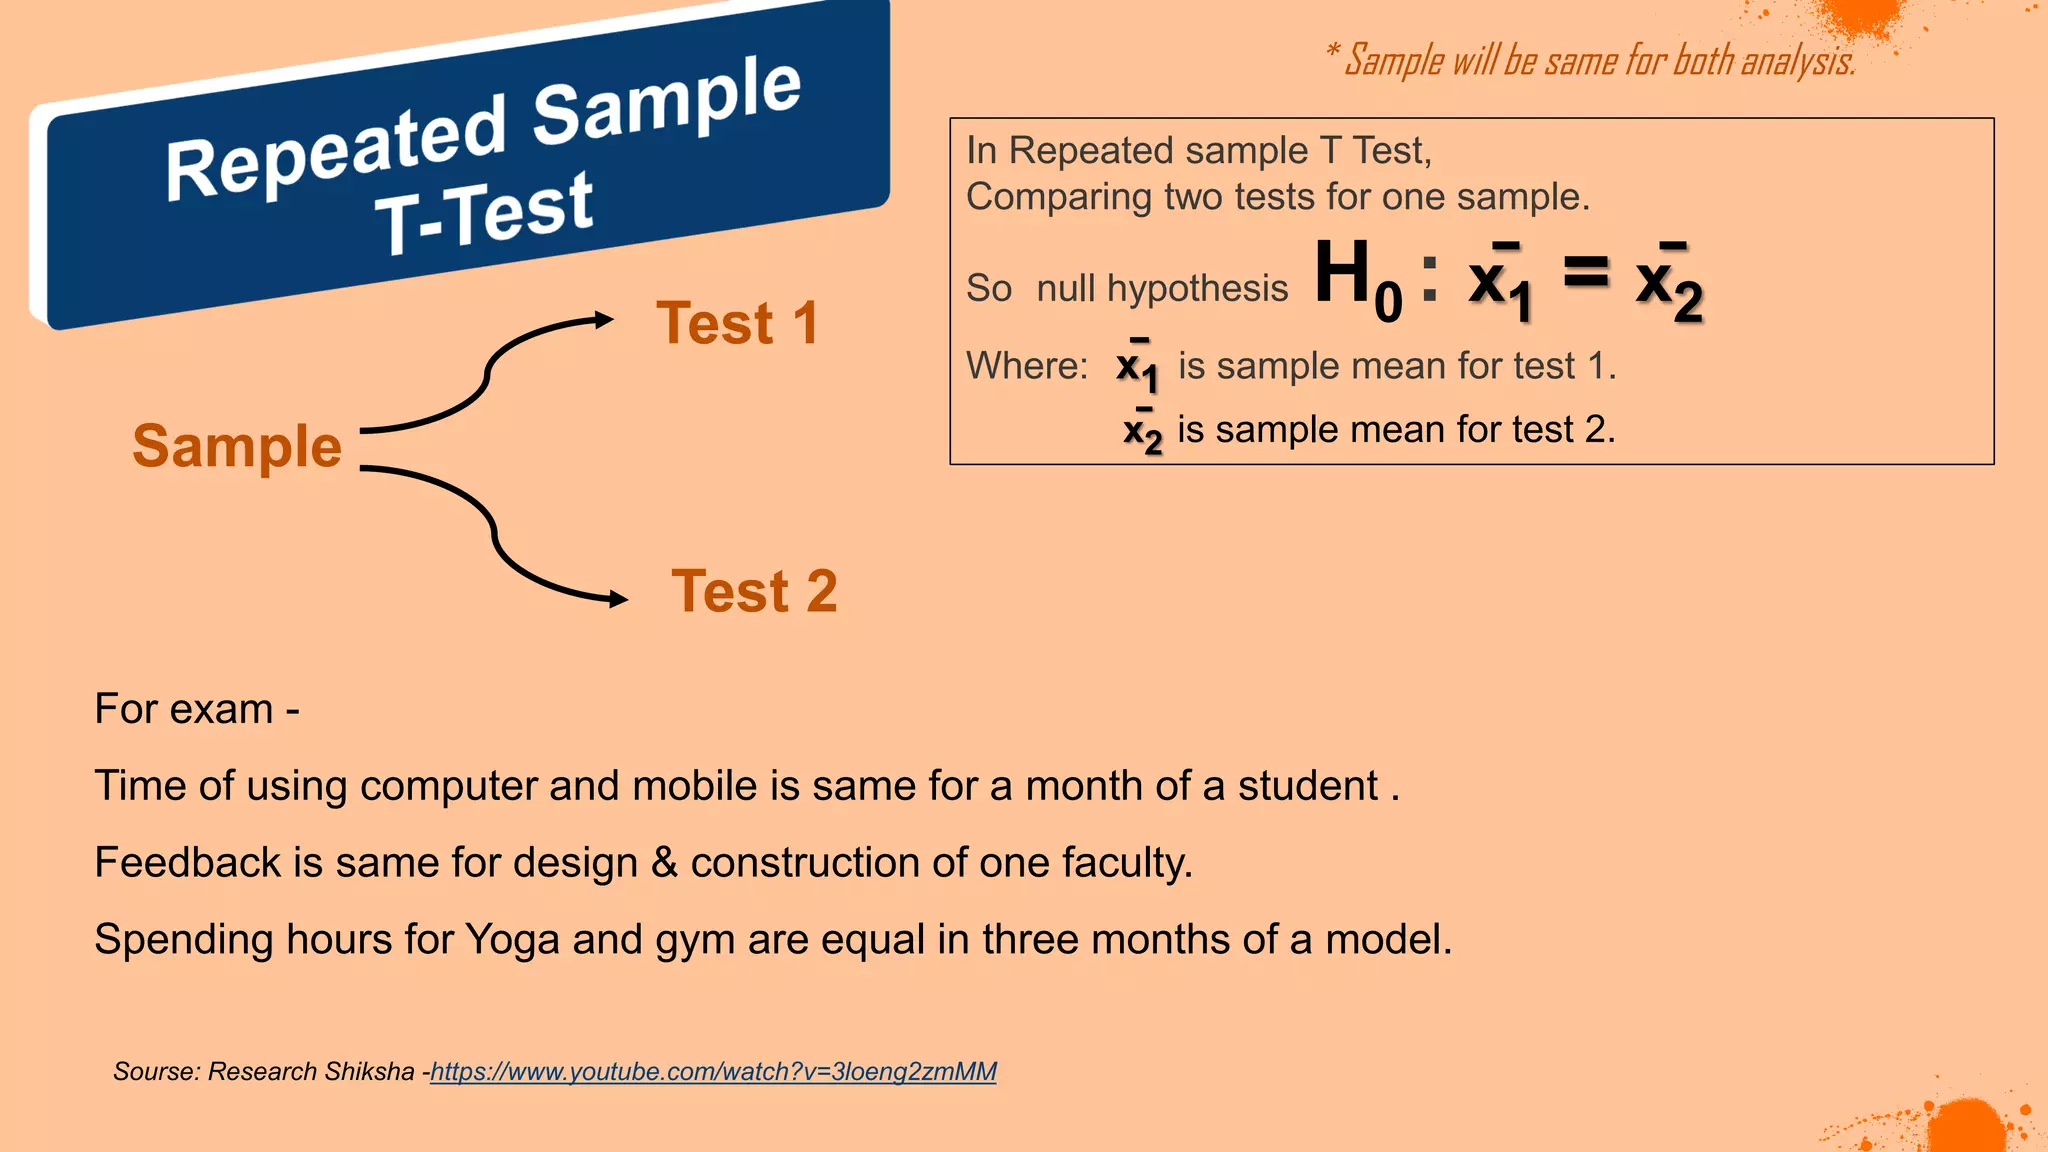
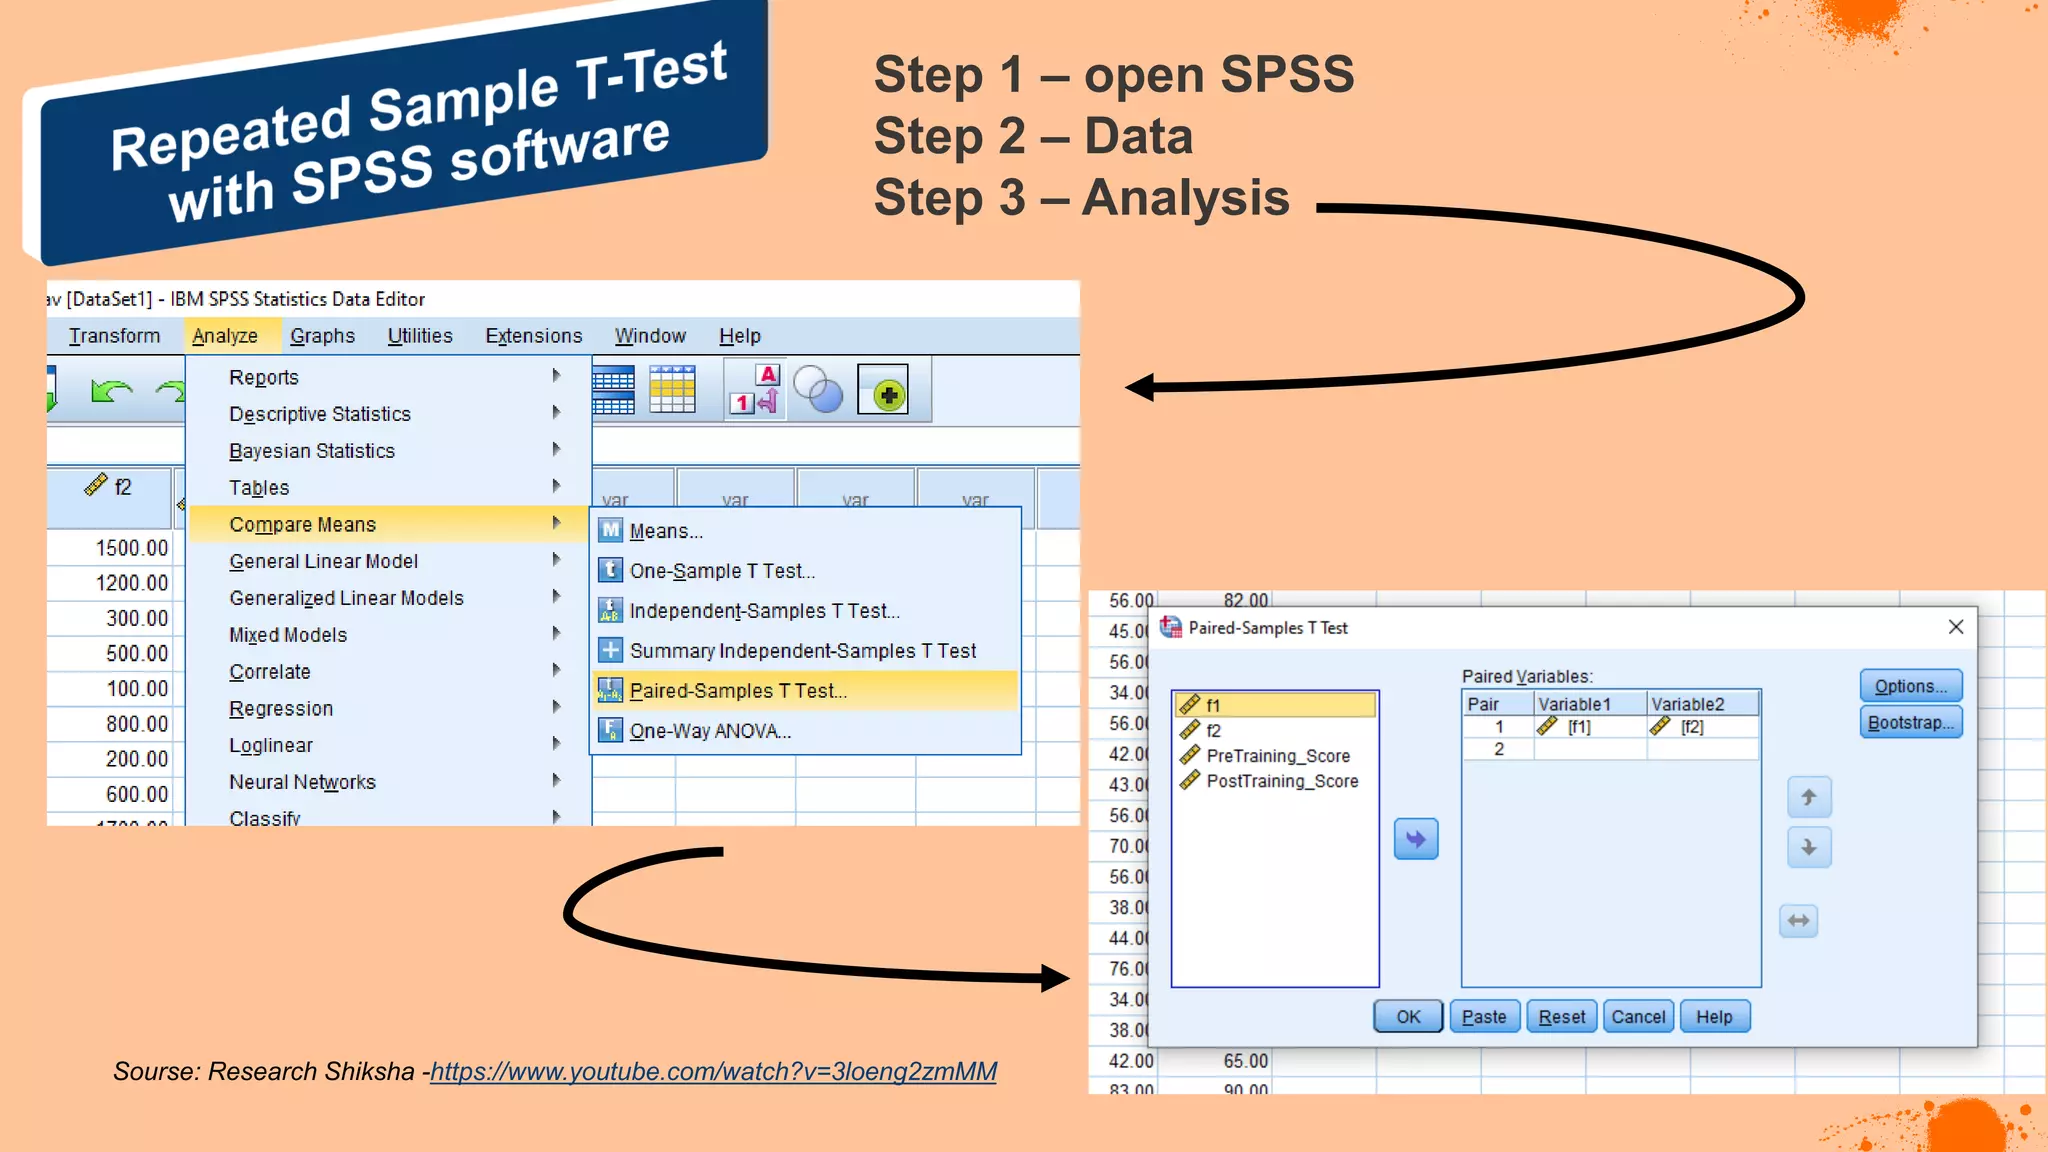
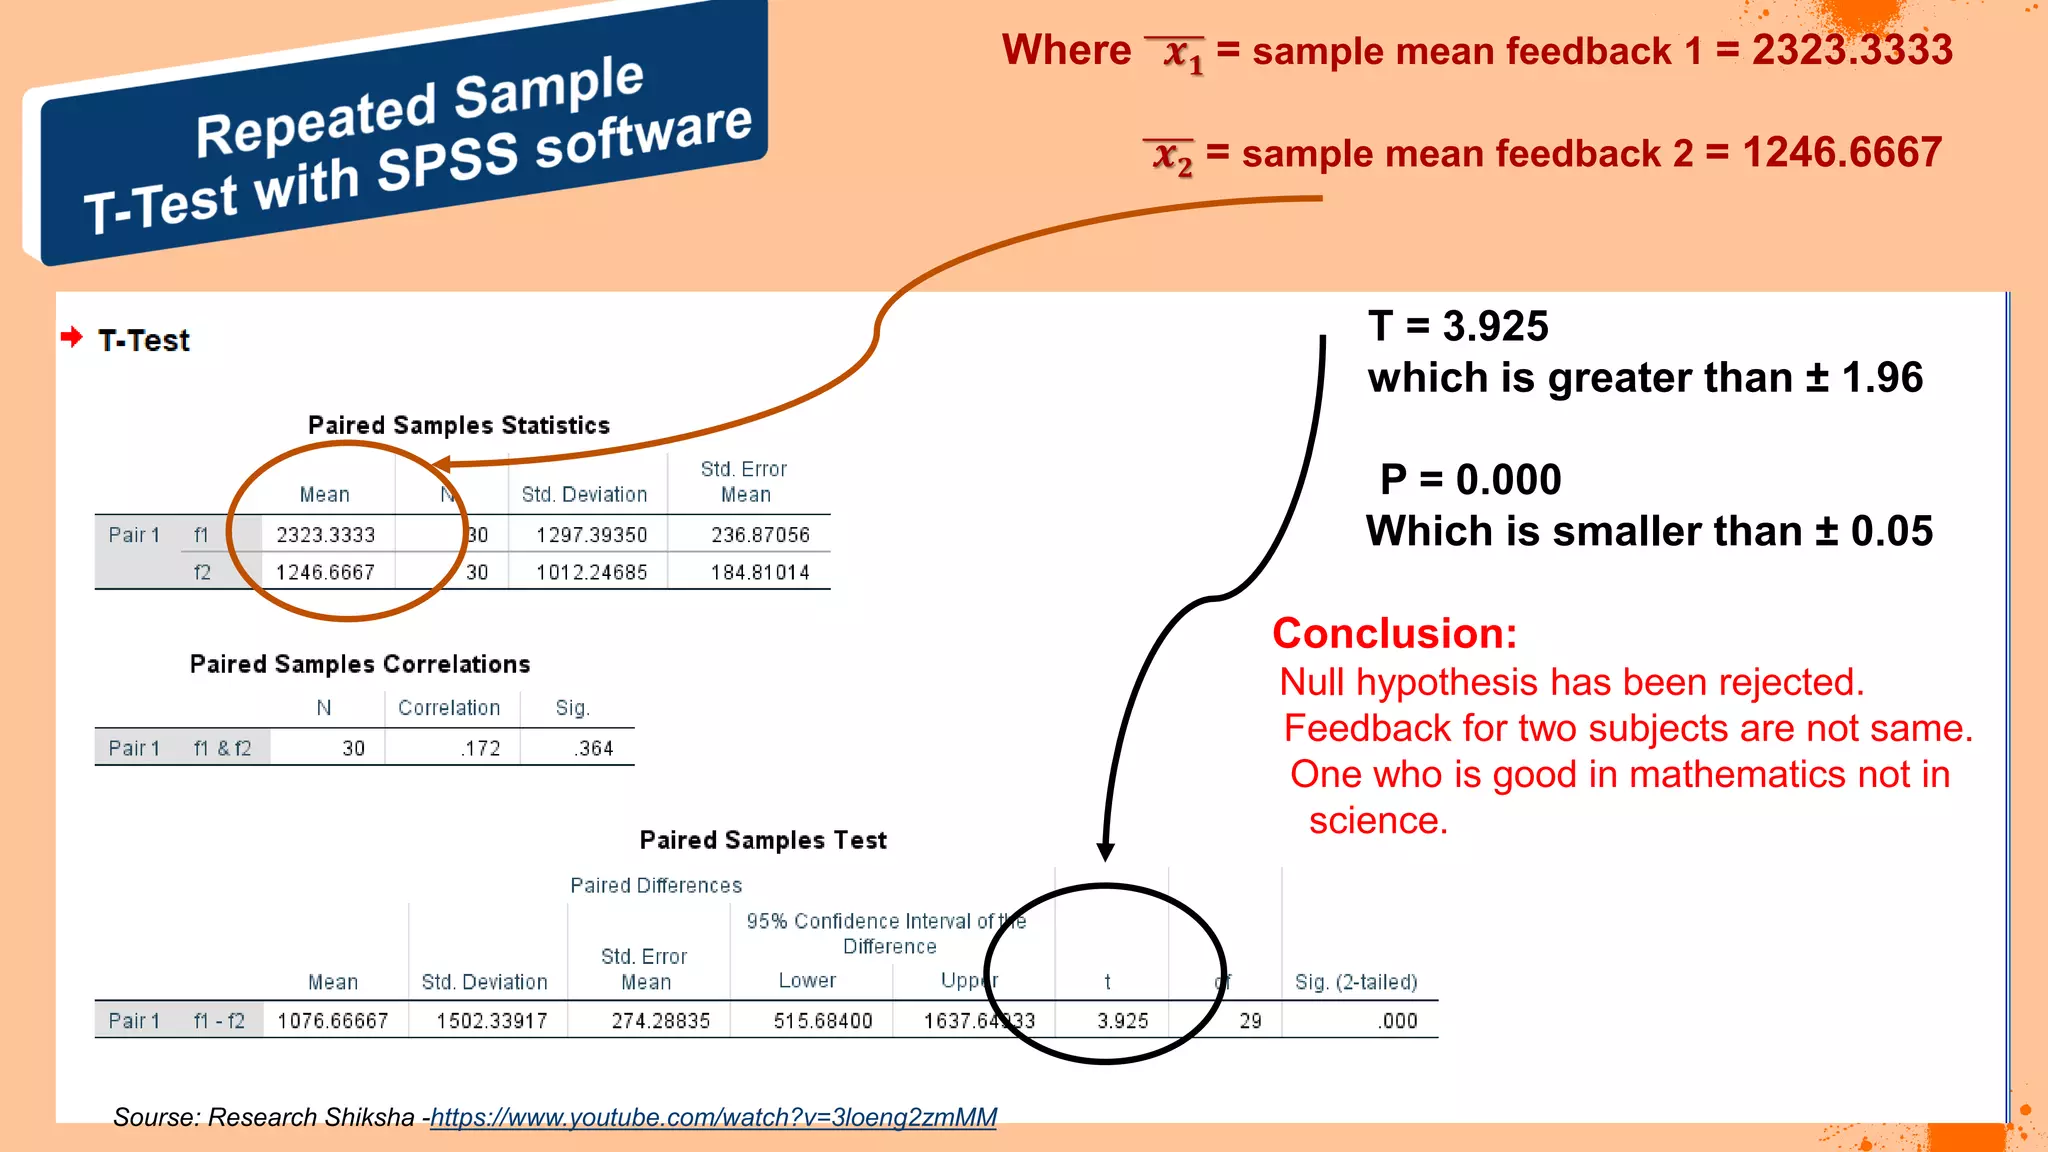


The document discusses hypotheses in research, detailing the definitions and types including null and alternative hypotheses, and the statistical tests associated with them such as t-tests, z-tests, and ANOVA. It presents examples of how to formulate hypotheses and perform statistical tests to validate them, including steps for conducting tests using SPSS software. Additionally, it emphasizes the importance of clear, testable hypotheses in empirical research.