Downloaded 128 times


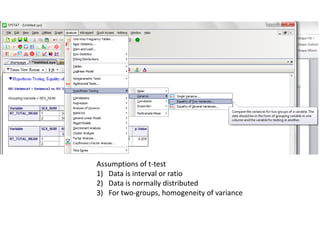
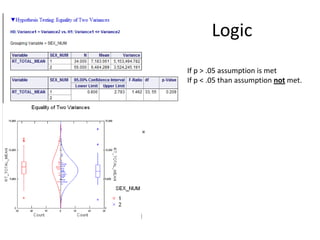
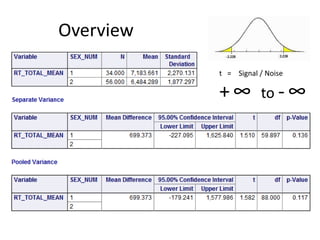
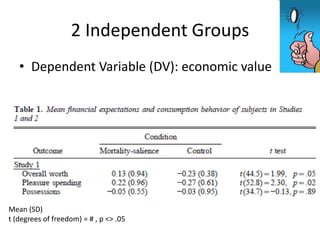

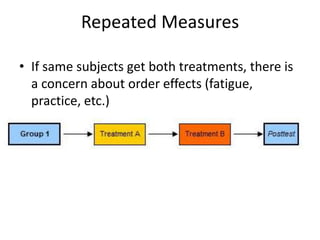
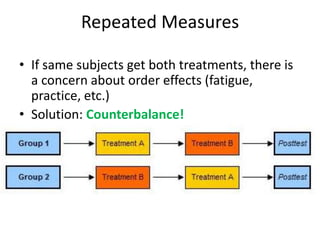
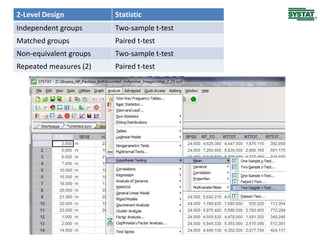
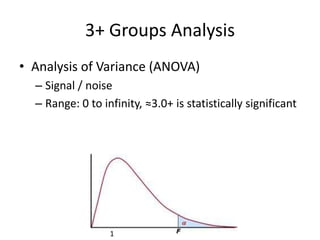
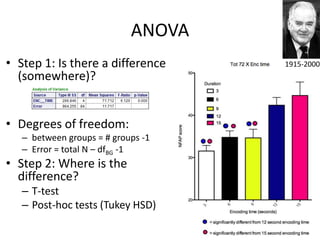
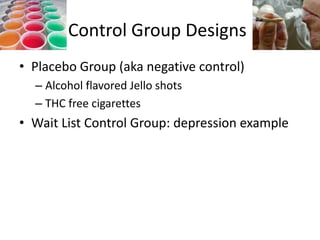
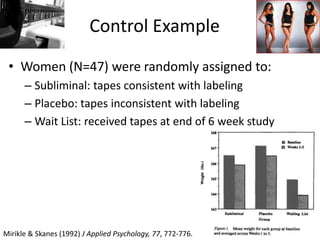
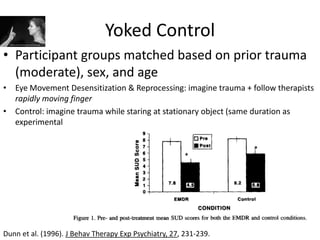
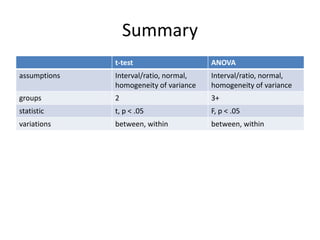

The document outlines various single-factor experimental designs, including independent groups, matched groups, non-equivalent groups, and repeated measures, highlighting their definitions and examples. It discusses the statistical methodologies associated with these designs, such as t-tests and ANOVA, meticulously detailing the assumptions required for analysis. Key studies and their findings are summarized to illustrate the use of these experimental designs in psychological research.


![Getting Started with Apache Spark: Big Data Made Simple [Free Meetup]](https://cdn.slidesharecdn.com/ss_thumbnails/apachesparkgettingstarted-260203175547-8361bcc3-thumbnail.jpg?width=640&height=640&fit=bounds)


