Download to read offline
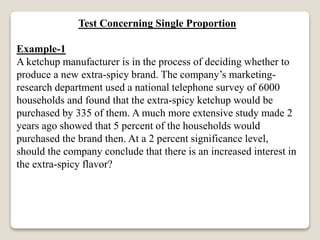


1. The document discusses hypothesis testing for single and double proportions using examples. 2. For a single proportion example, it tests whether there is increased interest in extra spicy ketchup compared to 2 years ago. It finds the current interest is significantly greater. 3. For a double proportion example, it tests whether brand A outsells brand B for cigarettes. It finds brand A outsells brand B. 4. A third example tests a cigarette company's claim that brand A outsells brand B by 8%. It finds the 8% difference claim is valid.