Download to read offline


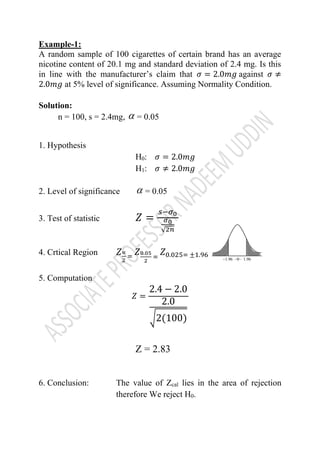
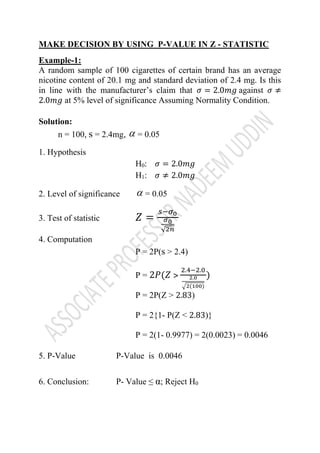

This document discusses hypothesis testing using p-values. It provides an example to test whether the standard deviation of nicotine content in a sample of 100 cigarettes matches the manufacturer's claim of 2.0 mg. The sample standard deviation is calculated to be 2.4 mg. Using either the classical approach of comparing the z-score to critical values, or the p-value approach of calculating the probability of obtaining a test statistic at least as extreme as what was observed, the null hypothesis that the standard deviation equals 2.0 mg is rejected, as the evidence against it is very strong (p = 0.0046 which is less than the significance level of 0.05).