Download to read offline

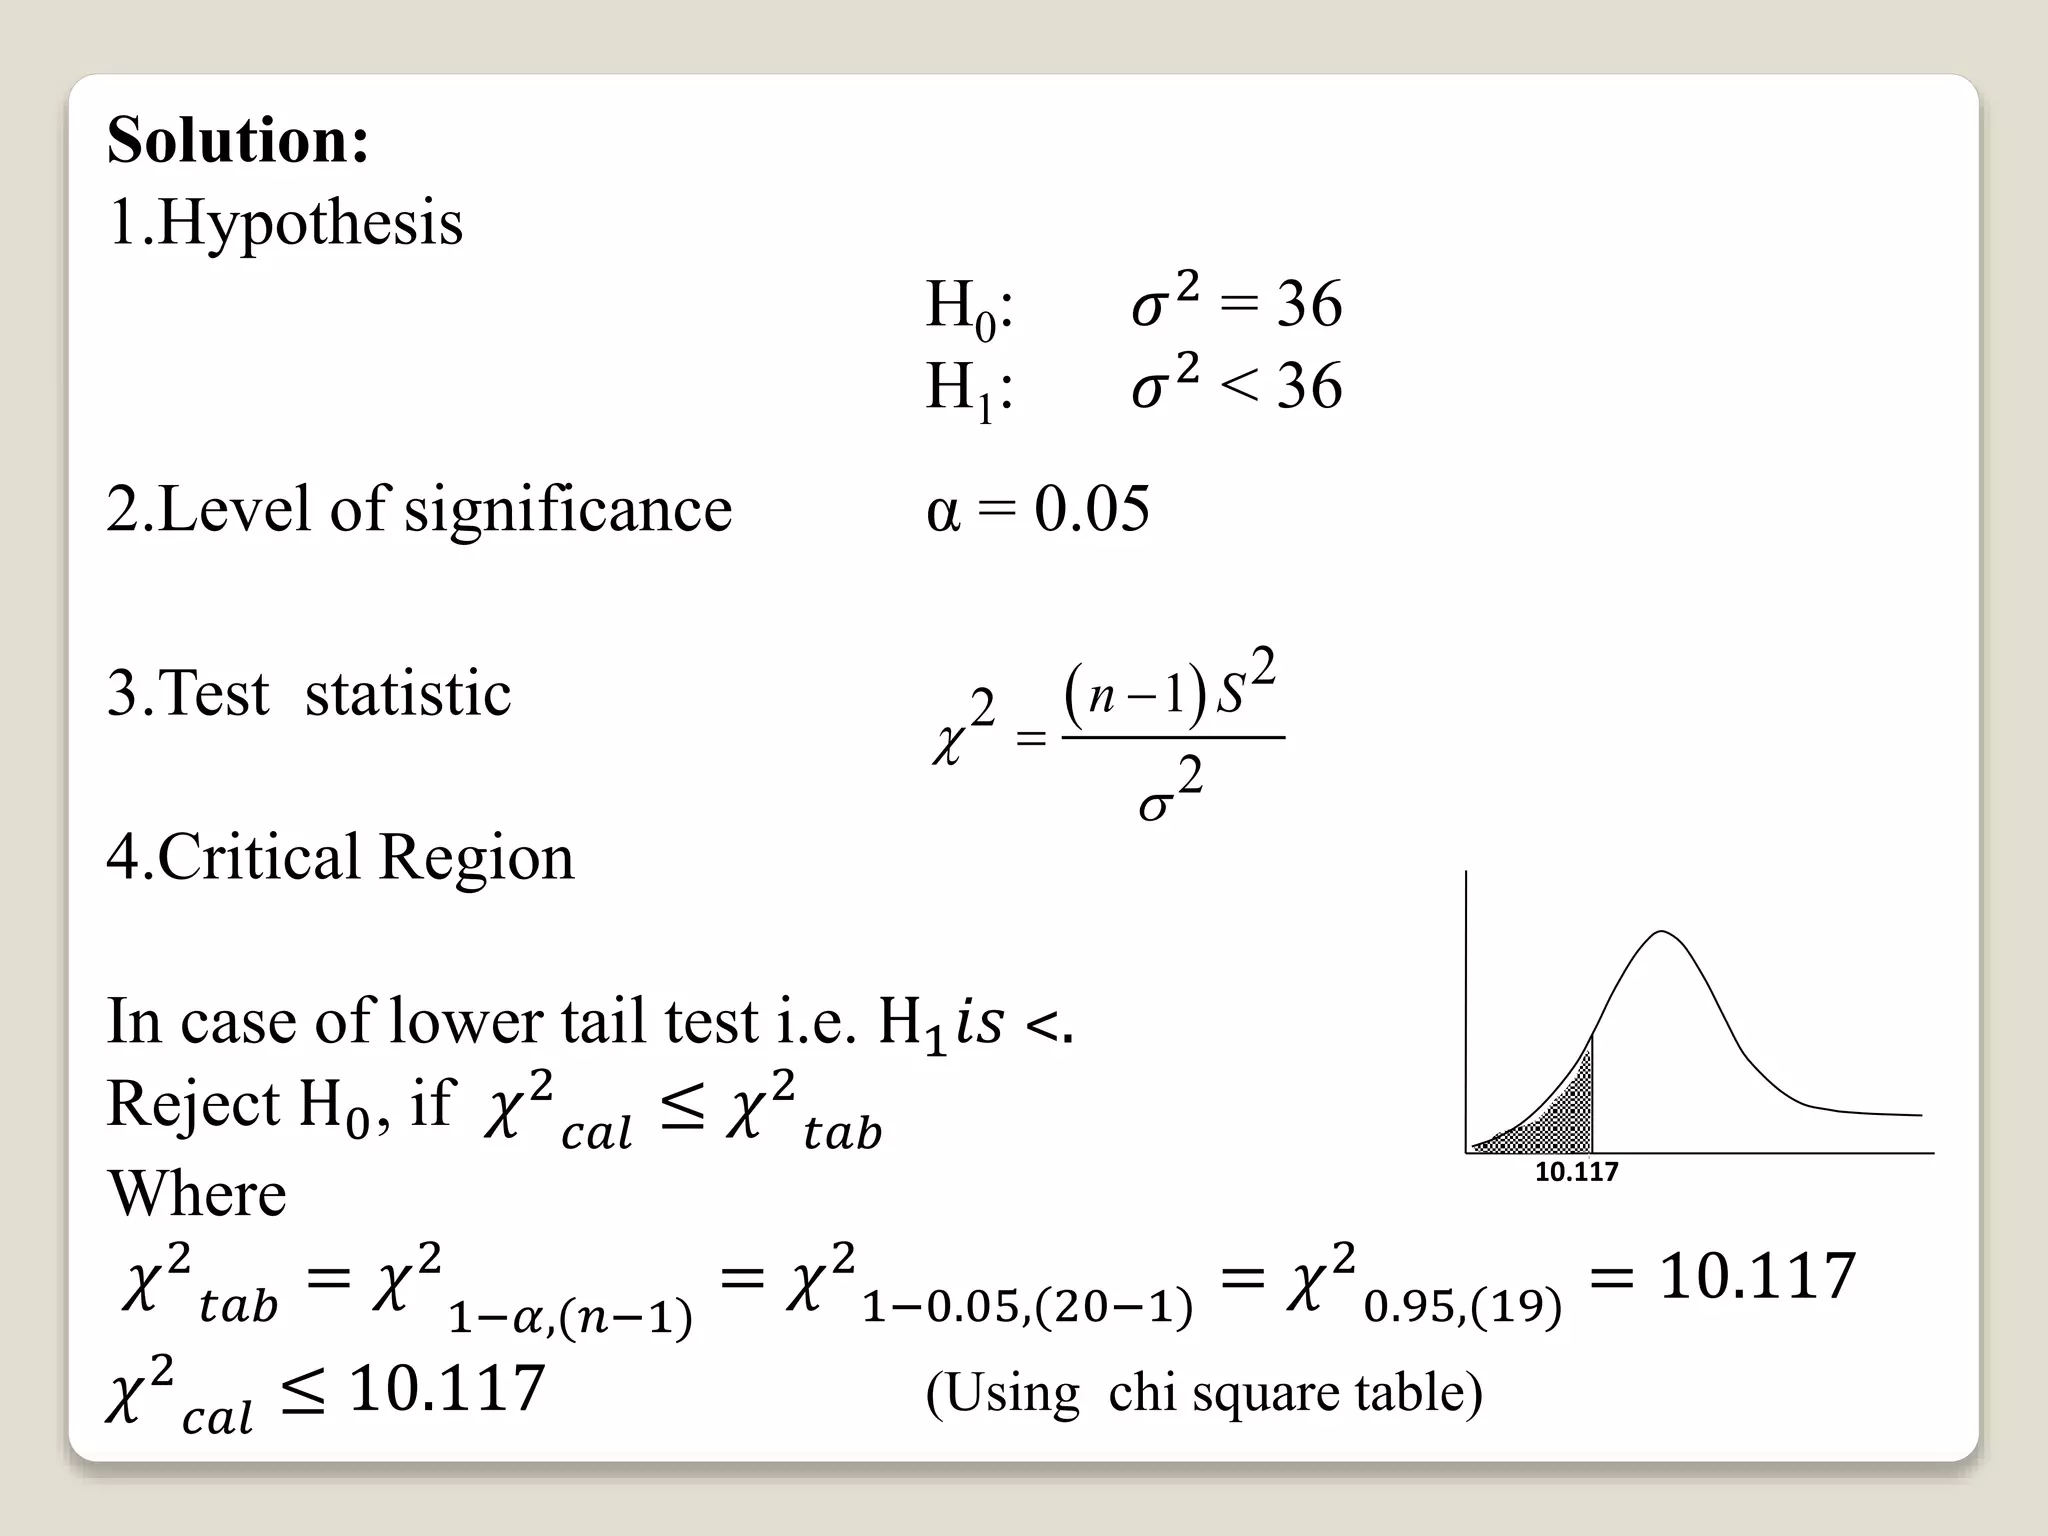
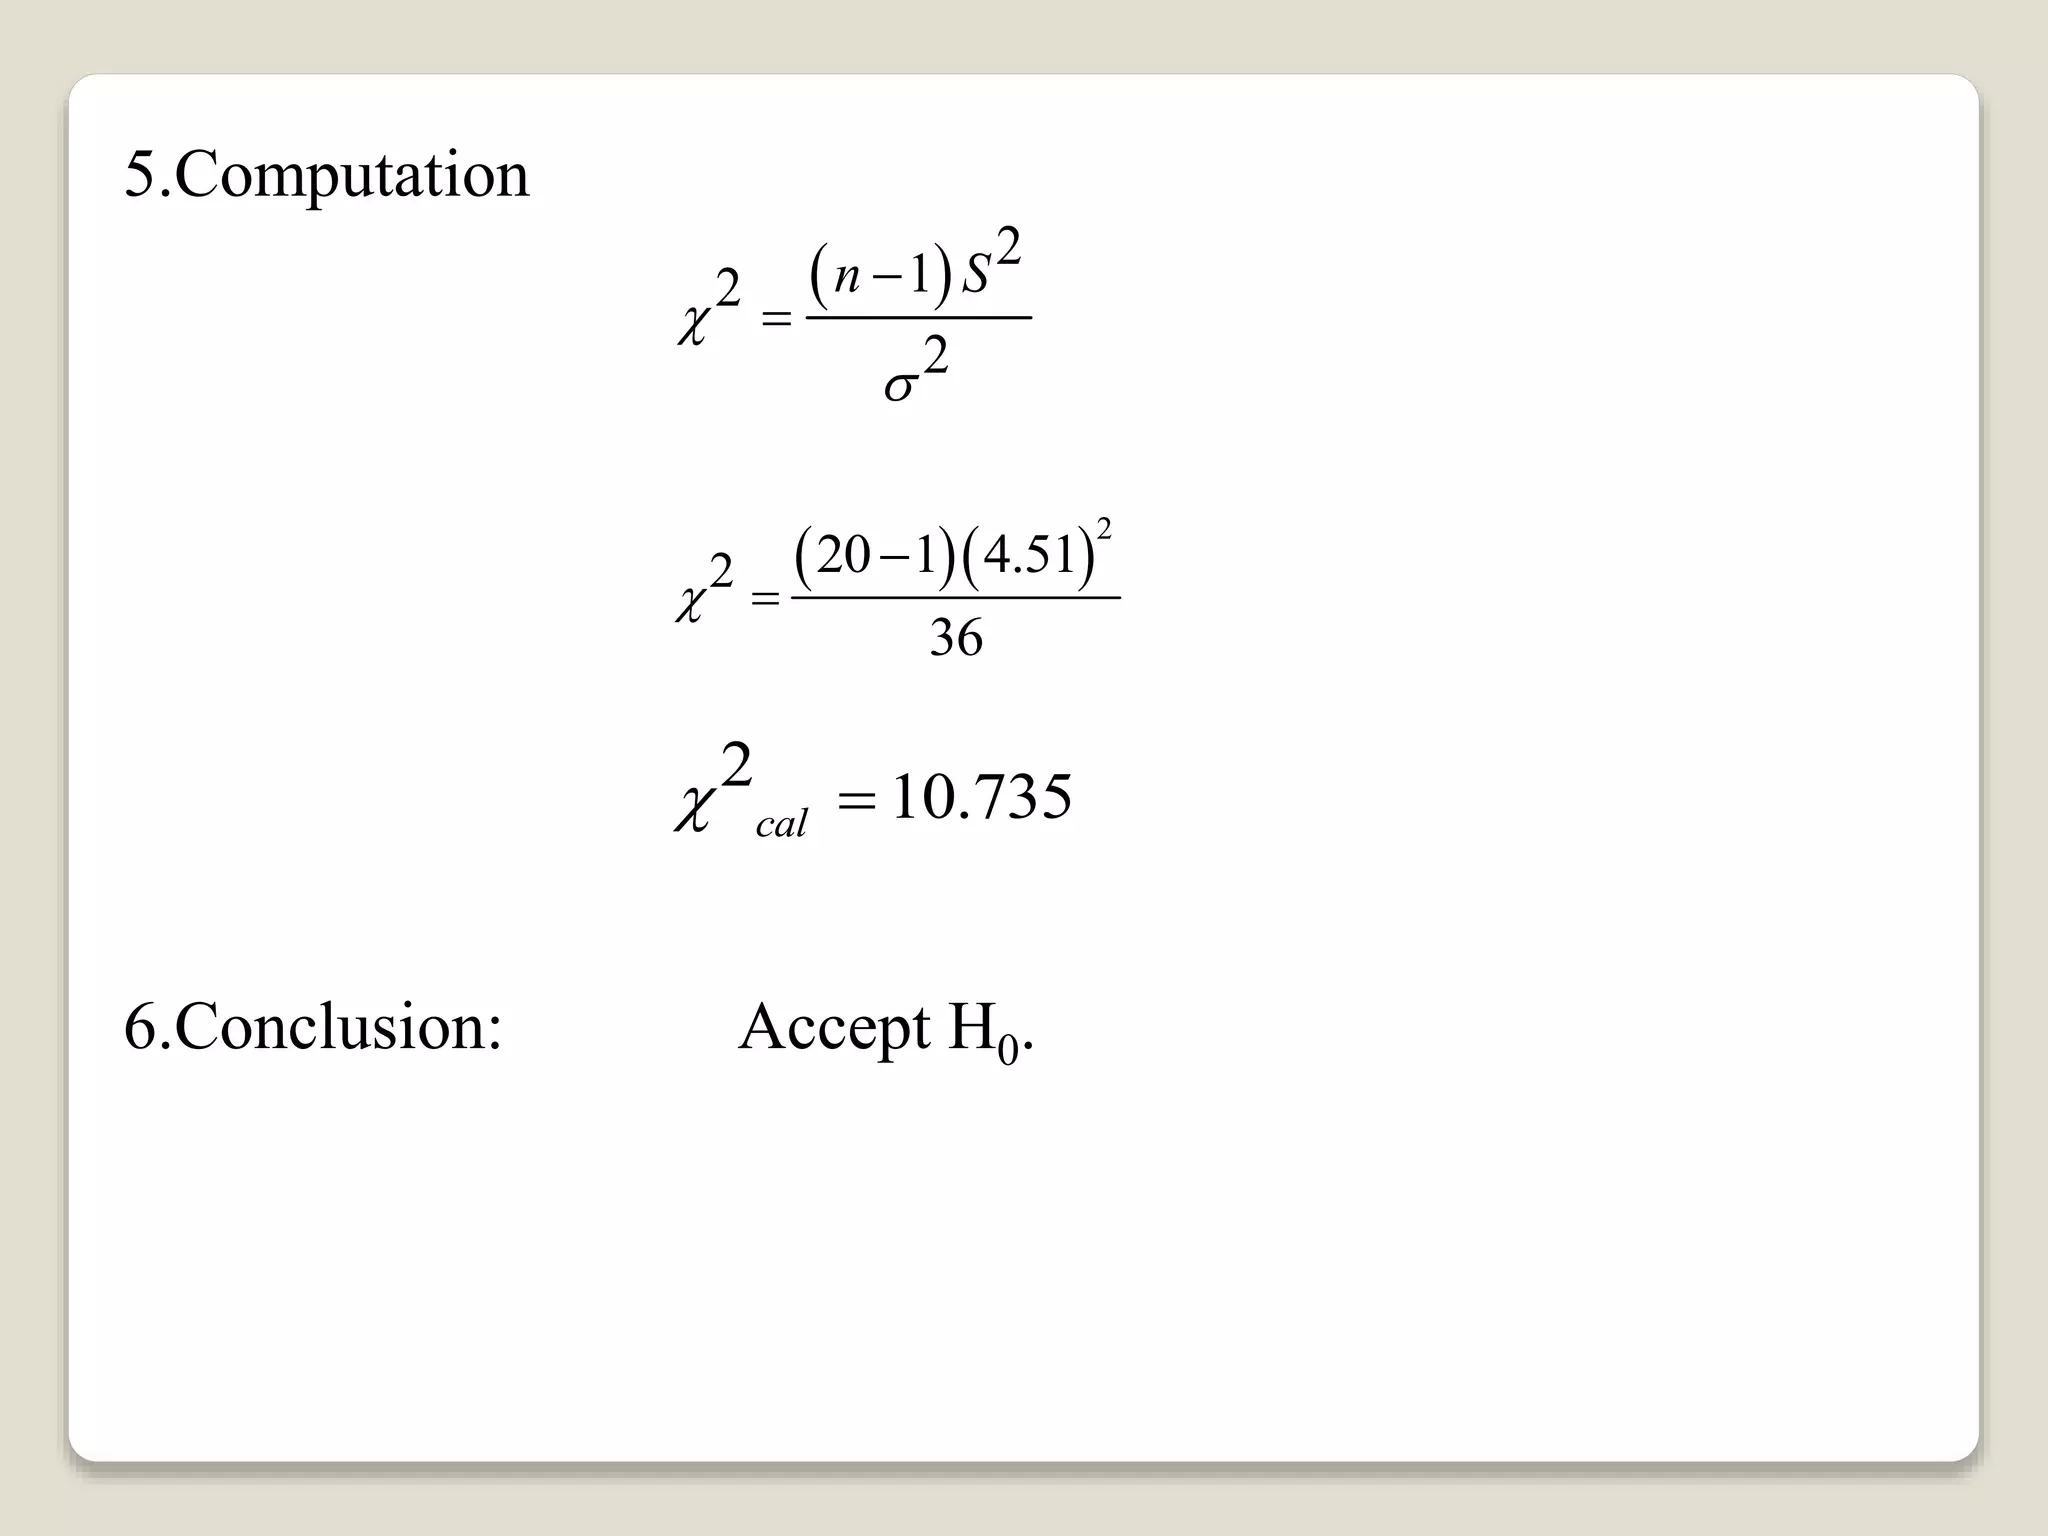
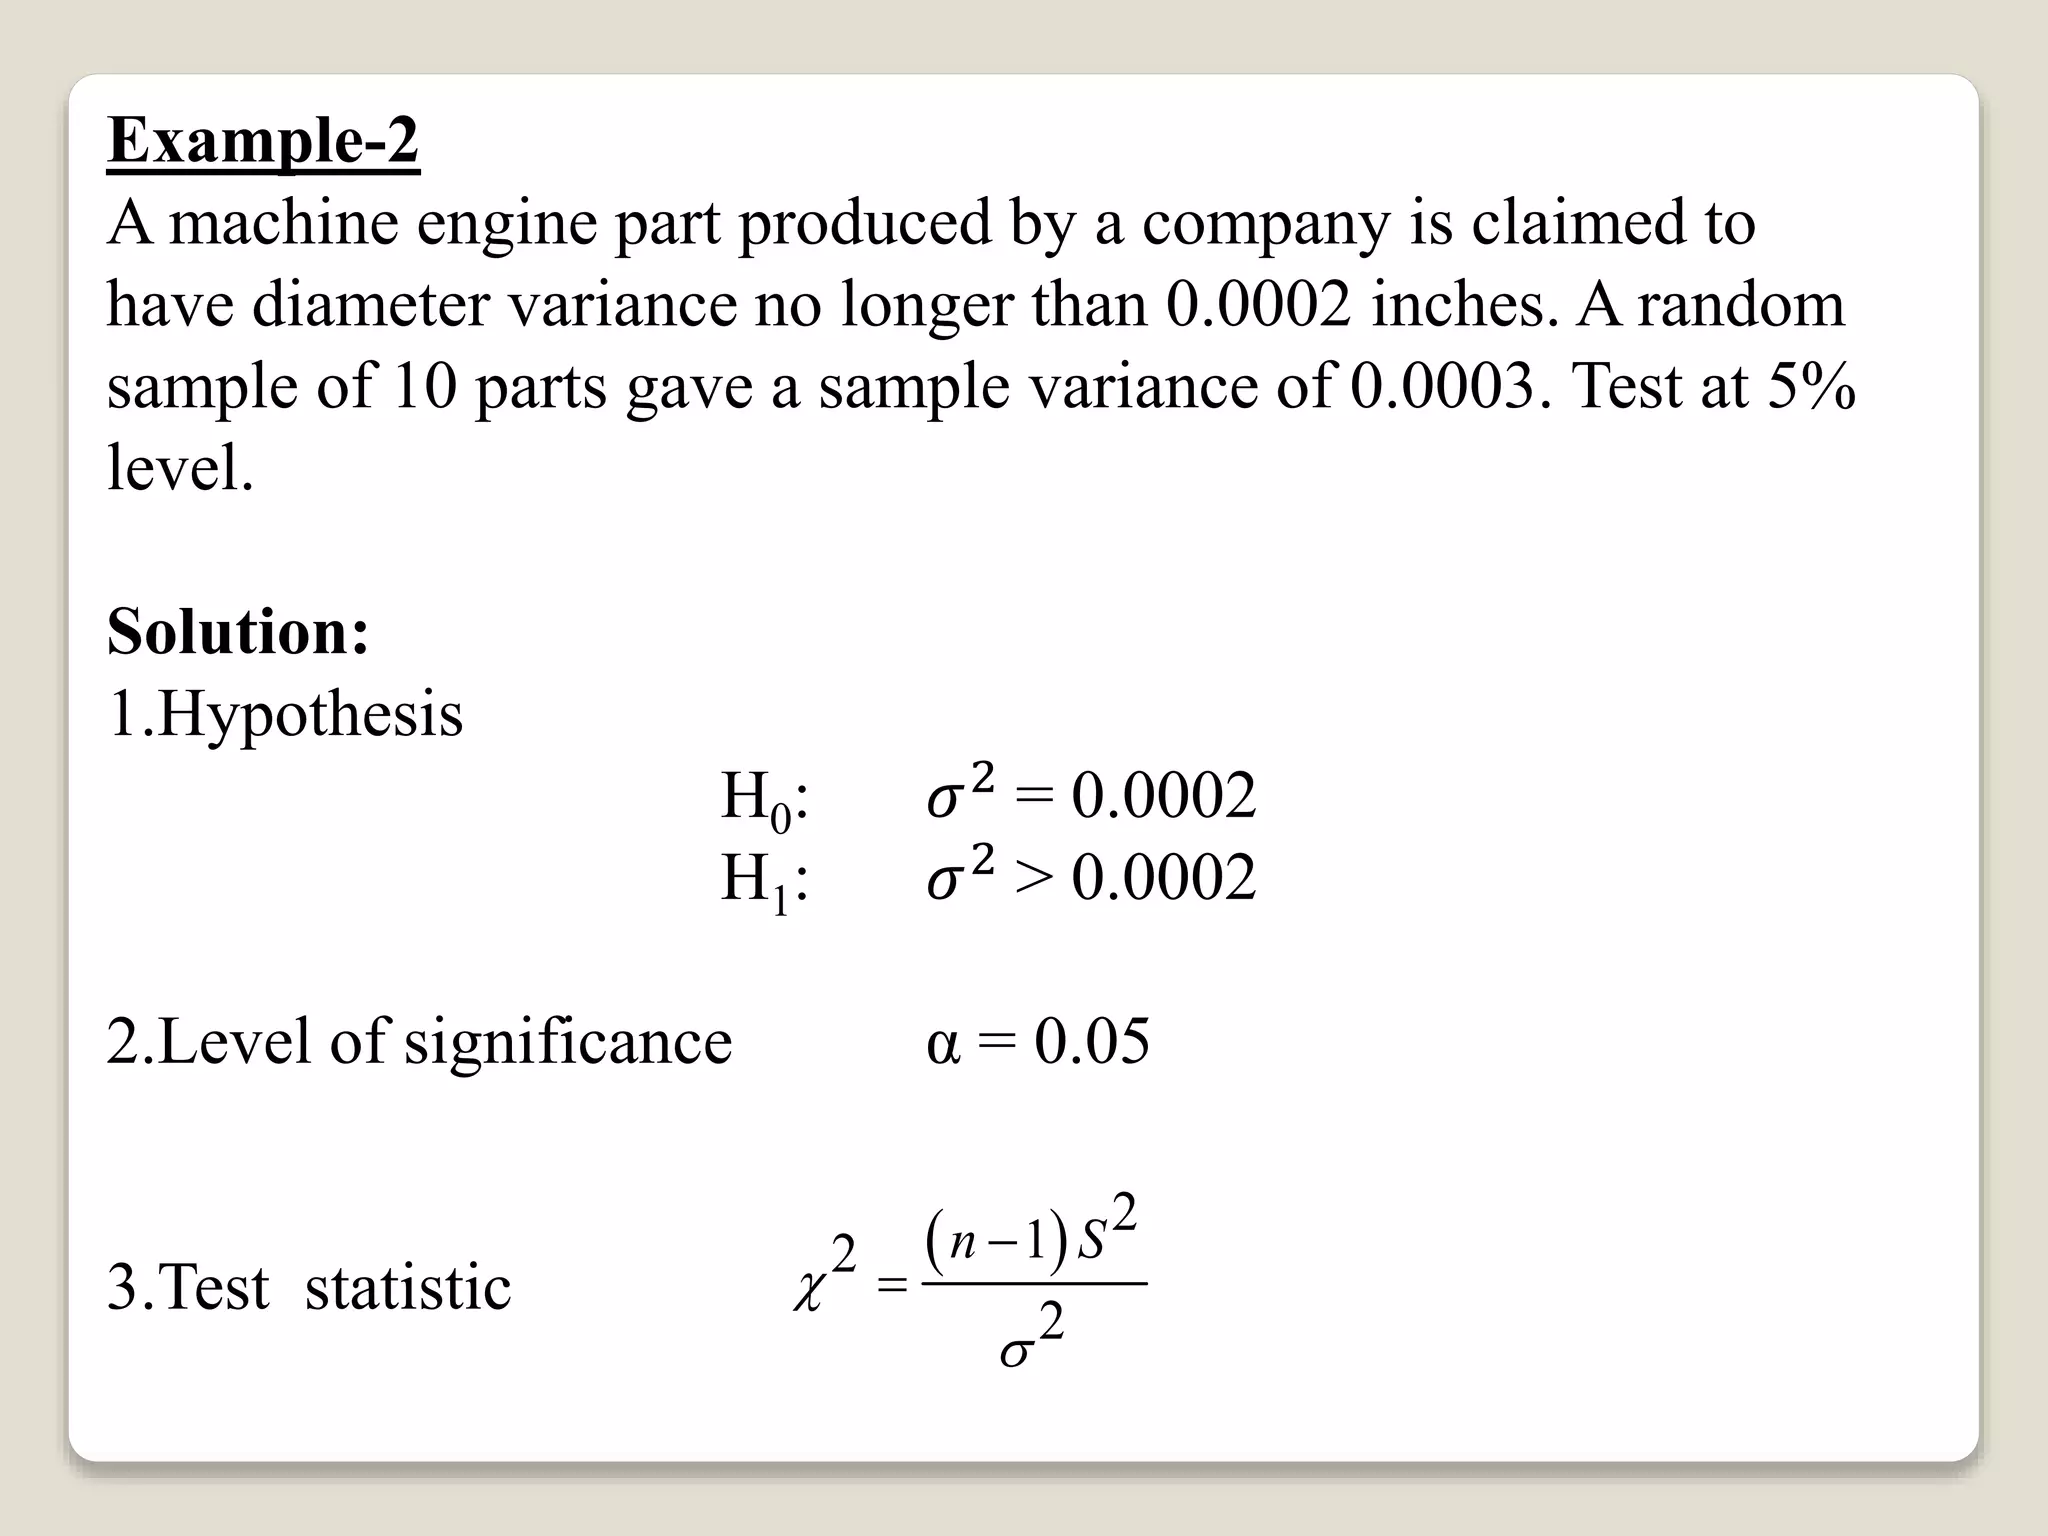
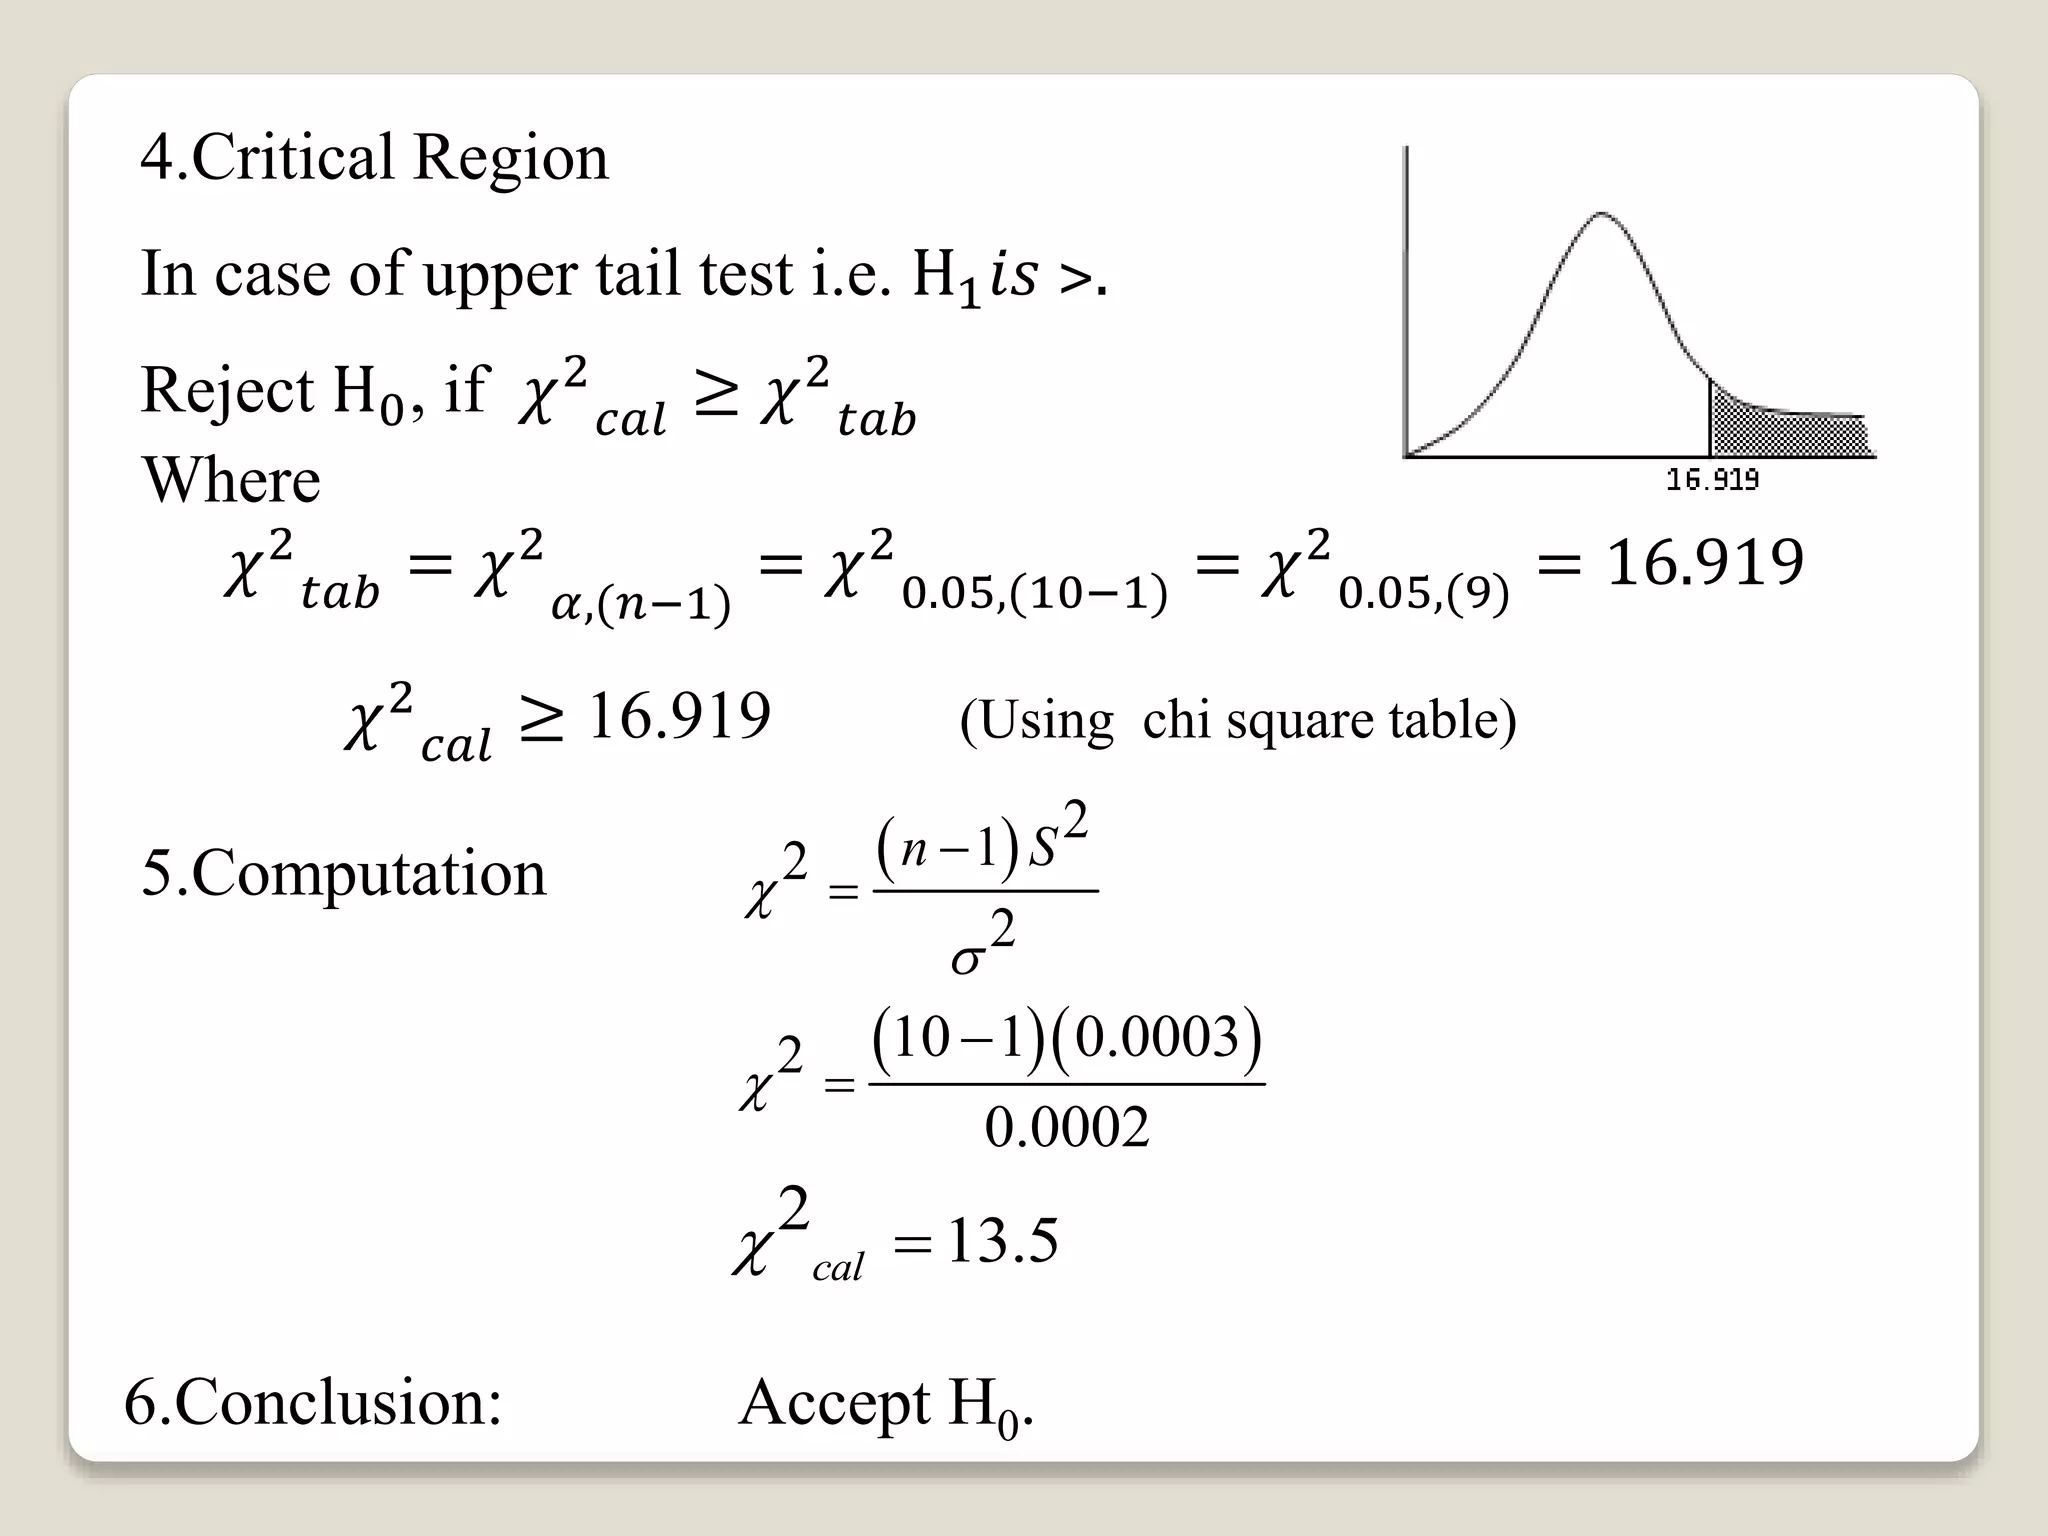

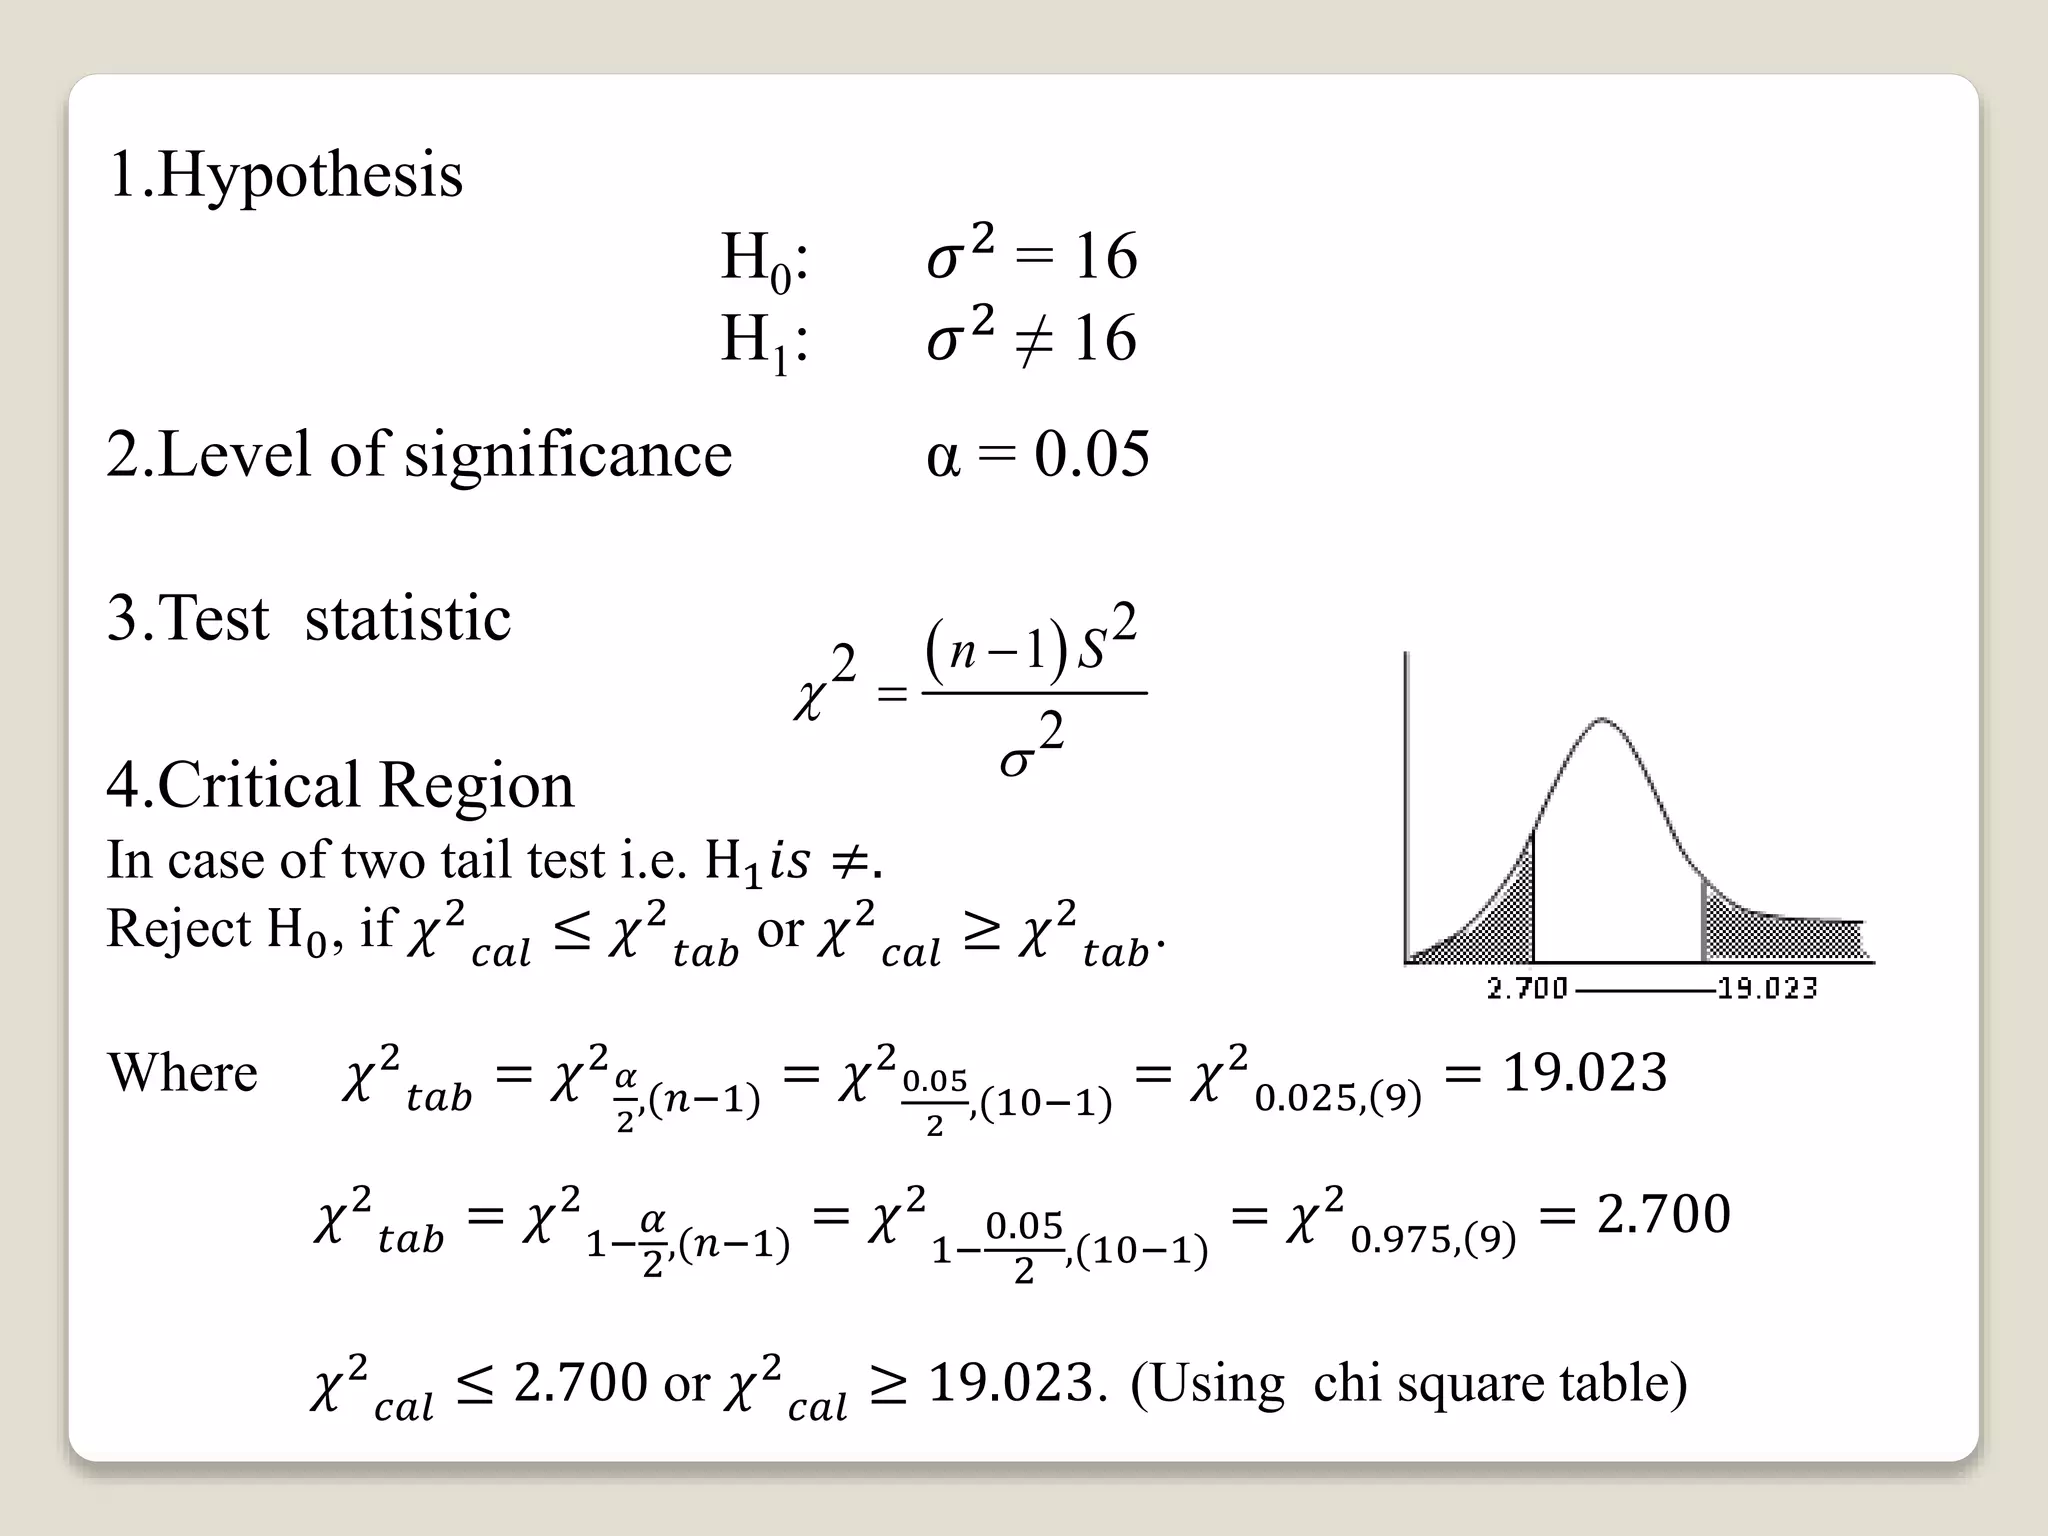


This document discusses hypothesis testing for single variance. It provides three examples of testing hypotheses about population variance using a chi-square distribution. The first two examples test if a sample variance is equal to or less than a hypothesized value. The third example tests if a sample variance is equal to a hypothesized value. Each example states the hypotheses, computes the test statistic, determines the critical region, and makes a conclusion about accepting or rejecting the null hypothesis.


