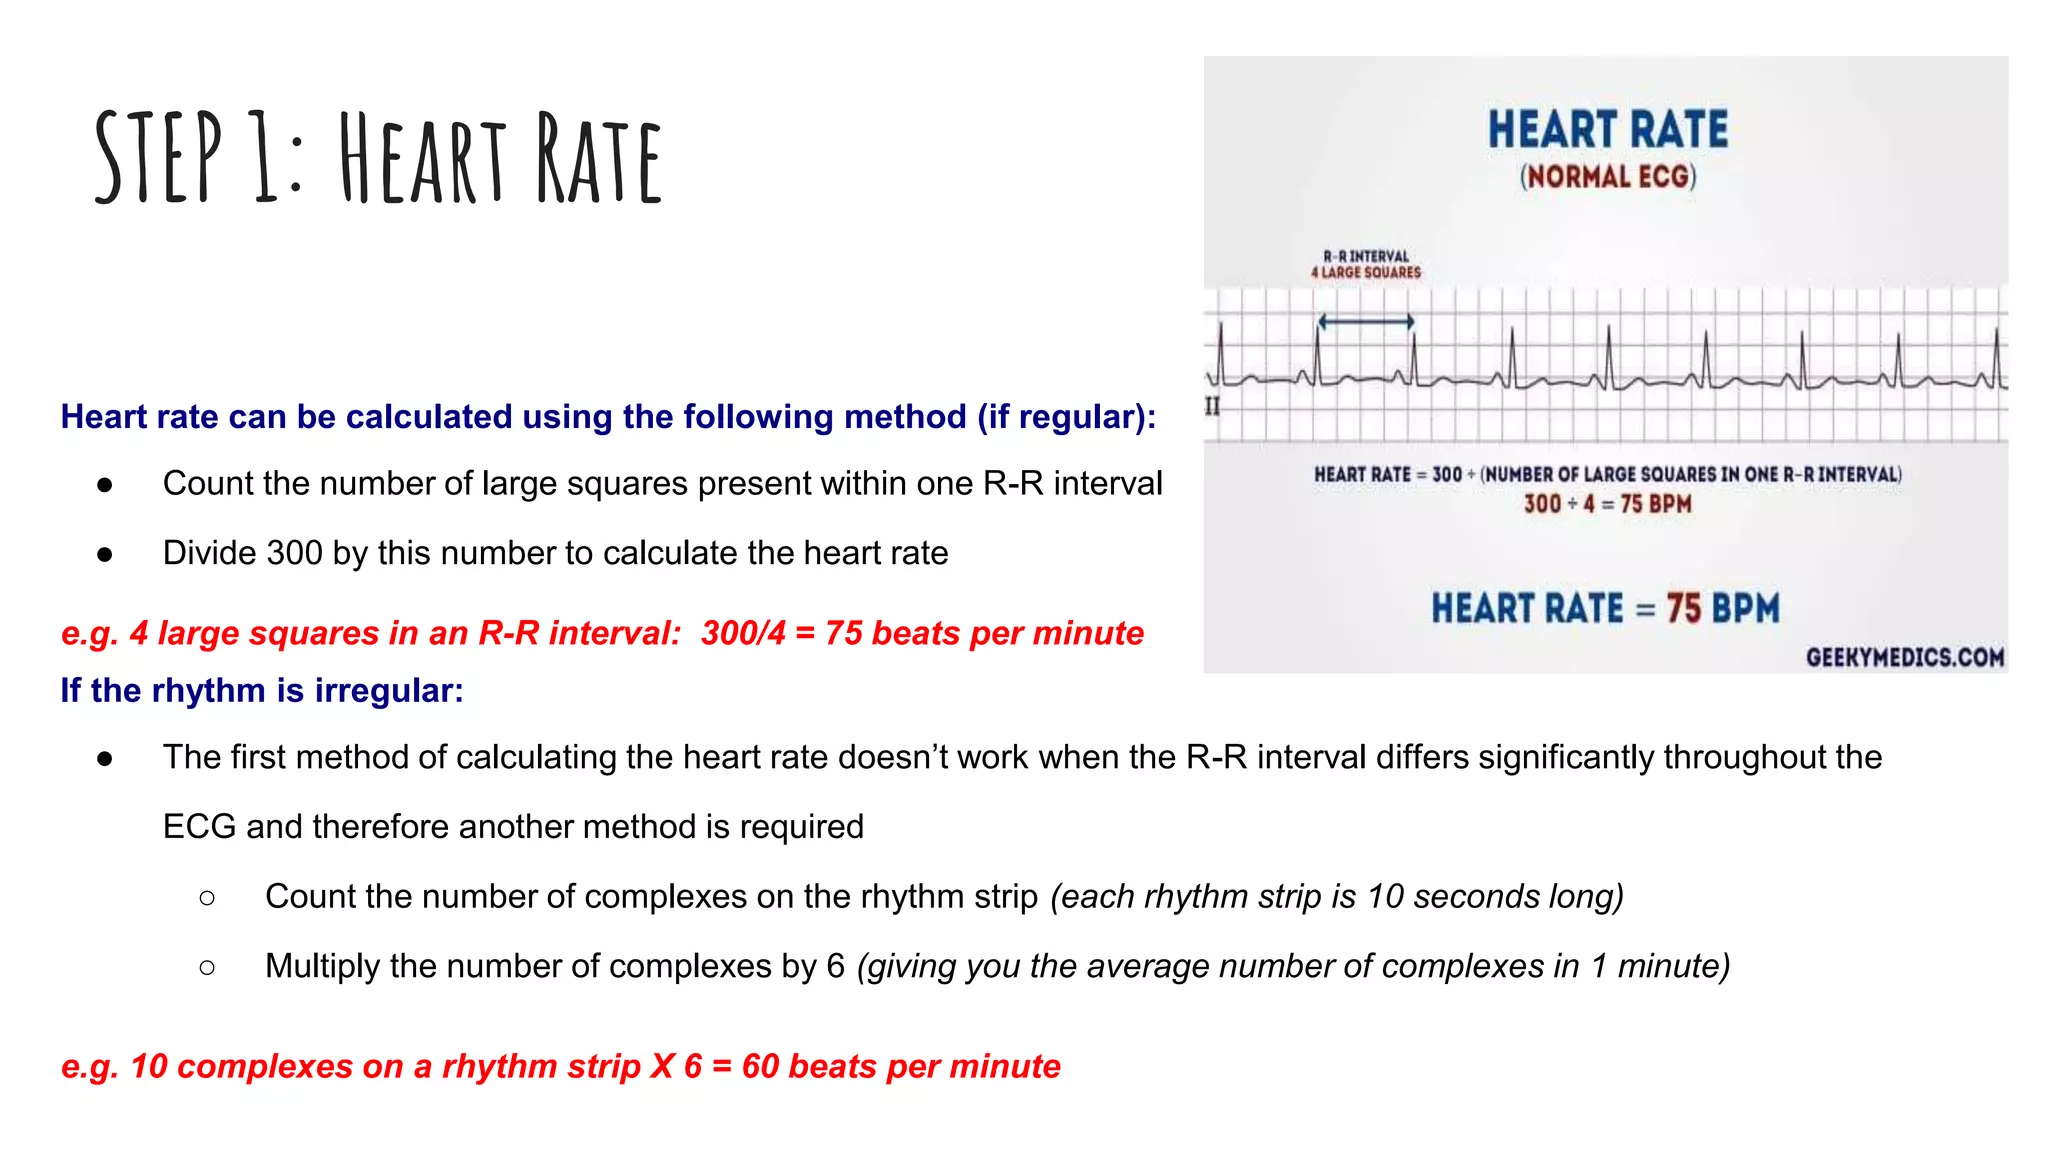
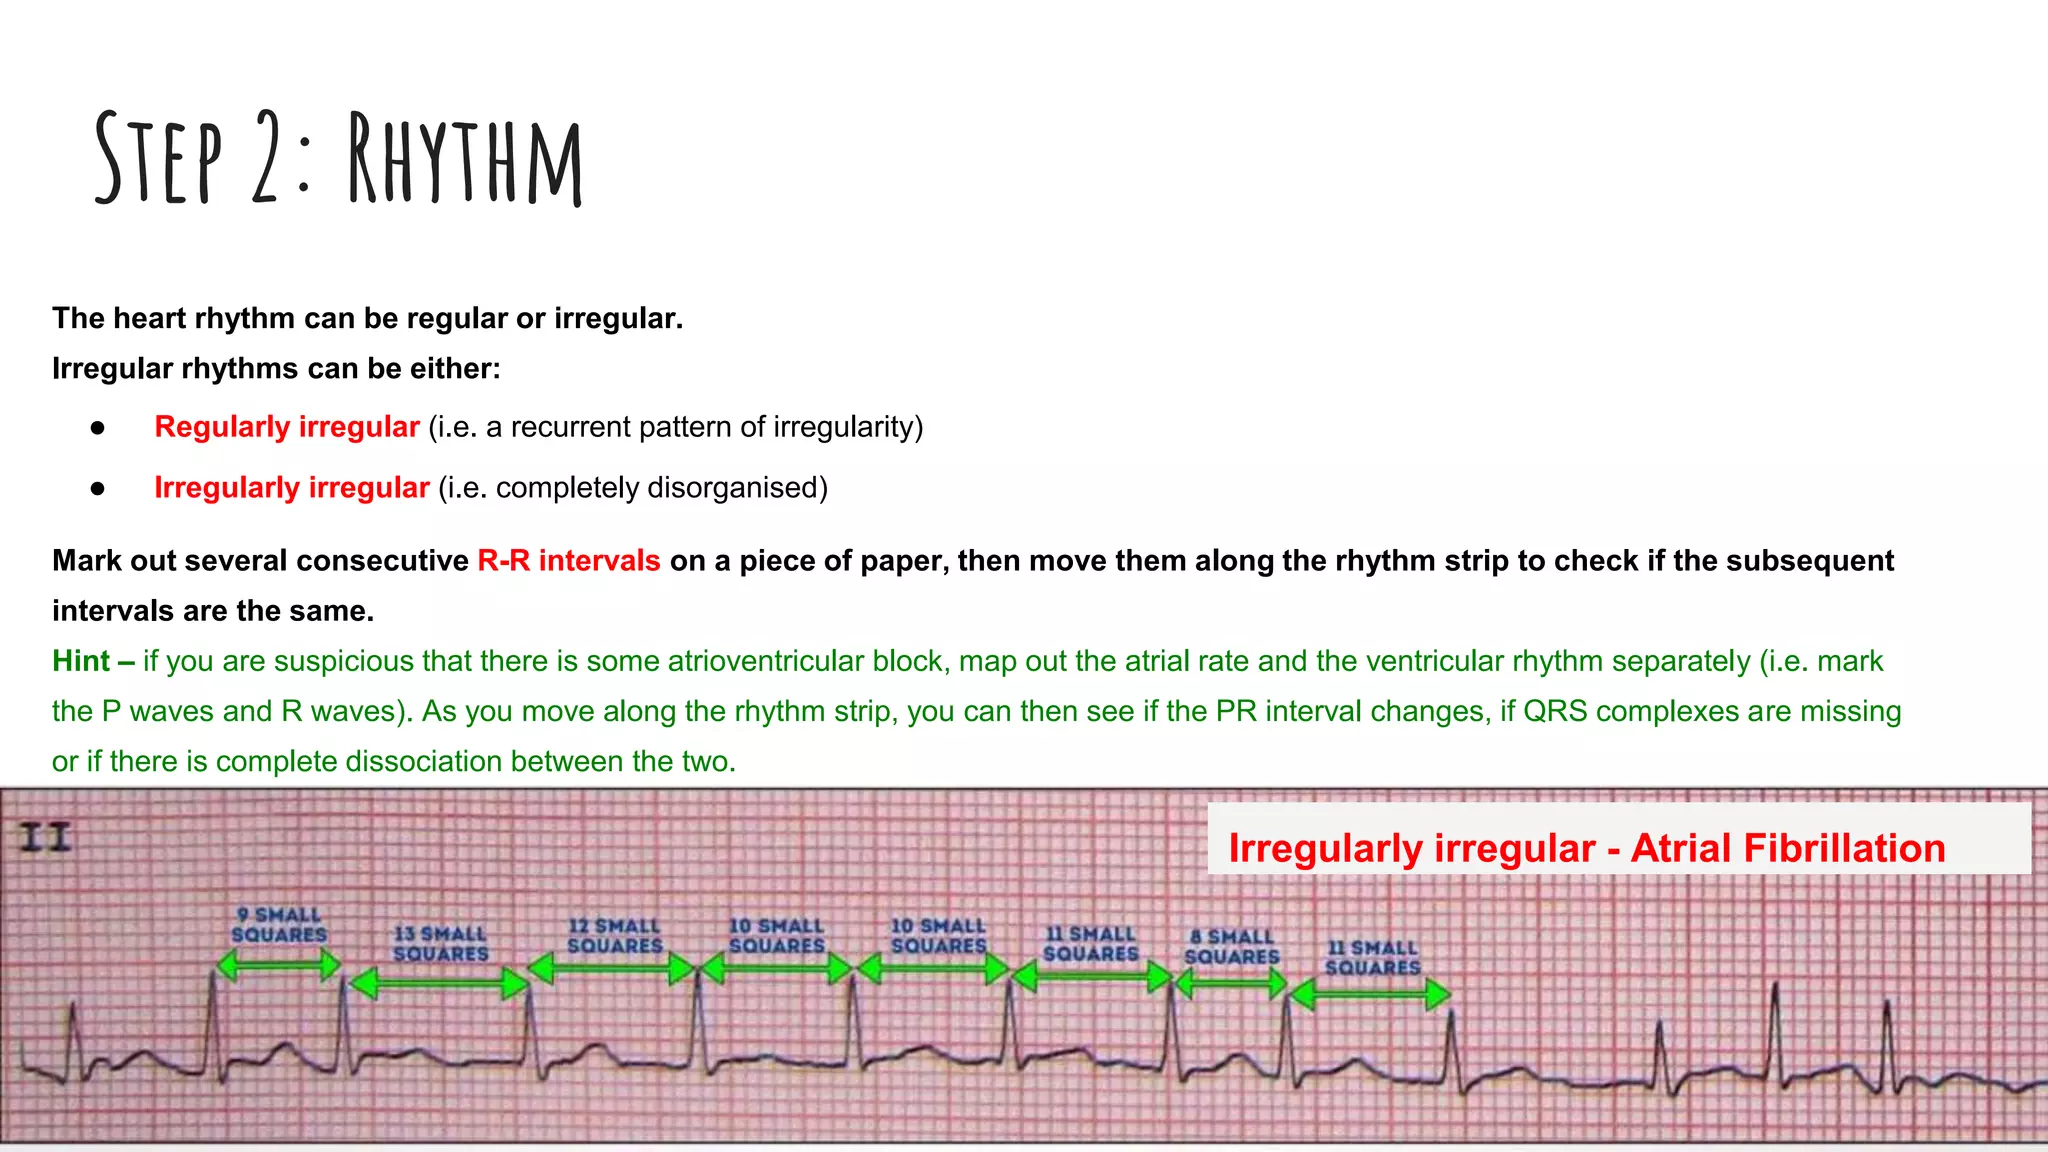
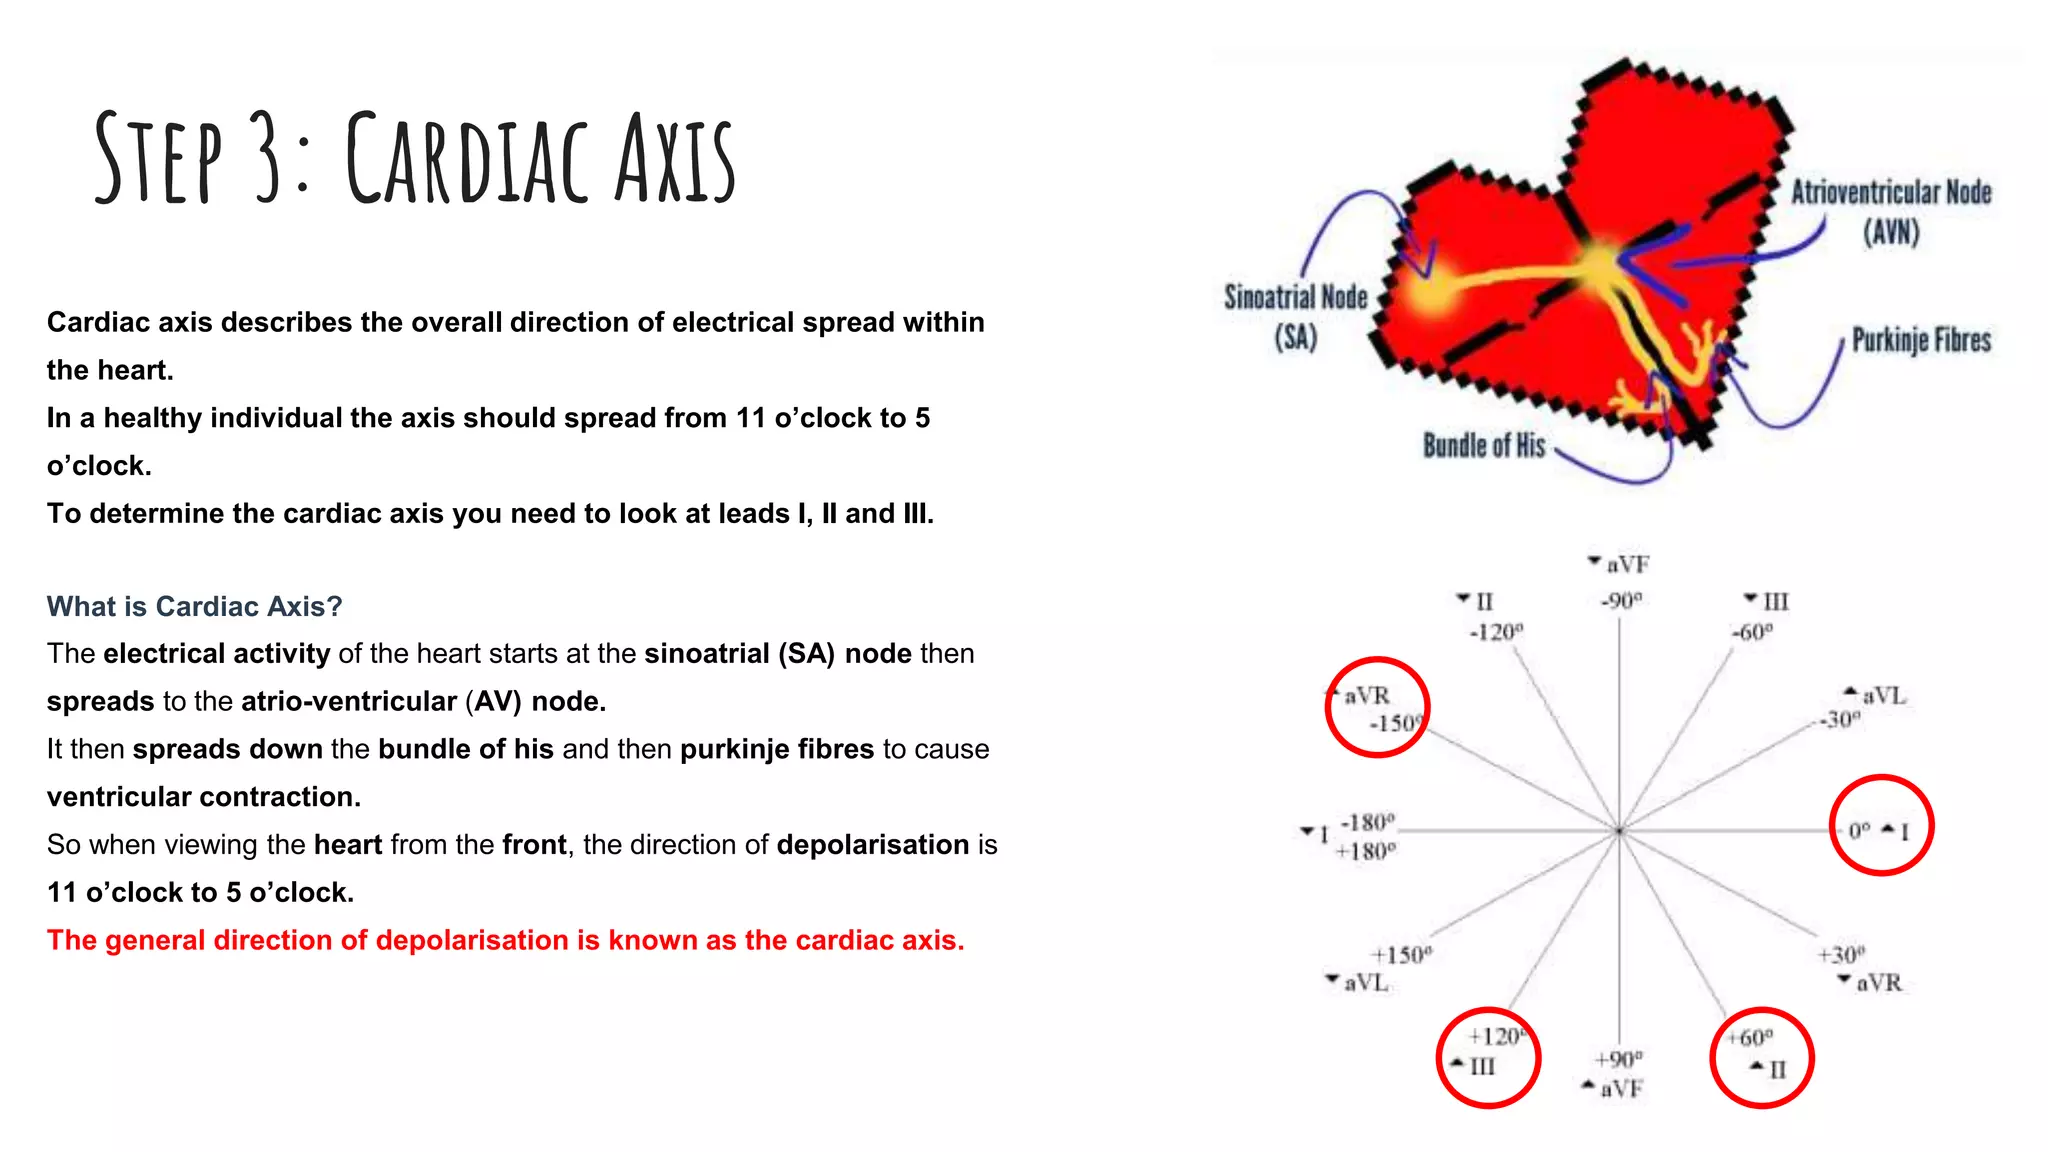
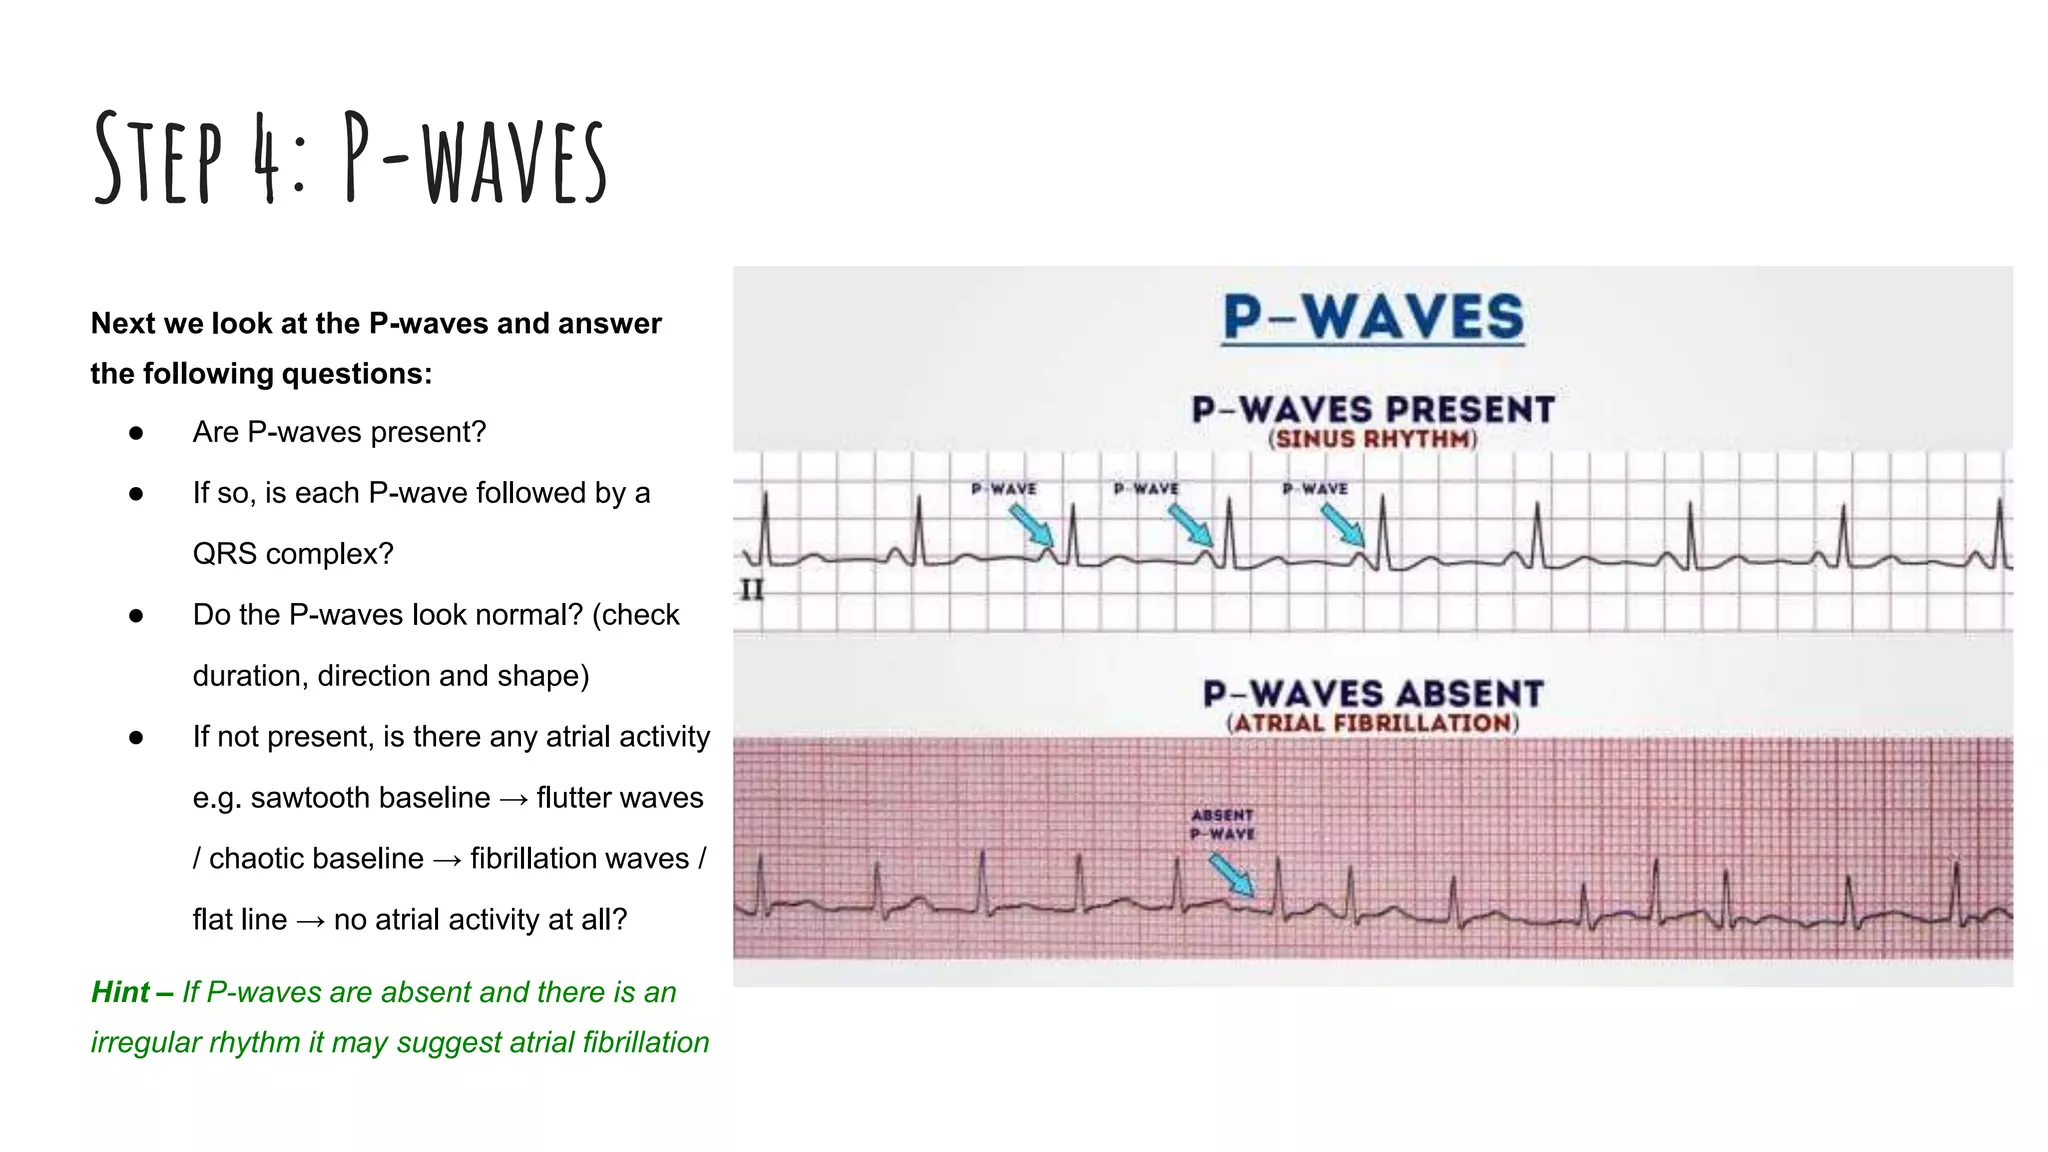
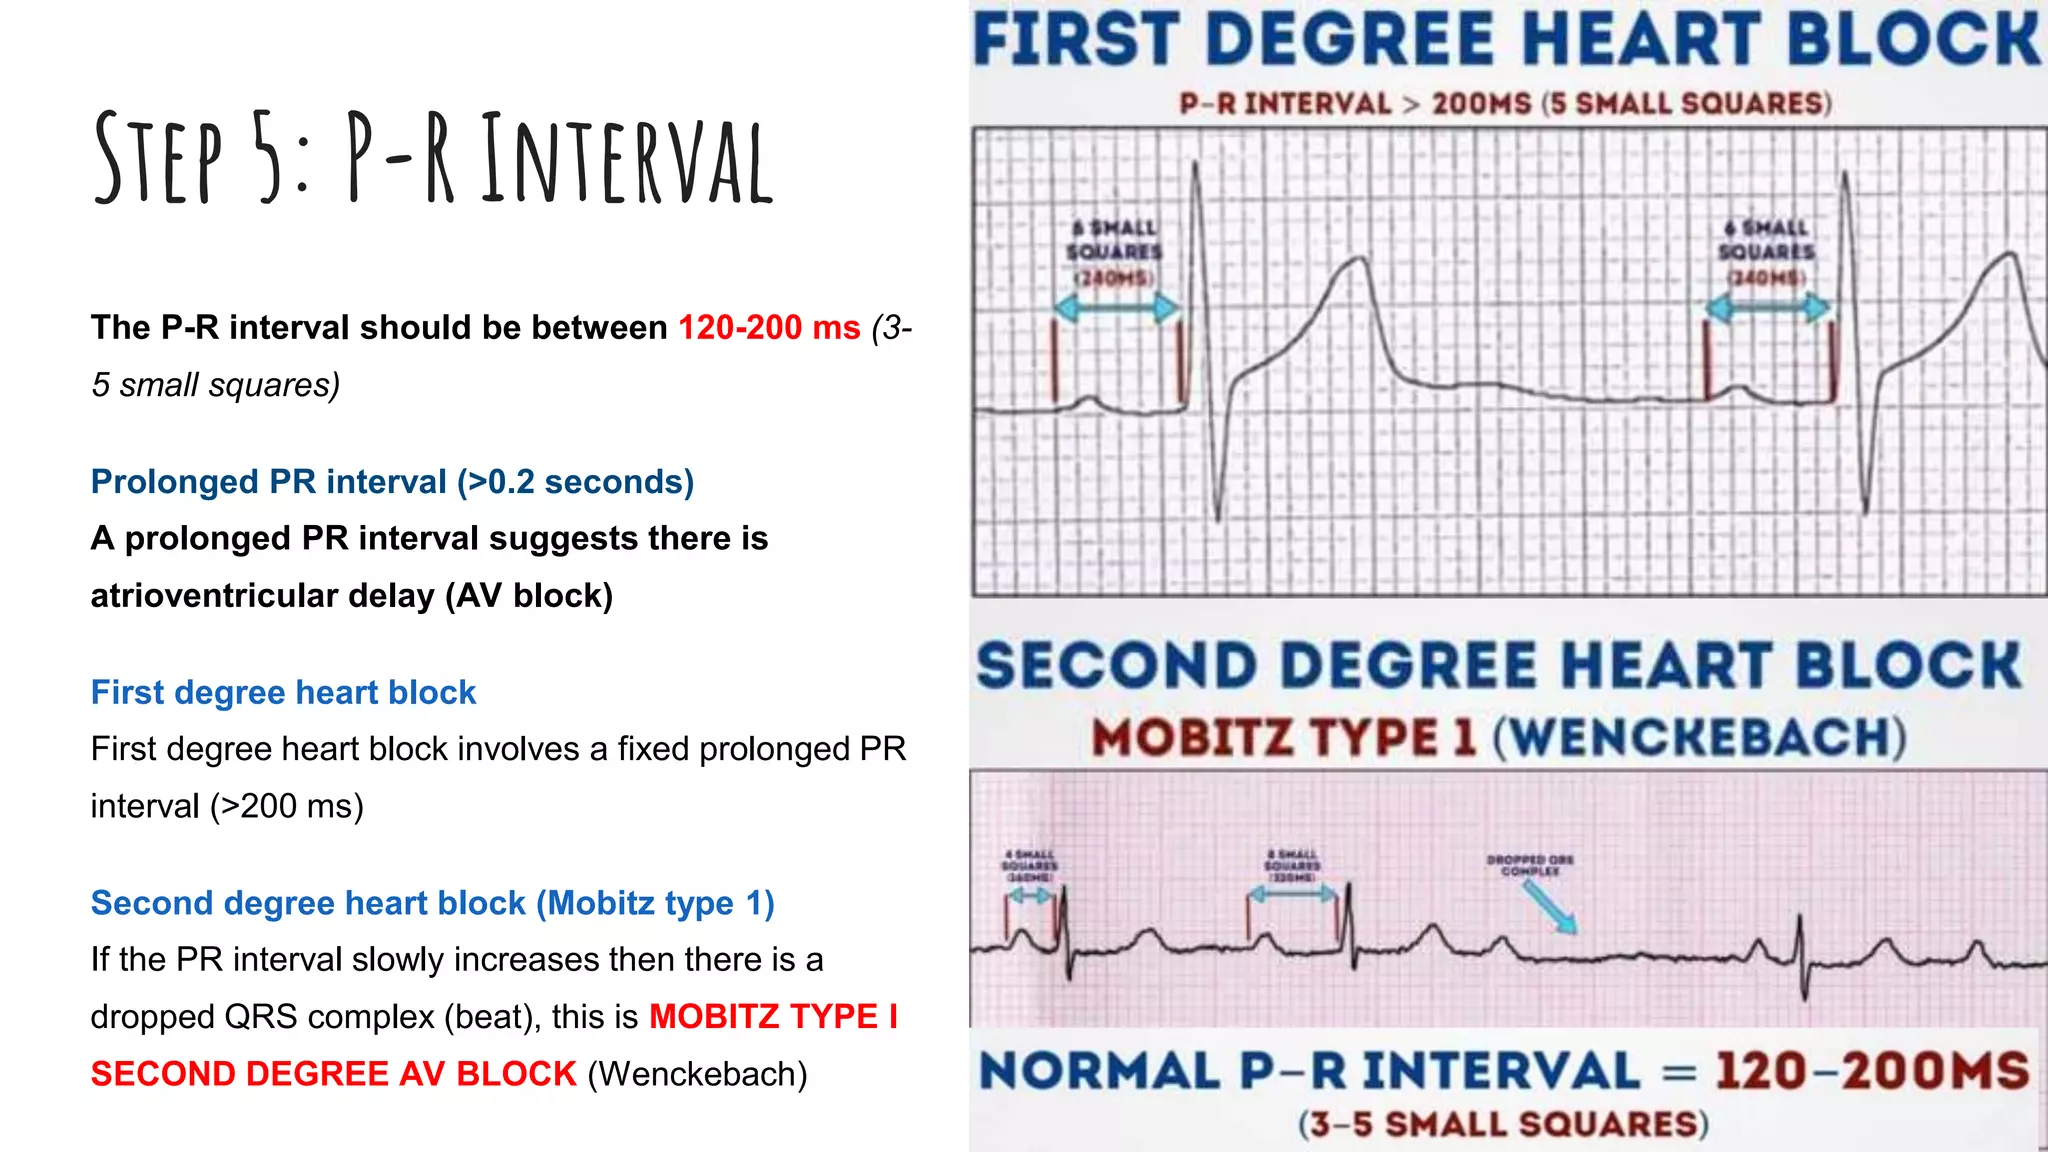
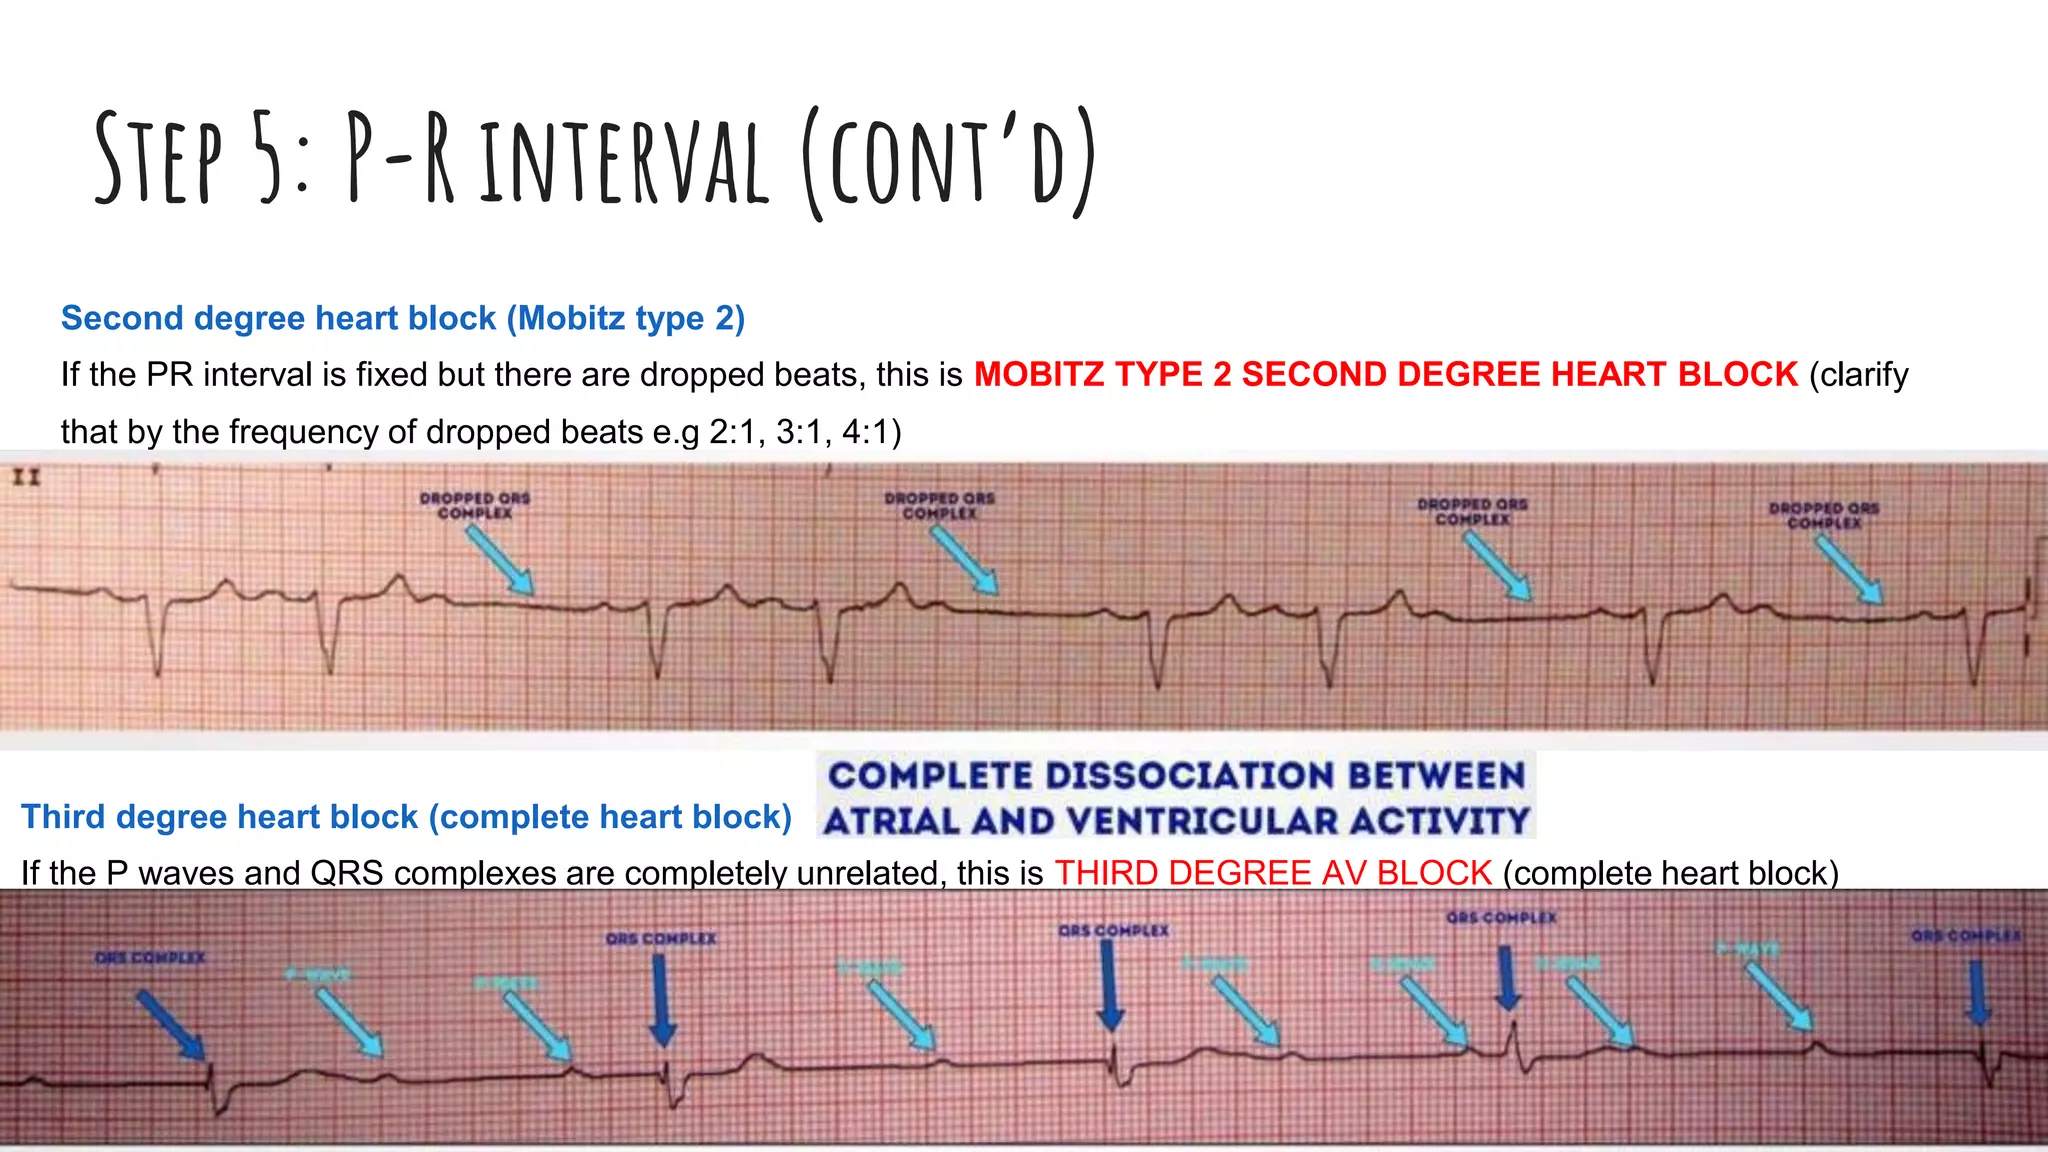
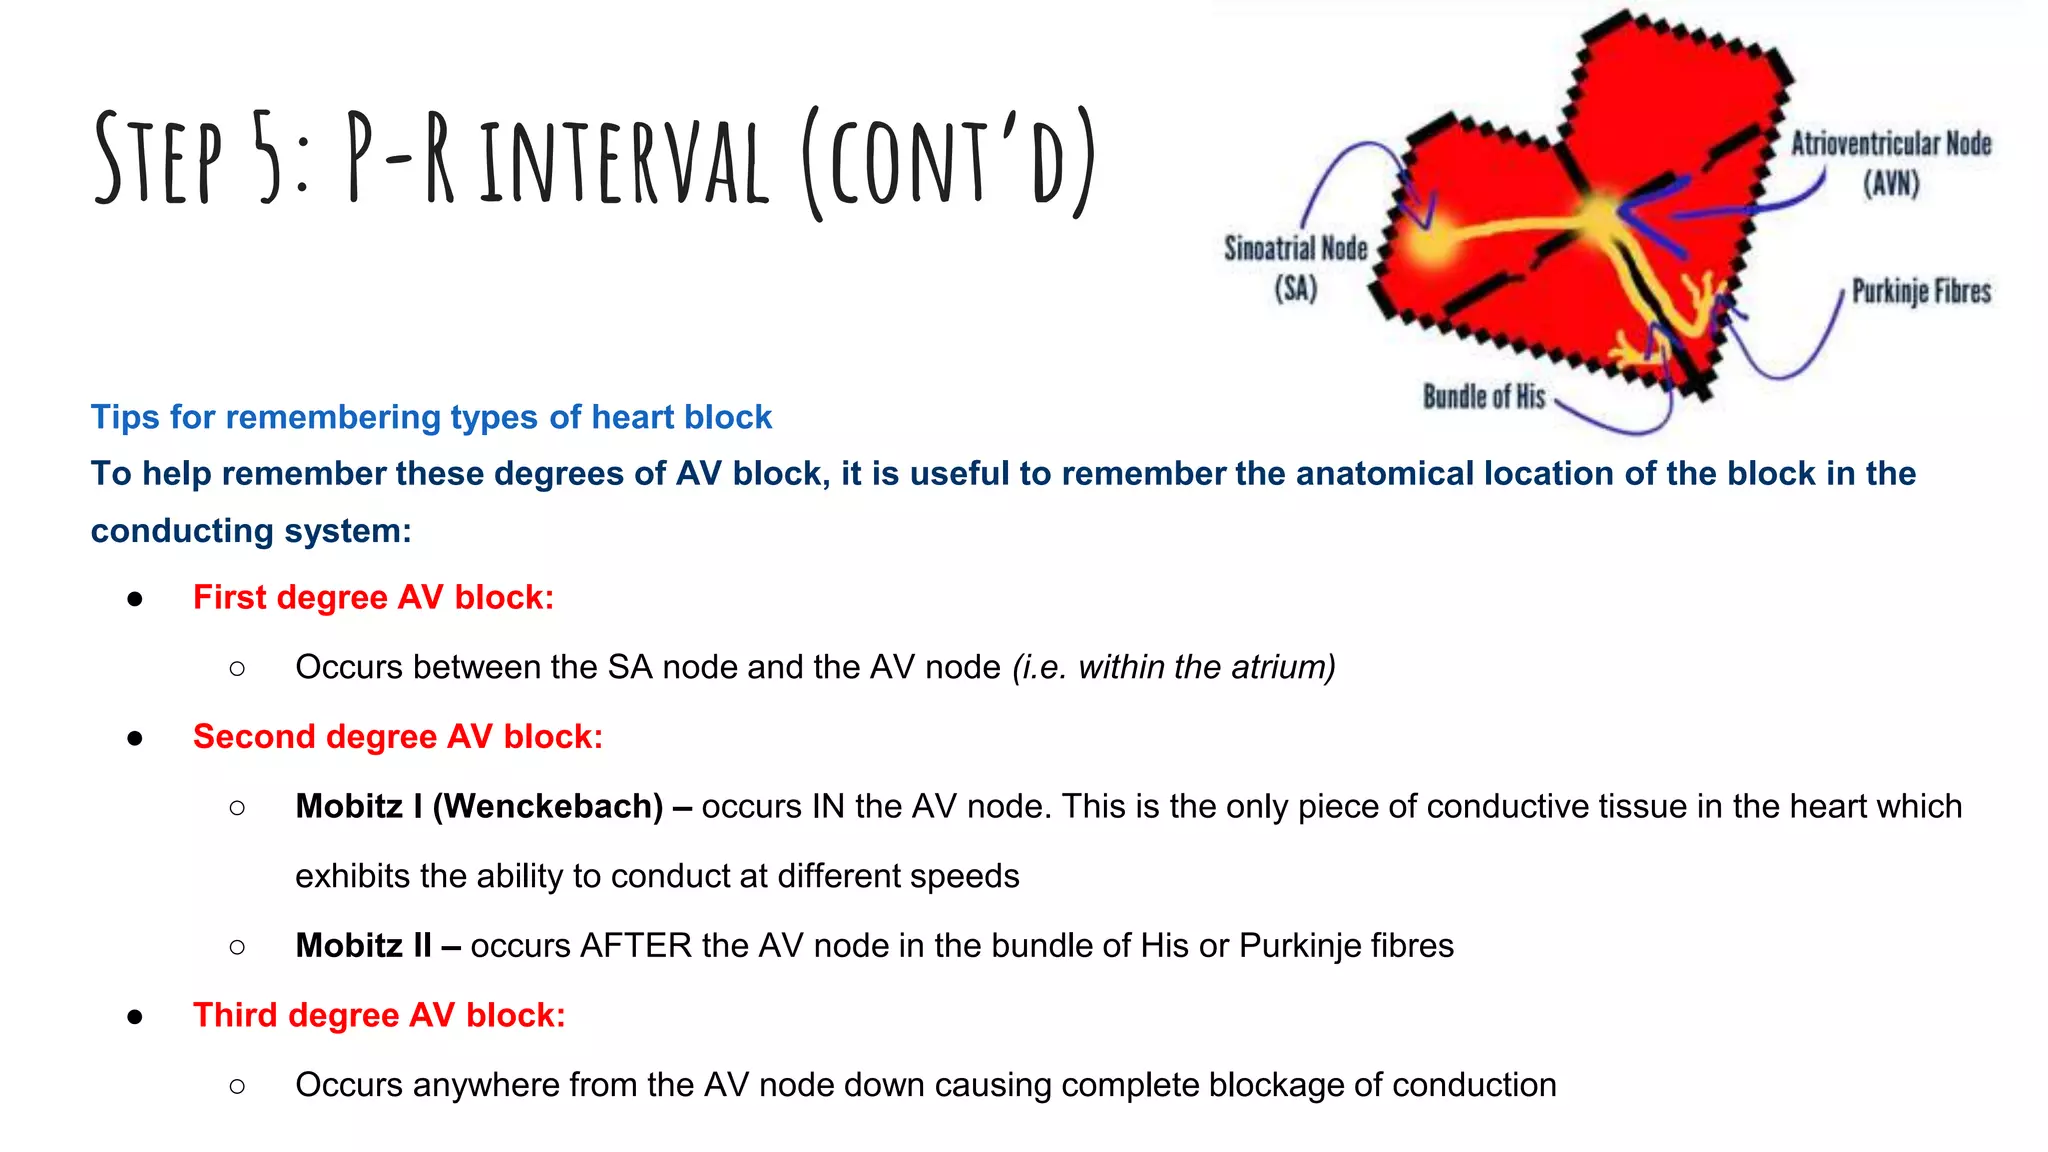
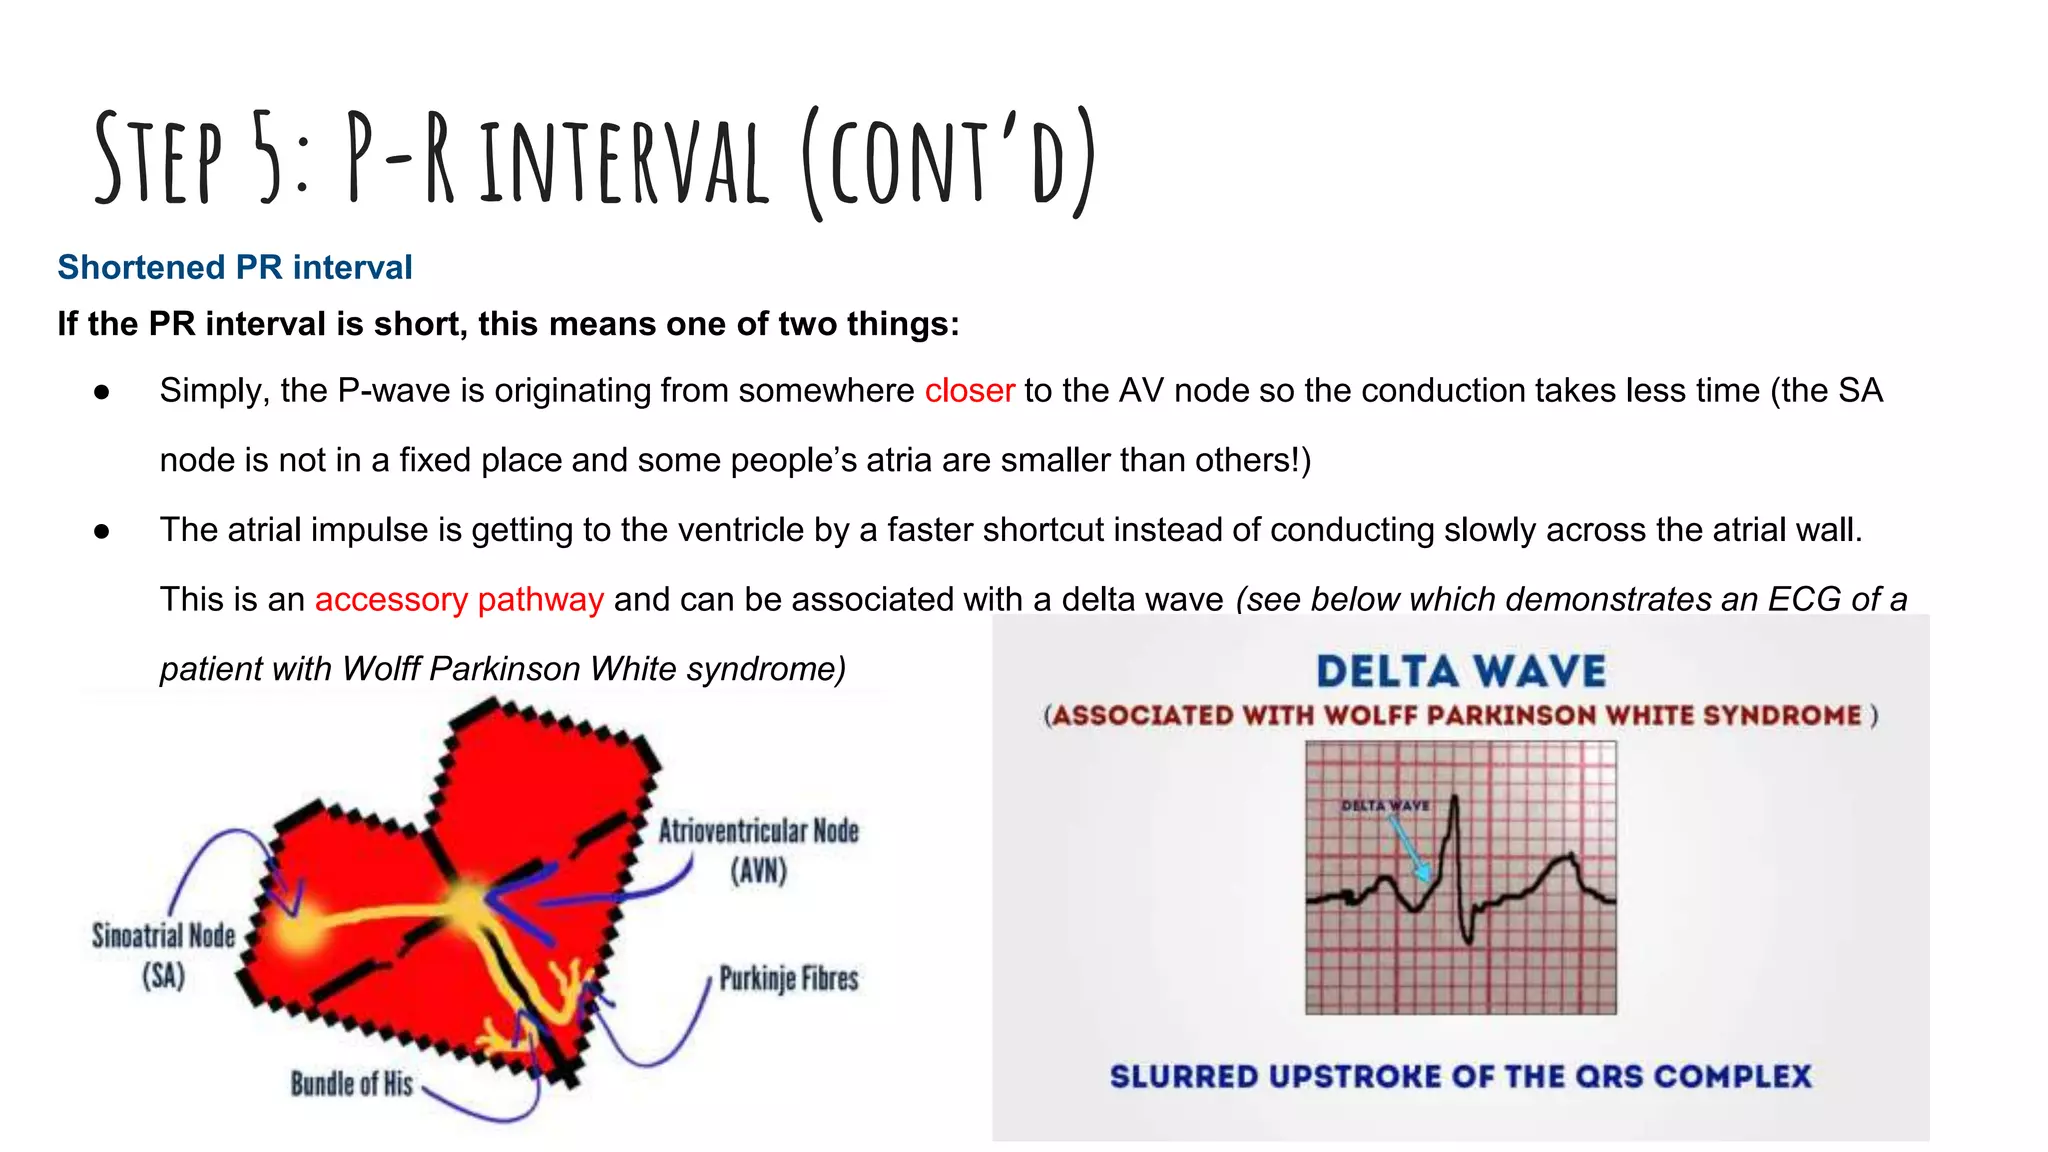
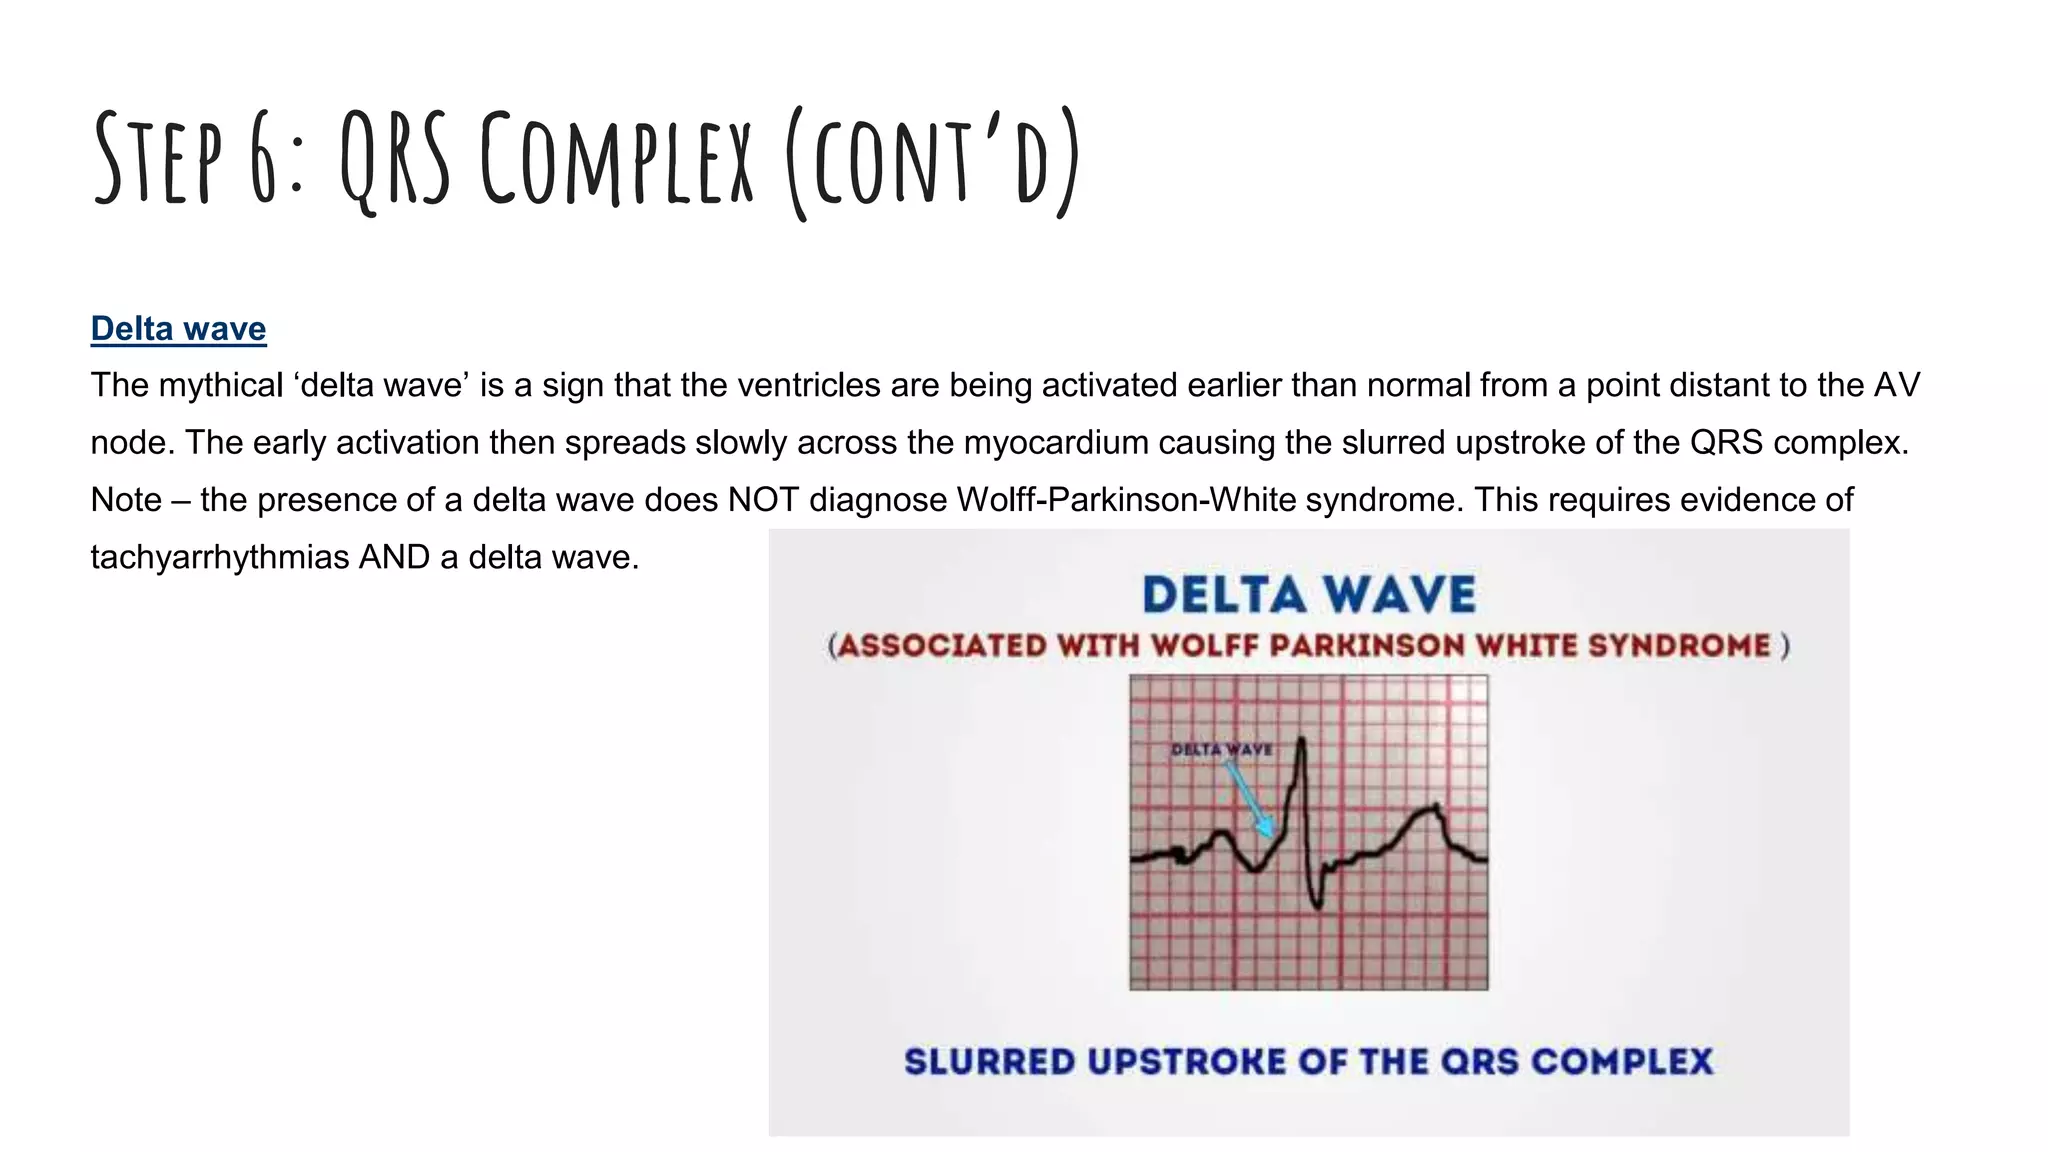
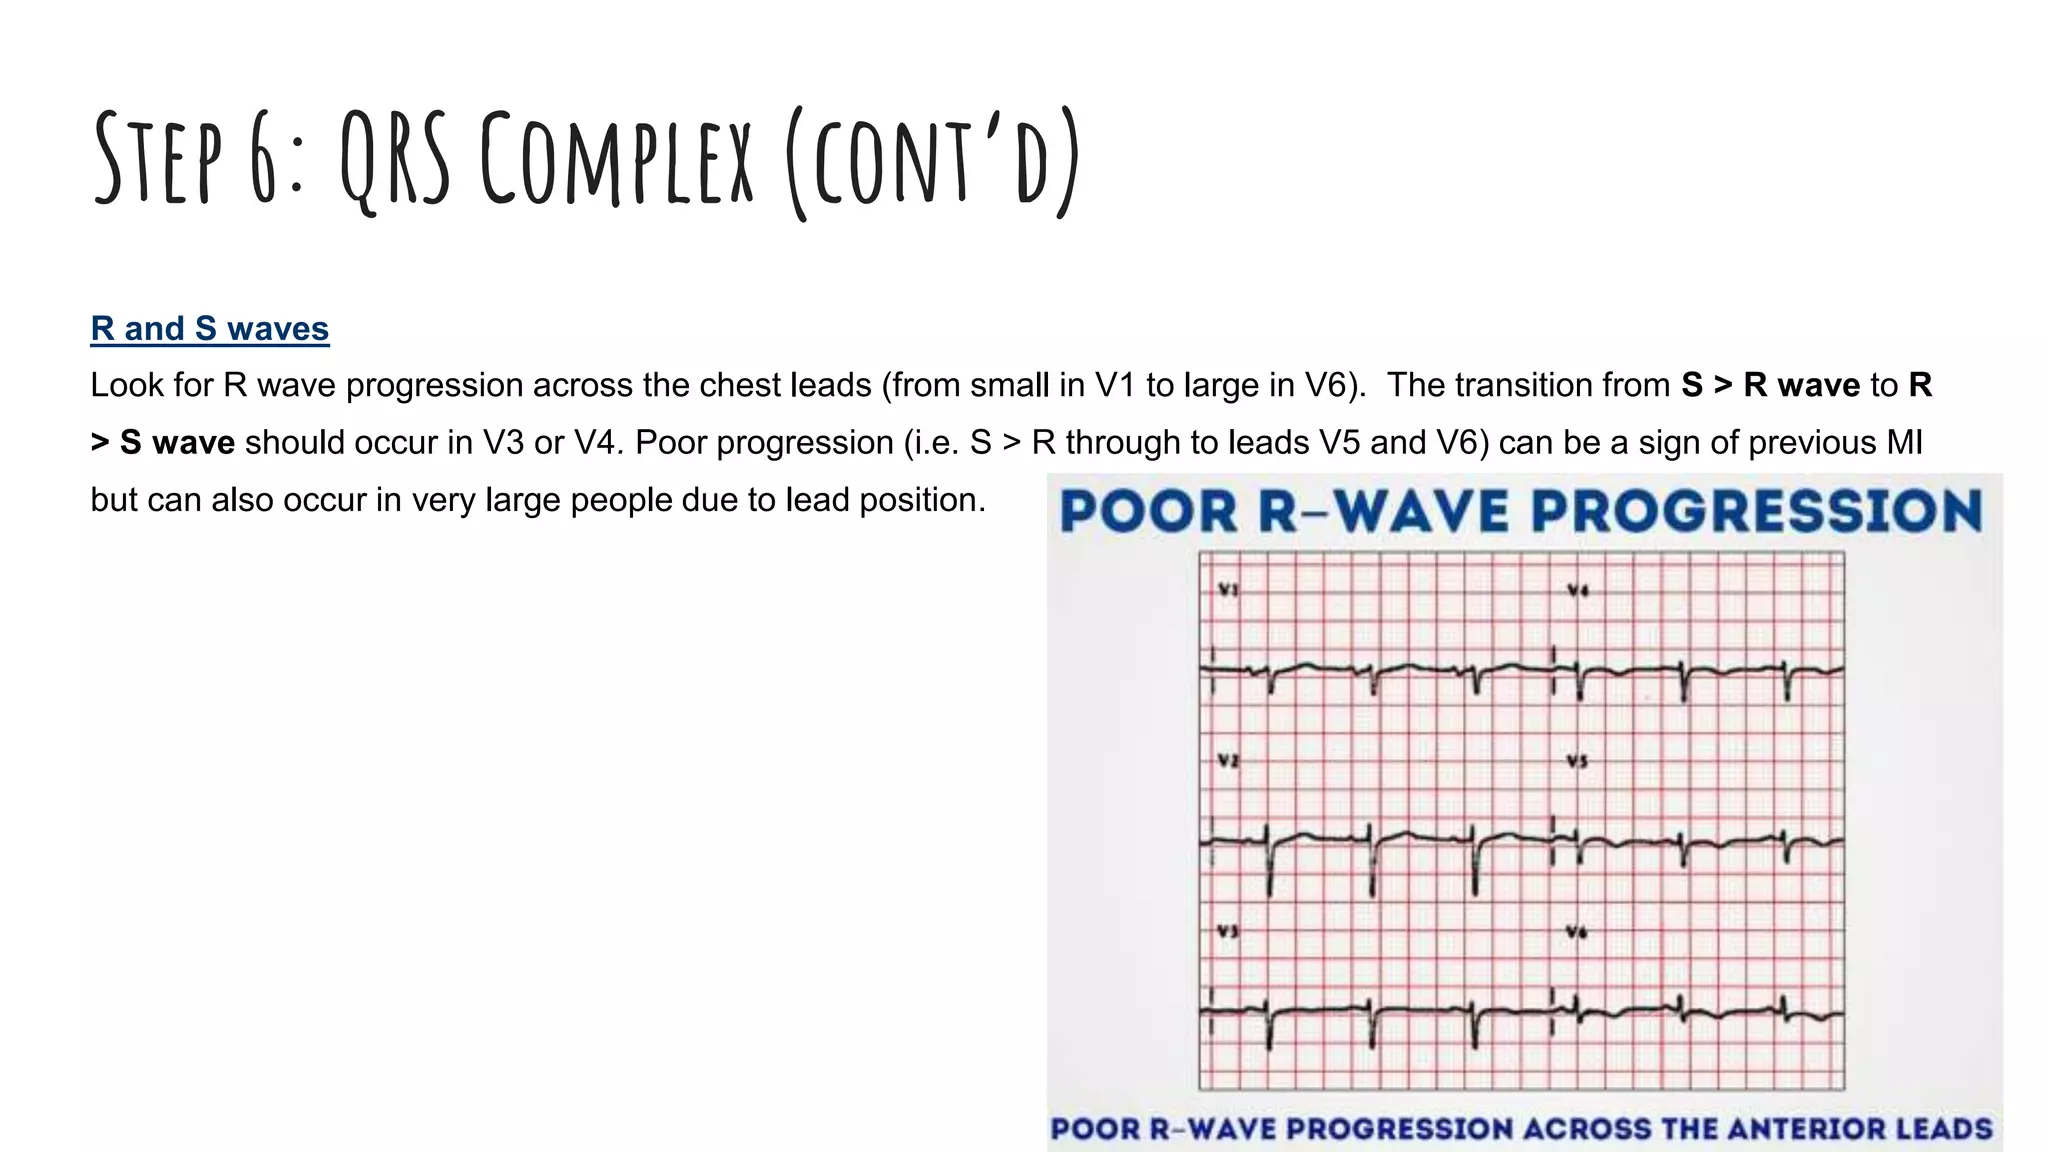
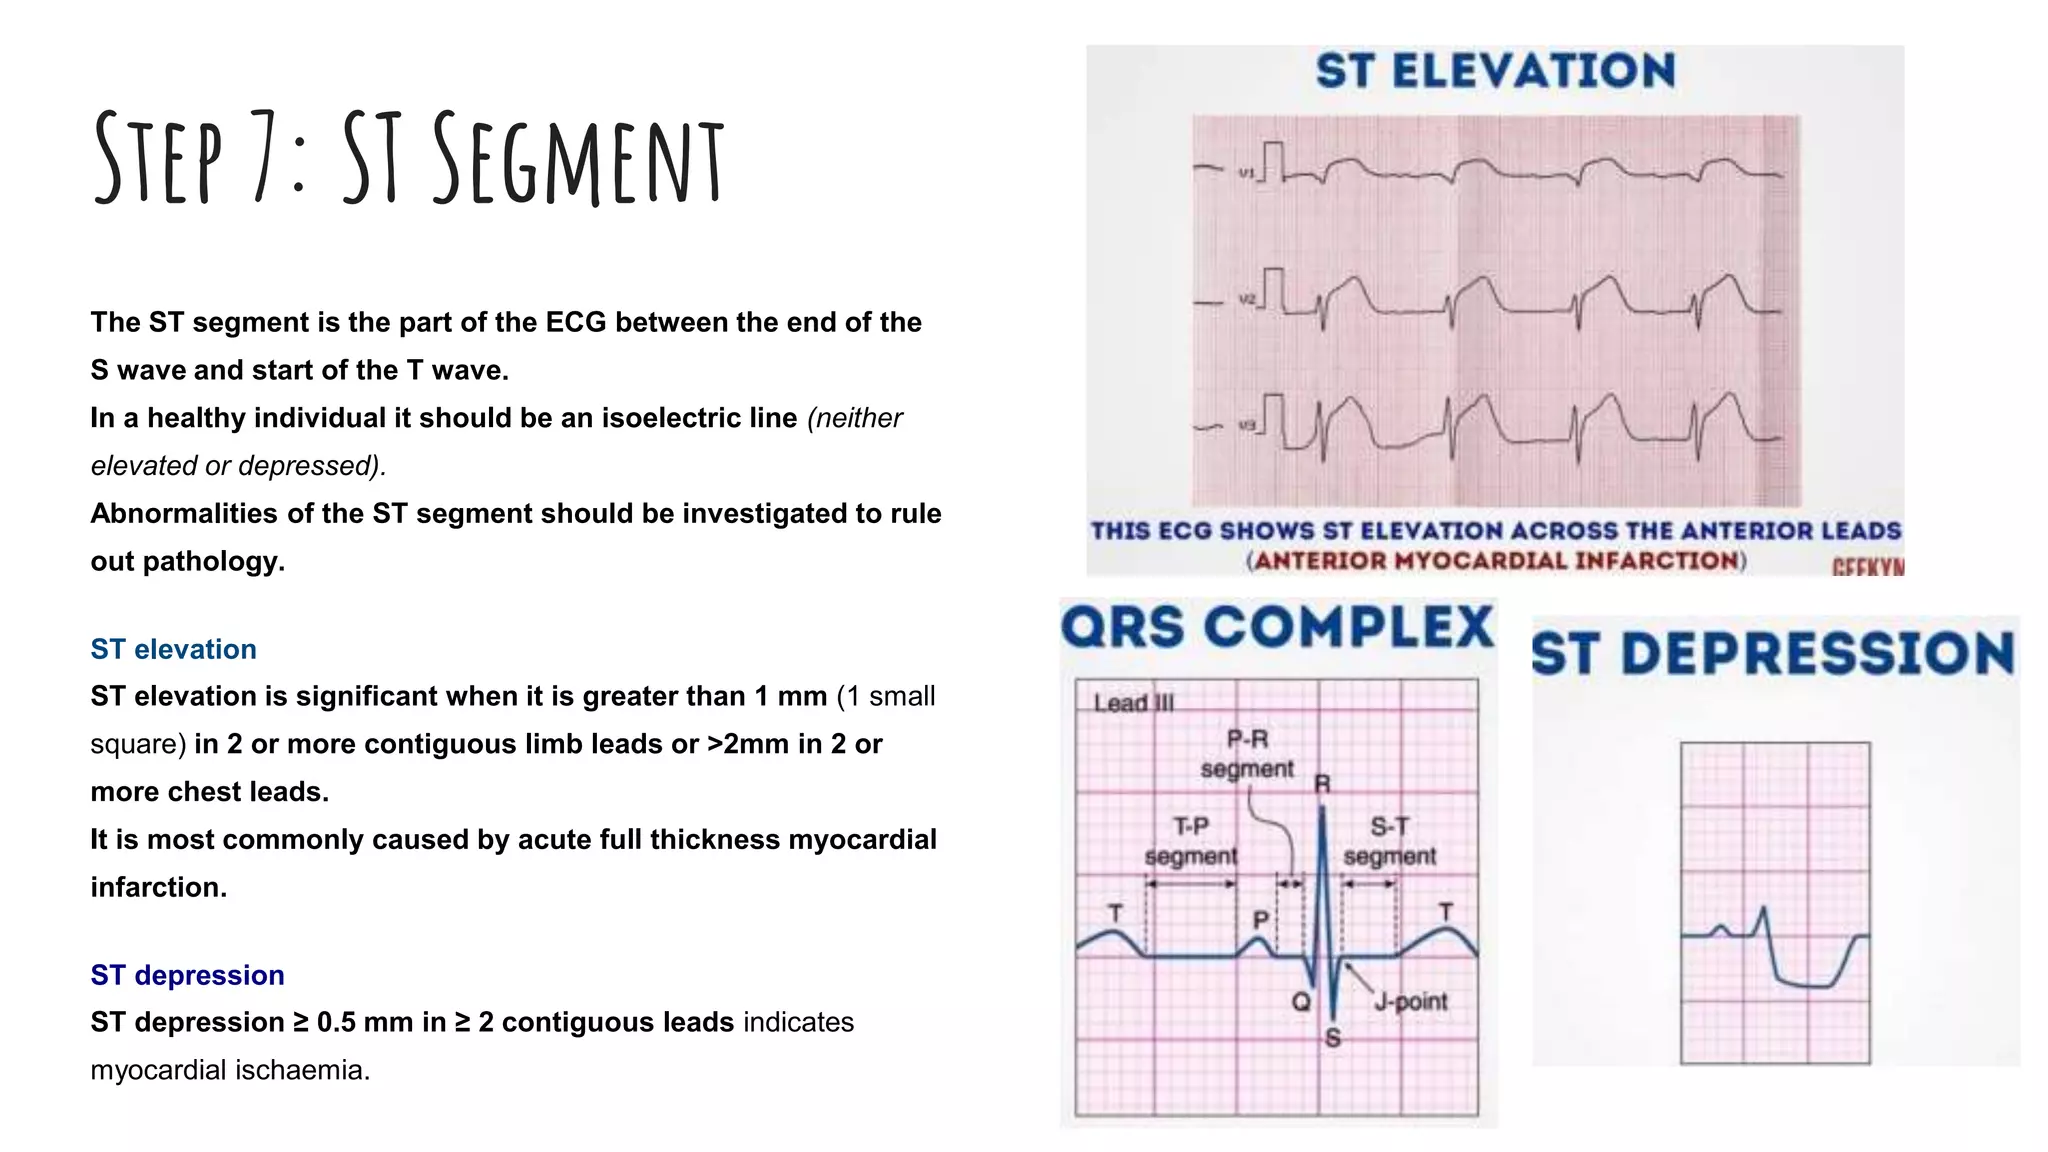
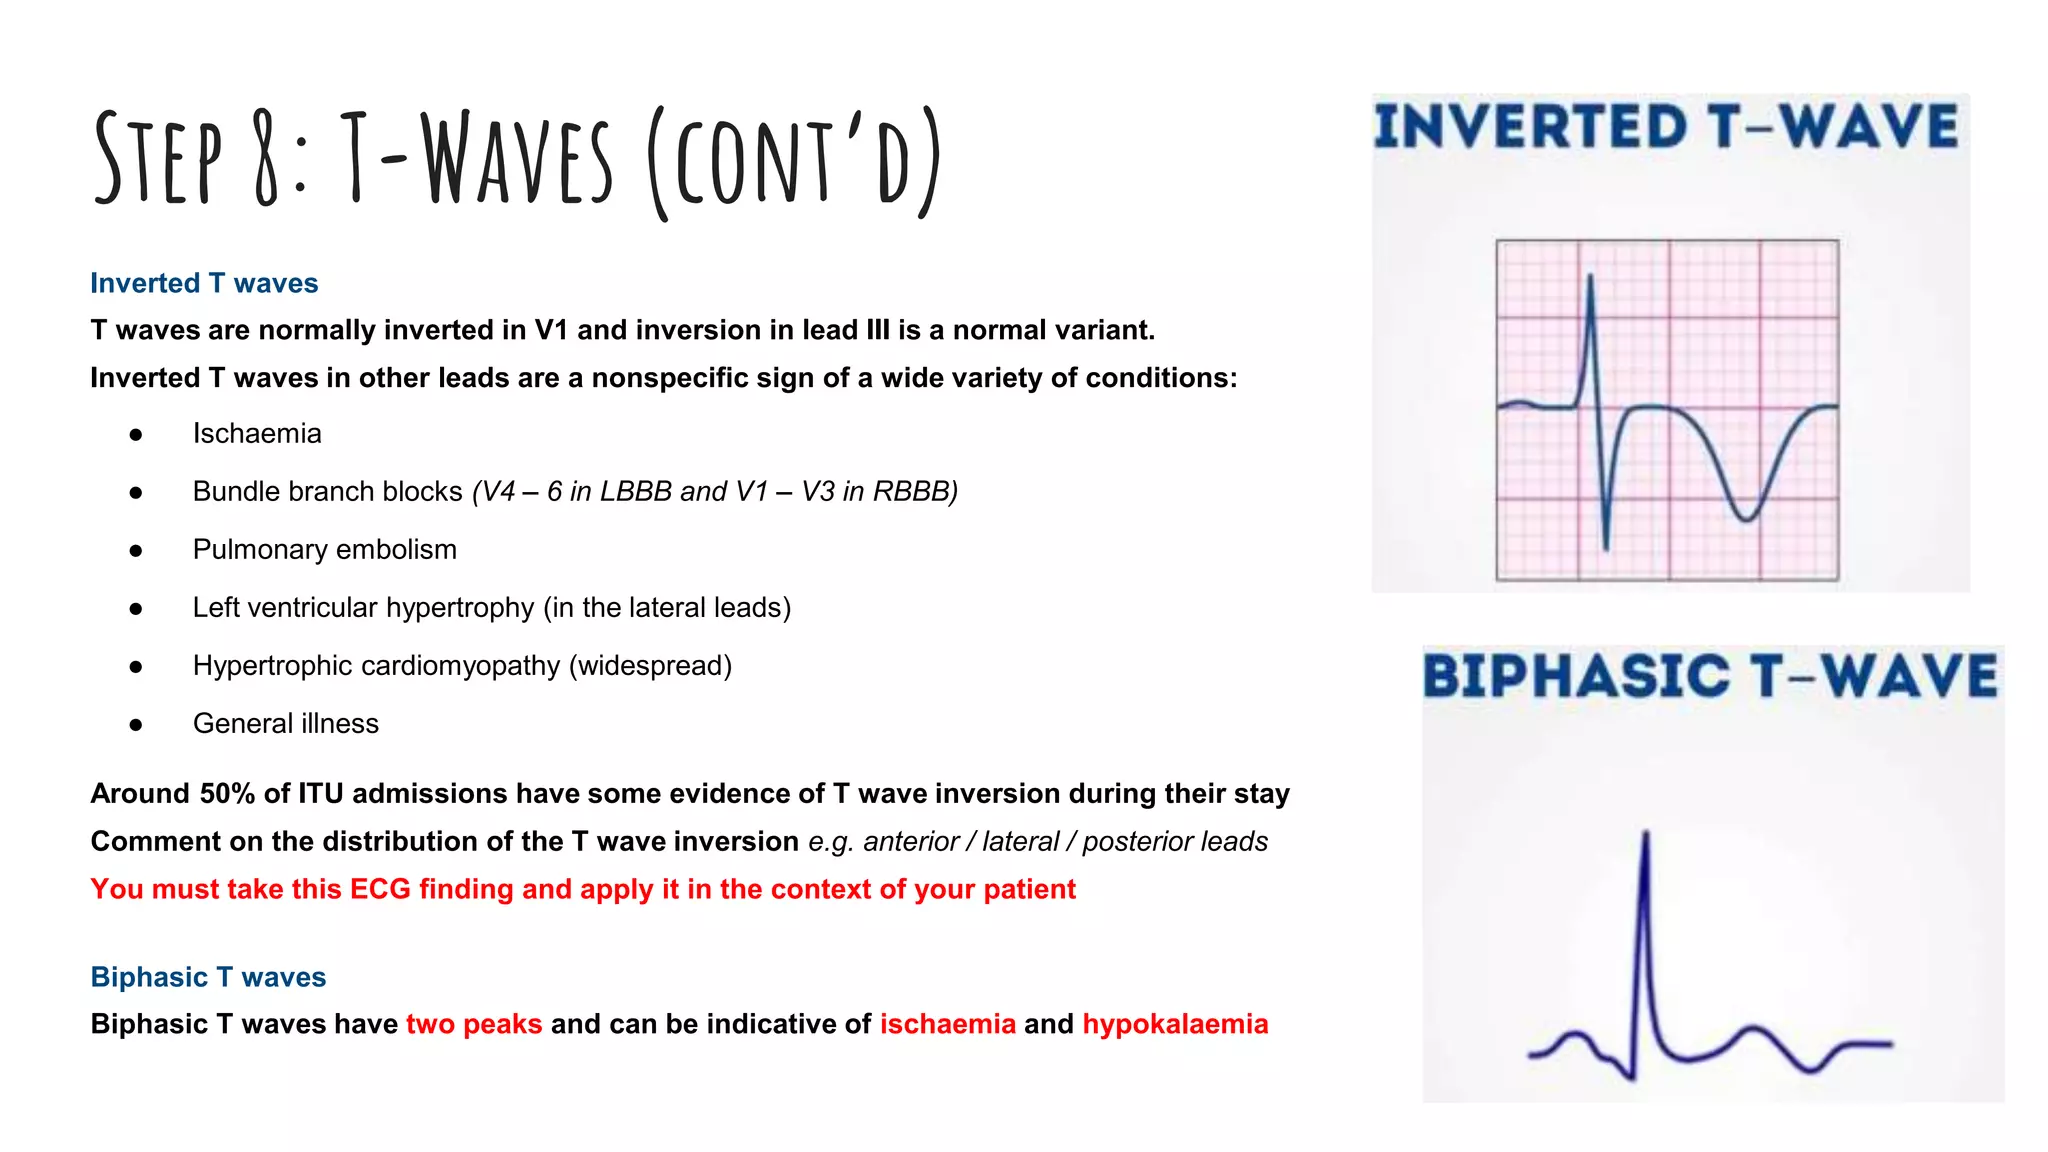
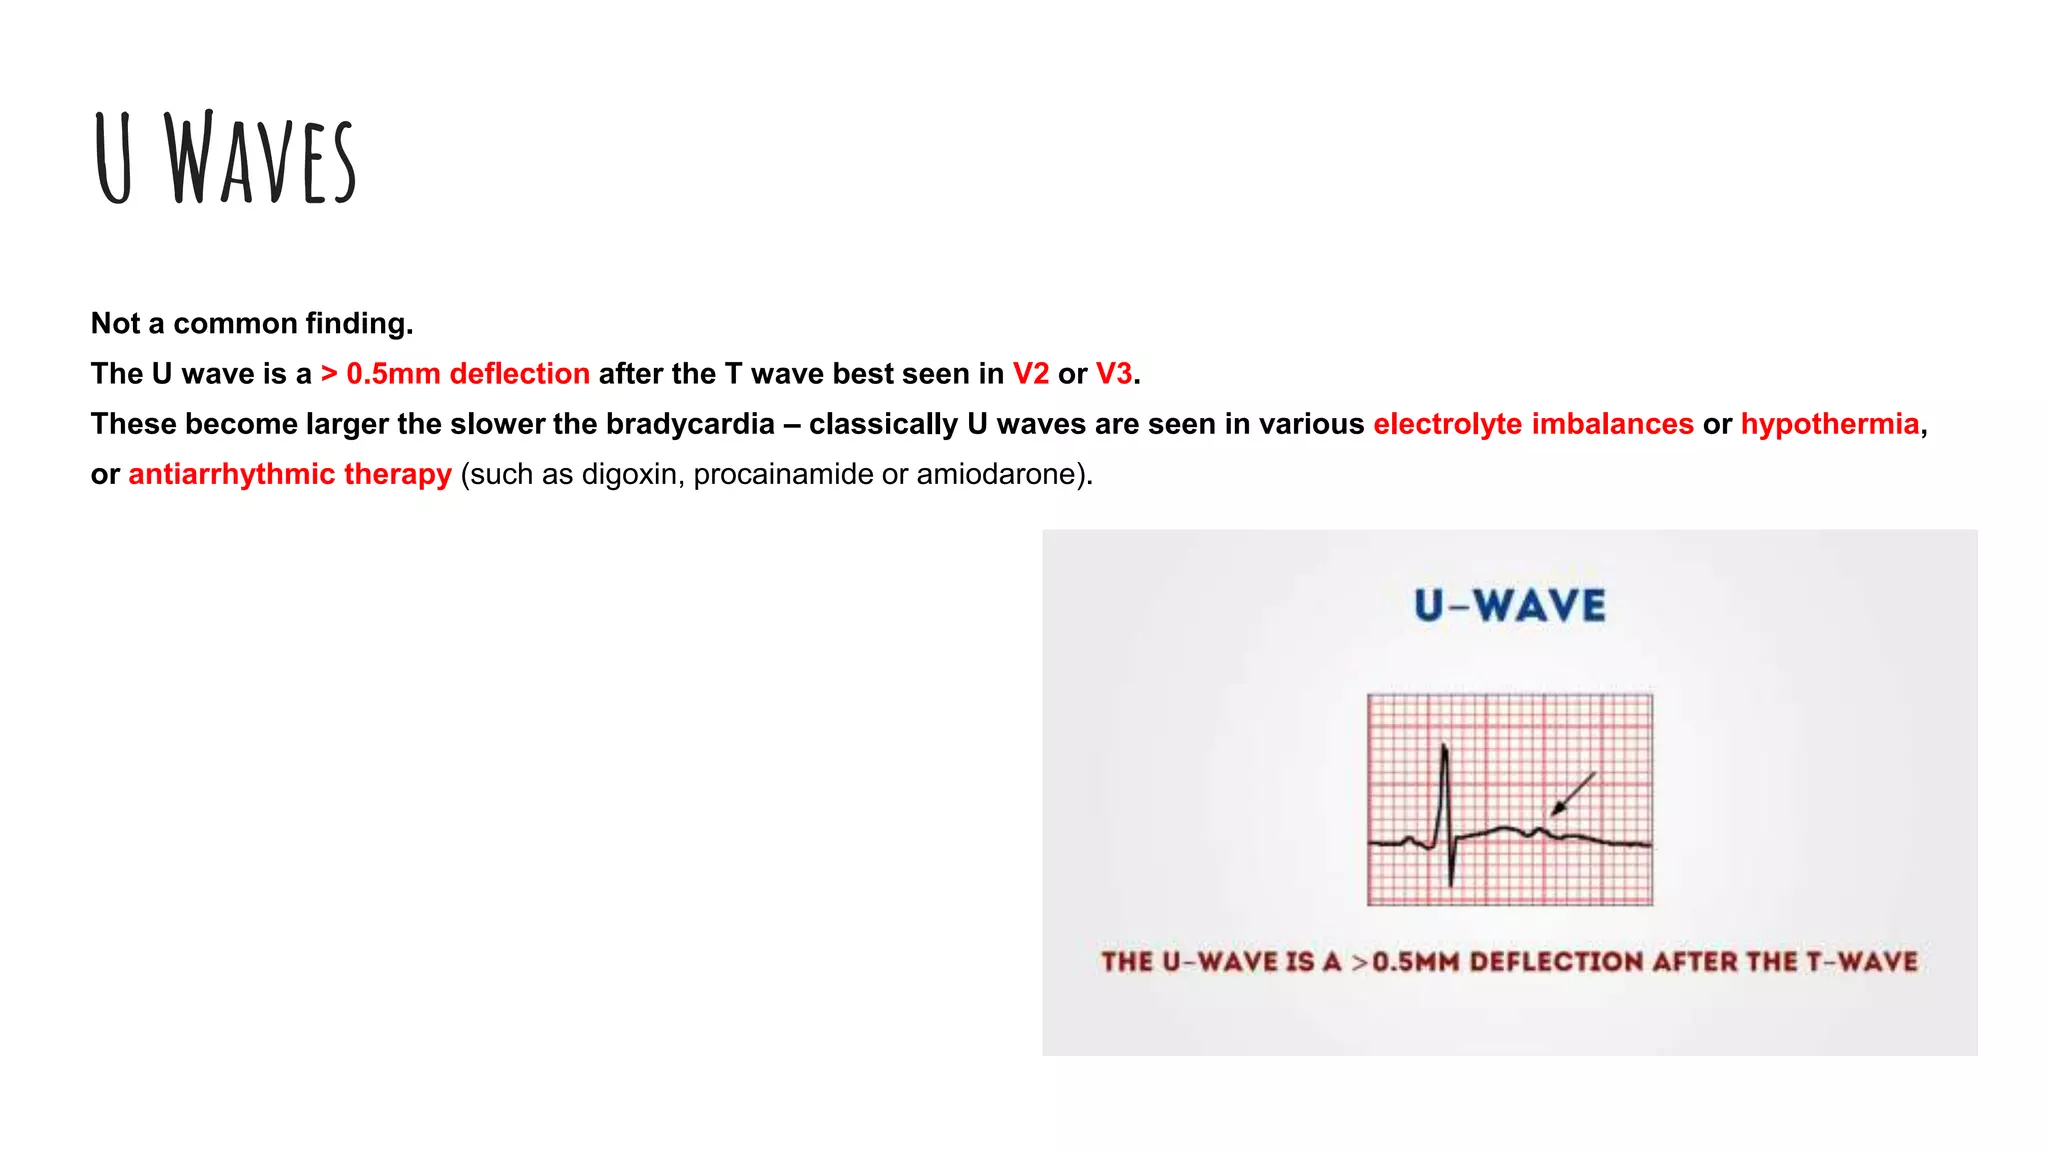
The document outlines a step-by-step process for reading an ECG, including calculating heart rate, assessing rhythm, cardiac axis, P waves, PR interval, QRS complex, ST segment, T waves, and U waves. Key items to evaluate at each step are identified, such as determining regular vs. irregular rhythm, signs of conduction abnormalities, and abnormalities that may indicate conditions like myocardial infarction. The overall goal is to systematically analyze all components of the E
This document provides information from a student-led tutorial on interpreting electrocardiograms (ECGs). It defines the ECG waveform and relates it to electrical activity in the heart. It discusses normal ranges for intervals like PR, QRS, and QT. Examples of rhythms like sinus arrhythmia, heart block, and atrial fibrillation are presented. Appendices provide guidance on calculating heart rate from ECG tracings and identifying rhythm based on regularity of QRS complexes. Causes and clinical features of different types of heart block are also summarized.
Normal sinus rhythm is characterized by a regular rhythm originating from the sinus node between 60-100 beats per minute. Each impulse follows the normal conduction pathway with visible P waves preceding upright QRS complexes and normal PR and QT intervals. Normal sinus rhythm serves as the standard against which all other cardiac rhythms are compared.
This document discusses cardio-renal syndrome (CRS), beginning with four case studies. It then covers the classification of CRS into five types based on whether cardiac or renal dysfunction occurs first and the duration. The pathophysiology of each type is complex, involving neurohormonal activation and other factors beyond just low blood flow. Novel biomarkers provide more accurate assessment of kidney injury than serum creatinine alone. Current management includes diuretics, ACE inhibitors, and other therapies, but future directions may include ultrafiltration, vaptans, adenosine antagonists, and hypertonic saline. CRS indicates communication between the heart and kidneys, leading to worse outcomes, so accurate diagnosis and coordinated treatment are important
This document provides an overview of approaches to arrhythmias from an electrophysiological perspective. It begins by classifying bradyarrhythmias and tachyarrhythmias based on location and rate. Common supraventricular arrhythmias like AV nodal reentrant tachycardia, atrial flutter, and atrial fibrillation are described. Ventricular arrhythmias including nonsustained and sustained VT are also covered. The document reviews ECG interpretation and provides examples of various arrhythmias, discussing distinguishing characteristics and treatment approaches. Case examples include sinus bradycardia with heart block, Wenckebach block, junctional escape rhythms, atrial flutter, AVNRT, preexcitation
2021 ESC Guidelines on Cardiac Pacing and CRTAyman Azoz
The document discusses the benefits of exercise for both physical and mental health. It notes that regular exercise can improve cardiovascular health, reduce stress and anxiety, boost mood, and enhance cognitive function. The article recommends that adults aim for at least 150 minutes of moderate aerobic activity per week along with strength training exercises 2-3 times per week.
This document discusses mechanical circulatory support devices for advanced heart failure, including intra-aortic balloon pumps (IABP) and ventricular assist devices (VADs). It describes the physiology and indications for IABP, including how it increases coronary perfusion and reduces left ventricular afterload. It also discusses VADs, describing both pulsatile and non-pulsatile devices, components, classifications based on period of use and pumping mechanism. Patient selection criteria for VADs include being refractory to medical therapy, having a life expectancy less than 2 years without support, and being ineligible for heart transplant.
This document presents information on various types of atrial arrhythmias. It discusses premature atrial complexes, atrial tachycardia, multifocal atrial tachycardia, atrial flutter, atrial fibrillation, and wandering atrial pacemaker. For each type, it covers etiology, characteristics, and treatment approaches. The document is presented by Baby Haokip from the College of Nursing, NEIGRIHMS.
Acute coronary syndrome (ACS) refers to conditions caused by reduced blood flow in the coronary arteries. This can be due to plaque buildup narrowing the arteries or plaque rupture leading to clot formation. ACS includes ST-elevation myocardial infarction (STEMI), non-ST-elevation myocardial infarction (NSTEMI), and unstable angina (UA). Patients present with chest pain and may have ECG changes or elevated cardiac biomarkers. Treatment involves oxygen, nitroglycerin, aspirin, and morphine (MONA) along with long-term therapies like antiplatelets, beta-blockers, statins, and ACE inhibitors to prevent future events.
The document discusses the results of a study on the effects of a new drug on memory and cognitive function in older adults. The double-blind study involved giving either the new drug or a placebo to 100 volunteers aged 65-80 over a 6 month period. Testing showed those receiving the drug experienced statistically significant improvements in short-term memory retention and processing speed compared to the placebo group.
This document discusses STEMI (ST-elevation myocardial infarction). It defines STEMI and provides the universal definition involving cardiac biomarkers and ECG changes. It describes the five types of MI and lists the signs, symptoms, risk factors, diagnostic criteria involving ECG and cardiac enzymes. Treatment options including fibrinolytic therapy, PCI and medical therapies are summarized. Complications of STEMI both early and late are outlined.
Non infarction Q waves
Precise guide for Allied Health Science Students especially cardiac specialty students, DGNM, B.Sc Nursing & M.Sc Nursing Students regarding Non Infarction Q waves
The document discusses localization of myocardial ischemia, injury, and infarction based on electrocardiogram (ECG) findings. It provides information on interpreting ST segment changes and T-wave abnormalities in different leads to localize occlusion in the left anterior descending, right coronary artery, or left circumflex arteries. Reciprocal changes are also discussed as indicators of occlusion location.
This document discusses using echocardiography to assess cardiac function and hemodynamics in a non-invasive manner. It covers:
1. Assessment of left ventricular systolic function using ejection fraction measured by M-mode, Simpson's method, and mitral regurgitation dP/dT.
2. Assessment of left ventricular diastolic function and filling pressures using mitral inflow patterns, mitral annular velocities, and pulmonary venous inflow patterns.
3. Estimation of right heart pressures and pulmonary artery systolic pressure using measurements of the inferior vena cava and its collapsibility.
Angiotensin receptor-neprilysin inhibition(ARNI):The New Fronteir ?drucsamal
1) LCZ696, which inhibits neprilysin and blocks angiotensin receptors, reduced the risks of cardiovascular death and heart failure hospitalization compared to enalapril in patients with heart failure with reduced ejection fraction.
2) LCZ696 also reduced the risks of all-cause mortality and worsened heart failure compared to enalapril.
3) Patients receiving LCZ696 experienced greater improvements in quality of life and functional status measures compared to those receiving enalapril.
ECG Rhythm Interpretation
ST Elevation and non-ST Elevation MIs
ECG Changes
ECG Changes & the Evolving MI
Left Ventricular Hypertrophy
Normal Impulse Conduction
Bundle Branch Blocks
Heart block occurs when the electrical signals between the upper (atrial) and lower (ventricular) chambers of the heart are slowed or blocked, causing the heart to beat too slowly. There are three degrees of heart block - first degree causes a prolonged PR interval on ECG; second degree can be Mobitz type I (Wenckebach) where the PR interval prolongs until a dropped beat, or Mobitz type II where beats are occasionally dropped; and third degree is complete heart block where there is no connection between atria and ventricles. Nursing management of heart block includes monitoring for symptoms of low cardiac output, preventing complications of immobility, managing anxiety, and preventing infections at pacemaker insertion sites.
This document discusses beta blockers and focuses on bisoprolol. It summarizes that:
1) Beta blockers are a class of drugs used to treat heart conditions like heart failure and hypertension, but they have diverse properties. Bisoprolol is a selective beta-1 blocker.
2) Studies show bisoprolol provides similar or better blood pressure control compared to other beta blockers like atenolol and metoprolol. It also provides superior heart rate reduction.
3) The CIBIS II trial found bisoprolol reduced all-cause mortality by 34% in heart failure patients when added to standard therapy of diuretics and ACE inhibitors.
Sa and av nodal bradyarrhythmias and the indicationSatyan Nanda
SA nodal and AV nodal bradyarrhythmias can cause symptomatic sinus bradycardia requiring pacemaker implantation. The SA node regulates heart rate and its dysfunction can be caused by drugs, autonomic dysfunction, or intrinsic sick sinus syndrome. AV nodal dysfunction may involve first-degree, Mobitz type I or II, or complete heart block. Pacemakers are indicated for symptomatic bradycardia based on electrocardiography and electrophysiological study findings. Pacemaker implantation carries risks of infection, lead issues, or abnormal pacing responses.
This document presents a case of an 85-year-old female patient presenting with symptoms of edema, fatigue, dyspnea, angina, and near fainting. On examination, she had an elevated blood pressure, weak pulse, carotid thrill, and systolic murmur. The document then provides an explanation of how aortic stenosis could cause these observations. It defines aortic stenosis as the inability of the aortic valve to open during systole. The document recommends further investigations like echocardiogram and electrocardiogram to diagnose aortic stenosis and determine severity.
The document discusses different types of aneurysms including abdominal aortic, thoracic aortic, cerebral, and peripheral aneurysms. It describes the causes, risk factors, symptoms, diagnostic tests, and management options for aneurysms. For abdominal aortic aneurysms, the main treatment options are open abdominal repair surgery or endovascular repair to reinforce the weakened artery. For brain aneurysms, surgical clipping or endovascular coiling may be used to block blood flow to the aneurysm.
This document discusses several types of supraventricular tachycardia (SVT), including their definitions, pathophysiology, diagnosis, and treatment. It covers sinus tachycardia, sinus node reentry, atrial flutter, and atrial tachycardia. For each type, it describes the characteristic heart rate, P wave morphology, and mechanisms involving automaticity, reentry, or triggered activity. Treatment options discussed include medications, cardioversion, ablation, and stroke prophylaxis.
The document discusses P wave abnormalities seen on electrocardiograms (ECGs). It describes the normal features of P waves and various abnormalities including right and left atrial enlargement.
Case 1 ECG shows bifid P waves consistent with left atrial enlargement likely due to mitral stenosis.
Case 2 ECG shows tall peaked P waves consistent with right atrial enlargement (P pulmonale) likely due to pulmonary hypertension.
Case 3 ECG shows inverted P waves with a short PR interval consistent with a junctional rhythm possibly due to incomplete treatment of streptococcal pharyngitis.
1) Ambulatory blood pressure monitoring (ABPM) provides accurate blood pressure measurements over 24 hours and can detect differences between daytime and nighttime blood pressure that are important for diagnosing and treating hypertension.
2) ABPM was initially developed in the 1960s and has advantages over clinic blood pressure measurements in predicting health outcomes.
3) ABPM involves using an automated cuff to measure blood pressure at regular intervals over 24 hours while patients go about their daily activities. This provides definitions for diagnosing white coat, masked, and other types of hypertension.
The document discusses the anatomy and physiology of the heart's conducting system. It describes the locations and functions of the sinoatrial node, atrioventricular node, bundle of His, bundle branches, and Purkinje fibers. It then explains different types of heart block including first-, second-, and third-degree heart block and their characteristics as seen on ECG. Treatment options are provided for the various heart block classifications.
This document provides an overview of cardiac arrhythmias, including definitions and descriptions of normal sinus rhythm and various arrhythmias. It discusses the cardiac conduction system and mechanisms that can cause arrhythmias, such as abnormal impulse formation or conduction. Specific arrhythmias summarized include sinus bradycardia, sinus tachycardia, premature atrial contractions, supraventricular tachycardia, atrial fibrillation, atrial flutter, and atrial tachycardia. For each arrhythmia, the document provides information on heart rate, rhythm, P wave presence/morphology, and other ECG characteristics.
The document discusses electrocardiograms (ECGs) and cardiac arrhythmias. It begins by explaining how the heart generates electrical currents that can be recorded as ECG tracings. It then covers ECG basics like normal sinus rhythm, heart rate calculation, and the cardiac conduction system. The document discusses various types of arrhythmias including premature beats, tachycardias, fibrillation, and heart blocks. It provides examples of ECG tracings of normal and abnormal rhythms. In summary, the document provides an overview of ECGs, how to analyze rhythms, and examples of common arrhythmias.
The TREAT trial compared ticagrelor to clopidogrel in patients who received fibrinolytic therapy for ST-elevation myocardial infarction (STEMI). The trial aimed to evaluate the safety of ticagrelor in this setting given concerns about bleeding risk. The primary safety outcome was major bleeding at 30 days, with major efficacy outcomes including death from cardiovascular causes, myocardial infarction or stroke. The trial found ticagrelor to be non-inferior to clopidogrel for major bleeding at 30 days. Rates of other bleeding outcomes and major cardiovascular events were also similar between the two treatments.
This document discusses various non-coronary causes of ST-elevation on electrocardiograms (ECGs) including ventricular aneurysms, pericarditis, early repolarization patterns, left ventricular hypertrophy, left bundle branch block, hypothermia, cardioversion, intraventricular hemorrhage, hyperkalemia, Brugada pattern, type 1C antiarrhythmic drugs, hypercalcemia, pulmonary embolism, hypothermia, myocarditis, and tumor invasion of the left ventricle. It then discusses left ventricular aneurysms, early repolarization, acute pericarditis, hyperkalemia, hypothermia, increased intracranial pressure, Brugada syndrome, Tak
This document provides an overview of how to interpret an electrocardiogram (ECG). It describes the basic components of an ECG including patient data, paper speed, calibration, lead placement, and waveform intervals. It then examines each waveform in more detail, covering the P wave, QRS complex, T wave, ST segment, and cardiac rhythm and axis. Key signs and abnormalities are outlined for each component to guide ECG interpretation.
This document provides an outline for electrocardiogram (ECG or EKG) interpretation. It begins with an introduction to ECGs and their purpose. It then discusses ECG physiology, the different types of ECG tests, indications for ECGs, how to record an ECG, and an 8-step approach to ECG interpretation. Finally, it covers common ECG abnormalities and their significance. The overall document serves as a comprehensive guide for understanding ECGs, from the basics of what they measure to interpreting tracings and recognizing abnormal findings.
The document provides an overview of performing and interpreting electrocardiograms (ECGs). It discusses what an ECG is, the procedure for performing one, how ECGs work by measuring electrical impulses in the heart, and lead placement. It also covers interpreting ECG tracings by examining elements like the P wave, QRS complex, T wave, and QT interval, as well as assessing the heart rate, rhythm, and axis. The document uses examples to illustrate abnormal P waves, QRS widths, ST segments, T waves, and other elements that may indicate underlying cardiac conditions.
The document outlines a systematic 7+2 step approach for interpreting electrocardiograms (ECGs) that involves analyzing the rhythm, rate, conduction, axes, wave morphologies, segment changes, and comparing to previous ECGs to form a clinical conclusion. The 7 steps examine the rhythm, rate, conduction intervals, axes, P wave, QRS, and ST-T wave morphologies. The +2 steps involve comparing the ECG to previous tracings and formulating a concluding statement.
This document discusses the analysis of a 12-lead EKG. It begins by describing the components that should be assessed, including rhythm, rate, axis, and grouped lead analysis. Specific abnormalities are then discussed in detail such as ST segment changes, bundle branch blocks, Q waves, and more. The overall goal is to systematically analyze all aspects of the 12-lead EKG to evaluate for any cardiac abnormalities.
This document provides an overview of electrocardiography (ECG) and ECG interpretation. It discusses the conduction system of the heart and how ECG works to record and display the heart's electrical activity. A systematic 8-step approach to ECG interpretation is outlined, examining rate, rhythm, intervals, waves, segments, and arriving at an overall interpretation. Common ECG patterns for myocardial ischemia, injury, and infarction are reviewed.
ecg basics made easy, with description of most common ecg types especially in emergency situation.
easy to memorize points and mnemonics included.
approach to ecg diagnosis.
sample ecgs.
ECG Interpretation
The ECG is used to diagnose heart conditions by representing the electrical activity of the heart over time. It can detect abnormalities in heart rhythm, rate, and structure. A standard ECG has 12 leads that examine the heart from different angles. Common things to analyze include rhythm, rate, axis, waves, intervals, and complexes. Various arrhythmias and conduction abnormalities can be identified based on their characteristic ECG patterns.
This document provides an overview of electrocardiography (ECG) including:
- What an ECG measures and the cardiac cycle waveform
- How ECGs can identify various cardiac conditions like arrhythmias, ischemia, and chamber abnormalities
- The basics of cardiac impulse conduction and the components of a normal ECG waveform including the P wave, QRS complex, T wave, and segments
- How to determine heart rate using the 300/1500 rule or 10 second rule
- Factors that can affect the QRS axis and how it is determined using the quadrant or equiphasic approaches
- Types of bradyarrhythmias like sinus bradycardia, junctional rhythm
This document provides an overview of ECG interpretation. It discusses the 12 ECG leads and how they view the heart from different angles. It outlines the normal waveform components of an ECG (P, Q, R, S, T, U waves) and how to analyze rhythm, rate, P wave, PR interval, QRS complex, T wave, QT interval, and ST segment. The document also reviews axis deviation, heart block, abnormal rhythms, and conditions that can cause ECG abnormalities like myocardial infarction and electrolyte imbalances.
The document discusses various aspects of ECGs that can help determine myocardial ischemia:
1. Key things to examine include heart rate, rhythm, P waves, PR interval, QRS complex, ST segments, T waves, and QT interval. Abnormalities in any of these can indicate issues like arrhythmias or myocardial infarction.
2. When analyzing each component, important questions to ask include whether intervals are too short/long, amplitudes too high/low, or shapes/patterns abnormal.
3. Common abnormalities that may suggest ischemia are ST segment depression, tall/inverted T waves, prolonged QT interval, pathological Q waves, and bundle branch blocks. Interpreting the full rhythm strip is crucial for diagnosis
The document provides information about electrocardiograms (ECGs), including what an ECG is, the types of pathology that can be identified from ECGs, ECG paper specifications, heart anatomy and the normal ECG signal, ECG leads, determining heart rate from ECGs, common rhythms, P waves, the PR interval, the QRS complex, identifying left and right bundle branch block, identifying left and right ventricular hypertrophy, Q waves, the ST segment and T waves. Key details are provided about normal ECG measurements and the signs of various cardiac conditions.
The document provides information about electrocardiograms (ECGs), including what an ECG is, the types of pathology that can be identified from ECGs, ECG paper specifications, the anatomy of the heart and normal ECG signal, ECG leads, determining heart rate and rhythm from ECGs, P waves, the PR interval, the QRS complex, axes determination, bundle branch blocks, ventricular hypertrophy, Q waves, the ST segment, T waves, and the QT interval. Key aspects of the ECG that can help identify conditions like myocardial infarction, pericarditis, and electrolyte abnormalities are discussed.
The ECG represents the electrical activity of the heart. It can provide insight into cardiac pathophysiology by analyzing the distinctive waveforms of each cardiac event. The ECG can identify arrhythmias, ischemia, infarction, pericarditis, chamber hypertrophy, and electrolyte disturbances. The standard 12-lead ECG consists of 3 limb leads, 3 augmented limb leads, and 6 precordial leads, which provide different views of the heart. Analysis of the P wave, PR interval, QRS complex, ST segment, T wave, and QT interval can reveal normal sinus rhythm or abnormalities that require further investigation.
An ECG (electrocardiogram) is a test that records the electrical activity of ...dptfa19041
An electrocardiogram (ECG or EKG) is a medical test that records the electrical activity of the heart over a period of time using electrodes placed on the skin. The results are typically displayed as a graph of voltage versus time. Here is a basic description of the ECG components and what they represent:
ECG Components
P Wave:
Description: The P wave represents the depolarization (contraction) of the atria, the two upper chambers of the heart.
Normal Characteristics: Should be upright in most leads, smooth, and rounded.
PR Interval:
Description: The PR interval is the time from the onset of the P wave to the start of the QRS complex. It reflects the time the electrical impulse takes to travel from the atria to the ventricles.
Normal Range: 120–200 milliseconds.
QRS Complex:
Description: The QRS complex represents the depolarization of the ventricles, the two lower chambers of the heart.
Normal Characteristics: Normally narrow (less than 120 milliseconds) and tall, indicating rapid ventricular depolarization.
ST Segment:
Description: The ST segment starts at the end of the QRS complex and ends at the beginning of the T wave. It represents the time between the end of ventricular depolarization and the start of repolarization (recovery).
Normal Characteristics: Typically flat and at baseline.
T Wave:
Description: The T wave represents ventricular repolarization (recovery).
Normal Characteristics: Should be upright in most leads, smooth, and rounded.
QT Interval:
Description: The QT interval is the time from the start of the QRS complex to the end of the T wave. It represents the total time for ventricular depolarization and repolarization.
Normal Range: Varies with heart rate but generally should be less than half the R-R interval (the time between two successive R waves).
U Wave (sometimes present):
Description: The U wave follows the T wave and represents the final phase of ventricular repolarization.
Normal Characteristics: Often small and not always seen.
Interpreting an ECG
Interpreting an ECG involves assessing the heart rate, rhythm, axis, and the morphology of each wave and interval. Here are some key steps:
Heart Rate:
Calculate using the R-R interval (the time between two successive R waves).
Heart Rhythm:
Determine if the rhythm is regular or irregular.
Identify the origin of the rhythm (e.g., sinus rhythm originates from the sinoatrial node).
Axis:
Determine the electrical axis of the heart, which can indicate conditions like left or right ventricular hypertrophy.
Wave and Interval Analysis:
Assess each wave and interval for abnormalities (e.g., elevated ST segments might indicate myocardial infarction; prolonged QT interval can indicate risk of arrhythmias).
Comparison with Previous ECGs:
Compare the current ECG with previous ones to identify changes over time.
Common ECG Abnormalities
Atrial Fibrillation: Irregular and often rapid heart rate with no distinct P waves.
Ventricular Tachycardia: Rapid heart rate originating
This document provides guidance on electrocardiogram (ECG) interpretation. It begins with descriptions of normal ECG appearances and measurements. It then discusses approaches to reading an ECG, including evaluating the patient details, heart rate, rhythm, axis, and conduction abnormalities. Various abnormalities are described such as arrhythmias, conduction blocks, abnormal P waves, QRS complexes, ST segments, and T waves. Causes and indications of different abnormalities are provided. The document concludes with descriptions of myocardial infarction patterns on ECG over time.
This document provides guidance on electrocardiogram (ECG) interpretation. It begins with descriptions of normal ECG appearances and measurements. It then discusses approaches to reading an ECG, including evaluating heart rate, rhythm, axis, and abnormalities. Common conduction abnormalities and what parts of the heart different abnormalities indicate are defined. The document concludes with descriptions of abnormalities in various ECG components like ST segments, T waves, and Q waves as well as the typical evolution of a myocardial infarction on ECG.
This document outlines a standardized method for interpreting 12-lead electrocardiograms (ECGs). The method involves analyzing six major sections in a specific order: heart rate, PR interval, QRS duration, QT interval, QRS axis, and waveforms. Each section is analyzed to identify any abnormalities, including intervals outside normal ranges or irregular waveforms. After following this method, the interpreter provides an overall interpretation of the ECG as normal or abnormal, listing any findings.
This document provides an overview of ECG basics, including the orientation and types of leads, limb and chest lead placement, cardiac conduction system, normal ECG intervals and measurements, common clinical conditions like ischemia and hypertrophy, arrhythmias including atrial fibrillation and ventricular tachycardia, conduction abnormalities such as bundle branch blocks, and pacemaker function. It describes the waves, segments, and intervals that make up an ECG and what they represent physiologically. Diagrams and examples are provided to illustrate different pathological ECG patterns.
This document provides an overview of ECG basics, including the orientation and types of leads, limb and chest lead placement, cardiac conduction system, normal ECG intervals and measurements, common clinical conditions like ischemia and hypertrophy, arrhythmias including atrial fibrillation and ventricular tachycardia, conduction abnormalities such as bundle branch blocks, and pacemaker function. It describes the waves, segments, and intervals that make up an ECG and what they represent physiologically. Diagrams and examples are provided to illustrate different pathologies.
CLASS 12th CHEMISTRY SOLID STATE ppt (Animated)eitps1506
Description:
Dive into the fascinating realm of solid-state physics with our meticulously crafted online PowerPoint presentation. This immersive educational resource offers a comprehensive exploration of the fundamental concepts, theories, and applications within the realm of solid-state physics.
From crystalline structures to semiconductor devices, this presentation delves into the intricate principles governing the behavior of solids, providing clear explanations and illustrative examples to enhance understanding. Whether you're a student delving into the subject for the first time or a seasoned researcher seeking to deepen your knowledge, our presentation offers valuable insights and in-depth analyses to cater to various levels of expertise.
Key topics covered include:
Crystal Structures: Unravel the mysteries of crystalline arrangements and their significance in determining material properties.
Band Theory: Explore the electronic band structure of solids and understand how it influences their conductive properties.
Semiconductor Physics: Delve into the behavior of semiconductors, including doping, carrier transport, and device applications.
Magnetic Properties: Investigate the magnetic behavior of solids, including ferromagnetism, antiferromagnetism, and ferrimagnetism.
Optical Properties: Examine the interaction of light with solids, including absorption, reflection, and transmission phenomena.
With visually engaging slides, informative content, and interactive elements, our online PowerPoint presentation serves as a valuable resource for students, educators, and enthusiasts alike, facilitating a deeper understanding of the captivating world of solid-state physics. Explore the intricacies of solid-state materials and unlock the secrets behind their remarkable properties with our comprehensive presentation.
Candidate young stellar objects in the S-cluster: Kinematic analysis of a sub...Sérgio Sacani
Context. The observation of several L-band emission sources in the S cluster has led to a rich discussion of their nature. However, a definitive answer to the classification of the dusty objects requires an explanation for the detection of compact Doppler-shifted Brγ emission. The ionized hydrogen in combination with the observation of mid-infrared L-band continuum emission suggests that most of these sources are embedded in a dusty envelope. These embedded sources are part of the S-cluster, and their relationship to the S-stars is still under debate. To date, the question of the origin of these two populations has been vague, although all explanations favor migration processes for the individual cluster members. Aims. This work revisits the S-cluster and its dusty members orbiting the supermassive black hole SgrA* on bound Keplerian orbits from a kinematic perspective. The aim is to explore the Keplerian parameters for patterns that might imply a nonrandom distribution of the sample. Additionally, various analytical aspects are considered to address the nature of the dusty sources. Methods. Based on the photometric analysis, we estimated the individual H−K and K−L colors for the source sample and compared the results to known cluster members. The classification revealed a noticeable contrast between the S-stars and the dusty sources. To fit the flux-density distribution, we utilized the radiative transfer code HYPERION and implemented a young stellar object Class I model. We obtained the position angle from the Keplerian fit results; additionally, we analyzed the distribution of the inclinations and the longitudes of the ascending node. Results. The colors of the dusty sources suggest a stellar nature consistent with the spectral energy distribution in the near and midinfrared domains. Furthermore, the evaporation timescales of dusty and gaseous clumps in the vicinity of SgrA* are much shorter ( 2yr) than the epochs covered by the observations (≈15yr). In addition to the strong evidence for the stellar classification of the D-sources, we also find a clear disk-like pattern following the arrangements of S-stars proposed in the literature. Furthermore, we find a global intrinsic inclination for all dusty sources of 60 ± 20◦, implying a common formation process. Conclusions. The pattern of the dusty sources manifested in the distribution of the position angles, inclinations, and longitudes of the ascending node strongly suggests two different scenarios: the main-sequence stars and the dusty stellar S-cluster sources share a common formation history or migrated with a similar formation channel in the vicinity of SgrA*. Alternatively, the gravitational influence of SgrA* in combination with a massive perturber, such as a putative intermediate mass black hole in the IRS 13 cluster, forces the dusty objects and S-stars to follow a particular orbital arrangement. Key words. stars: black holes– stars: formation– Galaxy: center– galaxies: star formation
The cost of acquiring information by natural selectionCarl Bergstrom
This is a short talk that I gave at the Banff International Research Station workshop on Modeling and Theory in Population Biology. The idea is to try to understand how the burden of natural selection relates to the amount of information that selection puts into the genome.
It's based on the first part of this research paper:
The cost of information acquisition by natural selection
Ryan Seamus McGee, Olivia Kosterlitz, Artem Kaznatcheev, Benjamin Kerr, Carl T. Bergstrom
bioRxiv 2022.07.02.498577; doi: https://doi.org/10.1101/2022.07.02.498577
PPT on Direct Seeded Rice presented at the three-day 'Training and Validation Workshop on Modules of Climate Smart Agriculture (CSA) Technologies in South Asia' workshop on April 22, 2024.
ESA/ACT Science Coffee: Diego Blas - Gravitational wave detection with orbita...Advanced-Concepts-Team
Presentation in the Science Coffee of the Advanced Concepts Team of the European Space Agency on the 07.06.2024.
Speaker: Diego Blas (IFAE/ICREA)
Title: Gravitational wave detection with orbital motion of Moon and artificial
Abstract:
In this talk I will describe some recent ideas to find gravitational waves from supermassive black holes or of primordial origin by studying their secular effect on the orbital motion of the Moon or satellites that are laser ranged.
Anti-Universe And Emergent Gravity and the Dark UniverseSérgio Sacani
Recent theoretical progress indicates that spacetime and gravity emerge together from the entanglement structure of an underlying microscopic theory. These ideas are best understood in Anti-de Sitter space, where they rely on the area law for entanglement entropy. The extension to de Sitter space requires taking into account the entropy and temperature associated with the cosmological horizon. Using insights from string theory, black hole physics and quantum information theory we argue that the positive dark energy leads to a thermal volume law contribution to the entropy that overtakes the area law precisely at the cosmological horizon. Due to the competition between area and volume law entanglement the microscopic de Sitter states do not thermalise at sub-Hubble scales: they exhibit memory effects in the form of an entropy displacement caused by matter. The emergent laws of gravity contain an additional ‘dark’ gravitational force describing the ‘elastic’ response due to the entropy displacement. We derive an estimate of the strength of this extra force in terms of the baryonic mass, Newton’s constant and the Hubble acceleration scale a0 = cH0, and provide evidence for the fact that this additional ‘dark gravity force’ explains the observed phenomena in galaxies and clusters currently attributed to dark matter.
(June 12, 2024) Webinar: Development of PET theranostics targeting the molecu...Scintica Instrumentation
Targeting Hsp90 and its pathogen Orthologs with Tethered Inhibitors as a Diagnostic and Therapeutic Strategy for cancer and infectious diseases with Dr. Timothy Haystead.
Authoring a personal GPT for your research and practice: How we created the Q...Leonel Morgado
Thematic analysis in qualitative research is a time-consuming and systematic task, typically done using teams. Team members must ground their activities on common understandings of the major concepts underlying the thematic analysis, and define criteria for its development. However, conceptual misunderstandings, equivocations, and lack of adherence to criteria are challenges to the quality and speed of this process. Given the distributed and uncertain nature of this process, we wondered if the tasks in thematic analysis could be supported by readily available artificial intelligence chatbots. Our early efforts point to potential benefits: not just saving time in the coding process but better adherence to criteria and grounding, by increasing triangulation between humans and artificial intelligence. This tutorial will provide a description and demonstration of the process we followed, as two academic researchers, to develop a custom ChatGPT to assist with qualitative coding in the thematic data analysis process of immersive learning accounts in a survey of the academic literature: QUAL-E Immersive Learning Thematic Analysis Helper. In the hands-on time, participants will try out QUAL-E and develop their ideas for their own qualitative coding ChatGPT. Participants that have the paid ChatGPT Plus subscription can create a draft of their assistants. The organizers will provide course materials and slide deck that participants will be able to utilize to continue development of their custom GPT. The paid subscription to ChatGPT Plus is not required to participate in this workshop, just for trying out personal GPTs during it.
Mending Clothing to Support Sustainable Fashion_CIMaR 2024.pdfSelcen Ozturkcan
Ozturkcan, S., Berndt, A., & Angelakis, A. (2024). Mending clothing to support sustainable fashion. Presented at the 31st Annual Conference by the Consortium for International Marketing Research (CIMaR), 10-13 Jun 2024, University of Gävle, Sweden.
The binding of cosmological structures by massless topological defectsSérgio Sacani
Assuming spherical symmetry and weak field, it is shown that if one solves the Poisson equation or the Einstein field
equations sourced by a topological defect, i.e. a singularity of a very specific form, the result is a localized gravitational
field capable of driving flat rotation (i.e. Keplerian circular orbits at a constant speed for all radii) of test masses on a thin
spherical shell without any underlying mass. Moreover, a large-scale structure which exploits this solution by assembling
concentrically a number of such topological defects can establish a flat stellar or galactic rotation curve, and can also deflect
light in the same manner as an equipotential (isothermal) sphere. Thus, the need for dark matter or modified gravity theory is
mitigated, at least in part.
Describing and Interpreting an Immersive Learning Case with the Immersion Cub...Leonel Morgado
Current descriptions of immersive learning cases are often difficult or impossible to compare. This is due to a myriad of different options on what details to include, which aspects are relevant, and on the descriptive approaches employed. Also, these aspects often combine very specific details with more general guidelines or indicate intents and rationales without clarifying their implementation. In this paper we provide a method to describe immersive learning cases that is structured to enable comparisons, yet flexible enough to allow researchers and practitioners to decide which aspects to include. This method leverages a taxonomy that classifies educational aspects at three levels (uses, practices, and strategies) and then utilizes two frameworks, the Immersive Learning Brain and the Immersion Cube, to enable a structured description and interpretation of immersive learning cases. The method is then demonstrated on a published immersive learning case on training for wind turbine maintenance using virtual reality. Applying the method results in a structured artifact, the Immersive Learning Case Sheet, that tags the case with its proximal uses, practices, and strategies, and refines the free text case description to ensure that matching details are included. This contribution is thus a case description method in support of future comparative research of immersive learning cases. We then discuss how the resulting description and interpretation can be leveraged to change immersion learning cases, by enriching them (considering low-effort changes or additions) or innovating (exploring more challenging avenues of transformation). The method holds significant promise to support better-grounded research in immersive learning.
2. Content Page
1. Step 1: Heart Rate
a. Calculating regular heart rate
b. Calculating irregular heart rate
2. Step 2: Rhythm
a. Regular VS Irregular
b. Regularly irregular VS Irregularly Irregular
3. Step 3: Cardiac Axis
a. Normal
b. Right Deviation - Pulmonary conditions
c. Left Deviation - Conduction defects
4. Step 4: P-waves
a. Present?
b. Followed by QRS?
c. Look normal?
d. If not present, any atrial activity at all? - ?Atrial
Fibrillation
5. Step 5: P-R Interval
6. Step 6: QRS Complex
7. Step 7: ST Segment
8. Step 8: T-Waves
9. U Waves
3. STEP 1: Heart Rate
Heart rate can be calculated using the following method (if regular):
● Count the number of large squares present within one R-R interval
● Divide 300 by this number to calculate the heart rate
e.g. 4 large squares in an R-R interval: 300/4 = 75 beats per minute
If the rhythm is irregular:
● The first method of calculating the heart rate doesn’t work when the R-R interval differs significantly throughout the
ECG and therefore another method is required
○ Count the number of complexes on the rhythm strip (each rhythm strip is 10 seconds long)
○ Multiply the number of complexes by 6 (giving you the average number of complexes in 1 minute)
e.g. 10 complexes on a rhythm strip X 6 = 60 beats per minute
4. Step 1: Heart Rate
(cont’d)
What’s a normal adult heart rate?
● Normal = 60 – 100 bpm
● Tachycardia > 100 bpm
● Bradycardia < 60 bpm
Hint: If there are obviously P-waves present, check the ventricular rate and the atrial rate. The rates will be the same if
there is 1:1 AV conduction.
5. Step 2: Rhythm
The heart rhythm can be regular or irregular.
Irregular rhythms can be either:
● Regularly irregular (i.e. a recurrent pattern of irregularity)
● Irregularly irregular (i.e. completely disorganised)
Mark out several consecutive R-R intervals on a piece of paper, then move them along the rhythm strip to check if the subsequent
intervals are the same.
Hint – if you are suspicious that there is some atrioventricular block, map out the atrial rate and the ventricular rhythm separately (i.e. mark
the P waves and R waves). As you move along the rhythm strip, you can then see if the PR interval changes, if QRS complexes are missing
or if there is complete dissociation between the two.
Irregularly irregular - Atrial Fibrillation
6. Step 3: Cardiac Axis
Cardiac axis describes the overall direction of electrical spread within
the heart.
In a healthy individual the axis should spread from 11 o’clock to 5
o’clock.
To determine the cardiac axis you need to look at leads I, II and III.
What is Cardiac Axis?
The electrical activity of the heart starts at the sinoatrial (SA) node then
spreads to the atrio-ventricular (AV) node.
It then spreads down the bundle of his and then purkinje fibres to cause
ventricular contraction.
So when viewing the heart from the front, the direction of depolarisation is
11 o’clock to 5 o’clock.
The general direction of depolarisation is known as the cardiac axis.
7. Step 3: Cardiac Axis (cont’d)
Normal cardiac axis
In normal cardiac axis:
● Lead II has the most positive deflection compared to Leads I and III
In healthy individuals you would expect a normal direction of spread (11 o’clock
to 5 o’clock).
Therefore the spread of depolarisation would be heading towards leads I,II and
III.
As a result you would see a positive deflection in all of these leads.
With lead II being the most positive (it’s at 5 o’clock).
You would expect to see the most negative deflection in aVR.
This is due to aVR looking at the heart in the opposite direction to lead II.
8. Step 3: Cardiac Axis (cont’d)
Right axis deviation
In right axis deviation:
● Lead III has the most positive deflection and Lead I should be negative
● This is commonly seen in individuals with right ventricular hypertrophy
● Right axis deviation (RAD) is usually caused by right ventricular
hypertrophy.
● In right axis deviation the direction of depolarisation is distorted to the
right (1-7 o’clock).
● Extra heart muscle causes a stronger signal to be generated by the right
side of the heart.
● This causes the deflection in lead I to become negative and deflection in
lead aVF / III to be more positive.
● RAD is associated with pulmonary conditions as they put strain on the
right side of the heart.
9. Step 3: Cardiac Axis (cont’d)
Left axis deviation
In left axis deviation:
● Lead I has the most positive deflection
● Leads II and III are negative
● Left axis deviation is seen in individuals with heart conduction defects
In left axis deviation (LAD) the general direction of depolarisation becomes distorted to
the left.
This causes the deflection in lead III to become negative.
It is only considered significant if the deflection of Lead II also becomes negative.
LAD is usually caused by conduction defects and not by increased mass of the left
ventricle.
10. Step 4: P-waves
Next we look at the P-waves and answer
the following questions:
● Are P-waves present?
● If so, is each P-wave followed by a
QRS complex?
● Do the P-waves look normal? (check
duration, direction and shape)
● If not present, is there any atrial activity
e.g. sawtooth baseline → flutter waves
/ chaotic baseline → fibrillation waves /
flat line → no atrial activity at all?
Hint – If P-waves are absent and there is an
irregular rhythm it may suggest atrial fibrillation
11. Step 5: P-R Interval
The P-R interval should be between 120-200 ms (3-
5 small squares)
Prolonged PR interval (>0.2 seconds)
A prolonged PR interval suggests there is
atrioventricular delay (AV block)
First degree heart block
First degree heart block involves a fixed prolonged PR
interval (>200 ms)
Second degree heart block (Mobitz type 1)
If the PR interval slowly increases then there is a
dropped QRS complex (beat), this is MOBITZ TYPE I
SECOND DEGREE AV BLOCK (Wenckebach)
12. Step 5: P-R interval (cont’d)
Second degree heart block (Mobitz type 2)
If the PR interval is fixed but there are dropped beats, this is MOBITZ TYPE 2 SECOND DEGREE HEART BLOCK (clarify
that by the frequency of dropped beats e.g 2:1, 3:1, 4:1)
Third degree heart block (complete heart block)
If the P waves and QRS complexes are completely unrelated, this is THIRD DEGREE AV BLOCK (complete heart block)
13. Step 5: P-R interval (cont’d)
Tips for remembering types of heart block
To help remember these degrees of AV block, it is useful to remember the anatomical location of the block in the
conducting system:
● First degree AV block:
○ Occurs between the SA node and the AV node (i.e. within the atrium)
● Second degree AV block:
○ Mobitz I (Wenckebach) – occurs IN the AV node. This is the only piece of conductive tissue in the heart which
exhibits the ability to conduct at different speeds
○ Mobitz II – occurs AFTER the AV node in the bundle of His or Purkinje fibres
● Third degree AV block:
○ Occurs anywhere from the AV node down causing complete blockage of conduction
14. Step 5: P-R interval (cont’d)
Shortened PR interval
If the PR interval is short, this means one of two things:
● Simply, the P-wave is originating from somewhere closer to the AV node so the conduction takes less time (the SA
node is not in a fixed place and some people’s atria are smaller than others!)
● The atrial impulse is getting to the ventricle by a faster shortcut instead of conducting slowly across the atrial wall.
This is an accessory pathway and can be associated with a delta wave (see below which demonstrates an ECG of a
patient with Wolff Parkinson White syndrome)
15. Step 6: QRS Complex
There are several aspects of the QRS complex you need to assess:
● Width
● Height
● Morphology
Width can be described as NARROW (< 0.12 seconds) or BROAD (> 0.12 seconds)
● A narrow QRS complex occurs when the impulse is conducted down the bundle of His and the Purkinje fibre to the
ventricles. This results in well organised synchronised ventricular depolarisation.
● A broad QRS complex occurs if there is an abnormal depolarisation sequence – for example, a ventricular ectopic
where the impulse spreads slowly across the myocardium from the focus in the ventricle. In contrast, an atrial ectopic
would result in a narrow QRS complex because it would conduct down the normal conduction system of the heart.
Similarly, a bundle branch block results in a broad QRS because the impulse gets to one ventricle rapidly down the
intrinsic conduction system then has to spread slowly across the myocardium to the other ventricle.
16. Step 6: QRS Complex (cont’d)
Height
Describe this as SMALL or TALL:
● Small complexes are defined as < 5mm in the limb leads or < 10 mm in the chest leads.
● Tall complexes imply ventricular hypertrophy (although can be due to body habitus e.g. tall slim people). There are
numerous algorithms for measuring LVH, such as the Sokolow-Lyon index or the Cornell index.
Morphology
You need to assess the individual waves of the QRS complex.
17. Step 6: QRS Complex (cont’d)
Delta wave
The mythical ‘delta wave’ is a sign that the ventricles are being activated earlier than normal from a point distant to the AV
node. The early activation then spreads slowly across the myocardium causing the slurred upstroke of the QRS complex.
Note – the presence of a delta wave does NOT diagnose Wolff-Parkinson-White syndrome. This requires evidence of
tachyarrhythmias AND a delta wave.
18. Step 6: QRS Complex (cont’d)
Q-waves
Isolated Q waves can be normal. A pathological Q wave is > 25% the size of the R wave that follows it or > 2mm in height
and > 40ms in width. A single Q wave is not a cause for concern – look for Q waves in an entire territory (anterior / inferior)
for evidence of previous MI.
19. Step 6: QRS Complex (cont’d)
R and S waves
Look for R wave progression across the chest leads (from small in V1 to large in V6). The transition from S > R wave to R
> S wave should occur in V3 or V4. Poor progression (i.e. S > R through to leads V5 and V6) can be a sign of previous MI
but can also occur in very large people due to lead position.
20. Step 6: QRS Complex (cont’d)
J point segment
The J point is where the S wave joins the ST segment
This point can be elevated resulting in the ST segment that follows it also being raised (this is known as “High take off”)
High take off (or benign early repolarisation to give its full title) is a normal variant that causes a lot of angst and confusion
as it LOOKS like ST elevation
Key points:
● Benign early repolarisation occurs mostly under the age of 50 (over age of 50, ischaemia is more common and
should be suspected first)
● Typically, the J point is raised with widespread ST elevation in multiple territories making ischaemia less likely
● The T waves are also raised (in contrast to a STEMI where the T wave remains the same size and the ST segment
is raised)
● The changes do not change! During a STEMI, the changes will evolve – in benign early repolarisation, they will
remain the same.
21. Step 7: ST Segment
The ST segment is the part of the ECG between the end of the
S wave and start of the T wave.
In a healthy individual it should be an isoelectric line (neither
elevated or depressed).
Abnormalities of the ST segment should be investigated to rule
out pathology.
ST elevation
ST elevation is significant when it is greater than 1 mm (1 small
square) in 2 or more contiguous limb leads or >2mm in 2 or
more chest leads.
It is most commonly caused by acute full thickness myocardial
infarction.
ST depression
ST depression ≥ 0.5 mm in ≥ 2 contiguous leads indicates
myocardial ischaemia.
22. Step 8: T waves
The T waves represent repolarisation of the
ventricles
Tall T waves
T waves are tall if they are:
● > 5mm in the limb leads AND
● > 10mm in the chest leads (the same criteria
as ‘small’ QRS complexes)
Tall T waves can be associated with:
● Hyperkalaemia (“Tall tented T waves”)
● Hyperacute STEMI
23. Step 8: T-Waves (cont’d)
Inverted T waves
T waves are normally inverted in V1 and inversion in lead III is a normal variant.
Inverted T waves in other leads are a nonspecific sign of a wide variety of conditions:
● Ischaemia
● Bundle branch blocks (V4 – 6 in LBBB and V1 – V3 in RBBB)
● Pulmonary embolism
● Left ventricular hypertrophy (in the lateral leads)
● Hypertrophic cardiomyopathy (widespread)
● General illness
Around 50% of ITU admissions have some evidence of T wave inversion during their stay
Comment on the distribution of the T wave inversion e.g. anterior / lateral / posterior leads
You must take this ECG finding and apply it in the context of your patient
Biphasic T waves
Biphasic T waves have two peaks and can be indicative of ischaemia and hypokalaemia
24. Step 8: T-Waves (cont’d)
Flattened T waves
Another non-specific sign, this may represent ischaemia or electrolyte imbalance.
25. U Waves
Not a common finding.
The U wave is a > 0.5mm deflection after the T wave best seen in V2 or V3.
These become larger the slower the bradycardia – classically U waves are seen in various electrolyte imbalances or hypothermia,
or antiarrhythmic therapy (such as digoxin, procainamide or amiodarone).