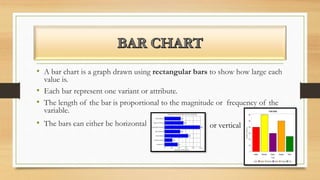
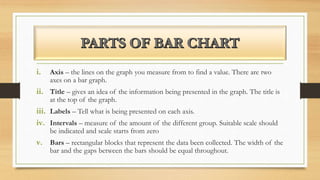
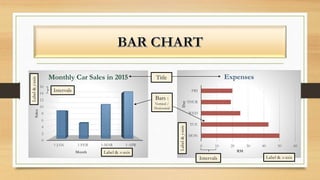
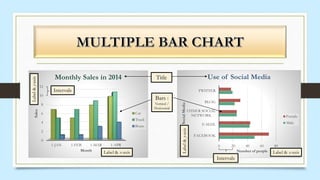
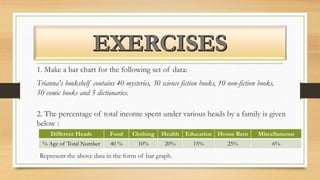
HOW TO
CONSTRUCT
Fruit: Apple Orange Banana Kiwifruit Blueberry Grapes
People: 35 30 10 25 40 5
A survey of 145 people, asked them "Which is the nicest fruit?"
That group of
people think
Blueberries are the
most nicest fruit.
• A bar chart is a graph drawn using rectangular bars to show how large each
value is.
• Each bar represent one variant or attribute.
• The length of the bar is proportional to the magnitude or frequency of the
variable.
• The bars can either be horizontal or vertical
i. Axis – the lines on the graph you measure from to find a value. There are two
axes on a bar graph.
ii. Title – gives an idea of the information being presented in the graph. The title is
at the top of the graph.
iii. Labels – Tell what is being presented on each axis.
iv. Intervals – measure of the amount of the different group. Suitable scale should
be indicated and scale starts from zero
v. Bars – rectangular blocks that represent the data been collected. The width of the
bar and the gaps between the bars should be equal throughout.
0
2
4
6
8
10
12
14
16
1-JAN 1-FEB 1-MAR 1-APR
Sales
Month
Monthly Car Sales in 2015
0 10 20 30 40 50 60
MON
TUE
WED
THUR
FRI
RM
Day
ExpensesTitle
Bars :
Vertical /
Horizontal
Label & x-axis
Label&y-axis
Label&y-axis
Intervals
Intervals
Label & x-axis
0
2
4
6
8
10
12
1-JAN 1-FEB 1-MAR 1-APR
Sales
Month
Monthly Sales in 2014
Car
Truck
Boats
0 20 40 60 80
FACEBOOK
E-MAIL
OTHER SOCIAL
NETWORK
BLOG
TWITTER
Number of people
SocialMedia
Use of Social Media
Female
Male
Title
Bars :
Vertical /
Horizontal
Label & x-axis
Label&y-axis
Label&y-axis
Intervals
Intervals
Label & x-axis
1. Make a bar chart for the following set of data:
Trianna's bookshelf contains 40 mysteries, 30 science fiction books, 10 non-fiction books,
50 comic books and 5 dictionaries.
2. The percentage of total income spent under various heads by a family is given
below :
Different Heads Food Clothing Health Education House Rent Miscellaneous
% Age of Total Number 40 % 10% 20% 15% 25% 6%
Represent the above data in the form of bar graph.
How to construct bar chart   lecturer

How to construct bar chart lecturer

  • 1.
  • 2.
    Fruit: Apple OrangeBanana Kiwifruit Blueberry Grapes People: 35 30 10 25 40 5 A survey of 145 people, asked them "Which is the nicest fruit?" That group of people think Blueberries are the most nicest fruit.
  • 3.
    • A barchart is a graph drawn using rectangular bars to show how large each value is. • Each bar represent one variant or attribute. • The length of the bar is proportional to the magnitude or frequency of the variable. • The bars can either be horizontal or vertical
  • 4.
    i. Axis –the lines on the graph you measure from to find a value. There are two axes on a bar graph. ii. Title – gives an idea of the information being presented in the graph. The title is at the top of the graph. iii. Labels – Tell what is being presented on each axis. iv. Intervals – measure of the amount of the different group. Suitable scale should be indicated and scale starts from zero v. Bars – rectangular blocks that represent the data been collected. The width of the bar and the gaps between the bars should be equal throughout.
  • 5.
    0 2 4 6 8 10 12 14 16 1-JAN 1-FEB 1-MAR1-APR Sales Month Monthly Car Sales in 2015 0 10 20 30 40 50 60 MON TUE WED THUR FRI RM Day ExpensesTitle Bars : Vertical / Horizontal Label & x-axis Label&y-axis Label&y-axis Intervals Intervals Label & x-axis
  • 6.
    0 2 4 6 8 10 12 1-JAN 1-FEB 1-MAR1-APR Sales Month Monthly Sales in 2014 Car Truck Boats 0 20 40 60 80 FACEBOOK E-MAIL OTHER SOCIAL NETWORK BLOG TWITTER Number of people SocialMedia Use of Social Media Female Male Title Bars : Vertical / Horizontal Label & x-axis Label&y-axis Label&y-axis Intervals Intervals Label & x-axis
  • 8.
    1. Make abar chart for the following set of data: Trianna's bookshelf contains 40 mysteries, 30 science fiction books, 10 non-fiction books, 50 comic books and 5 dictionaries. 2. The percentage of total income spent under various heads by a family is given below : Different Heads Food Clothing Health Education House Rent Miscellaneous % Age of Total Number 40 % 10% 20% 15% 25% 6% Represent the above data in the form of bar graph.