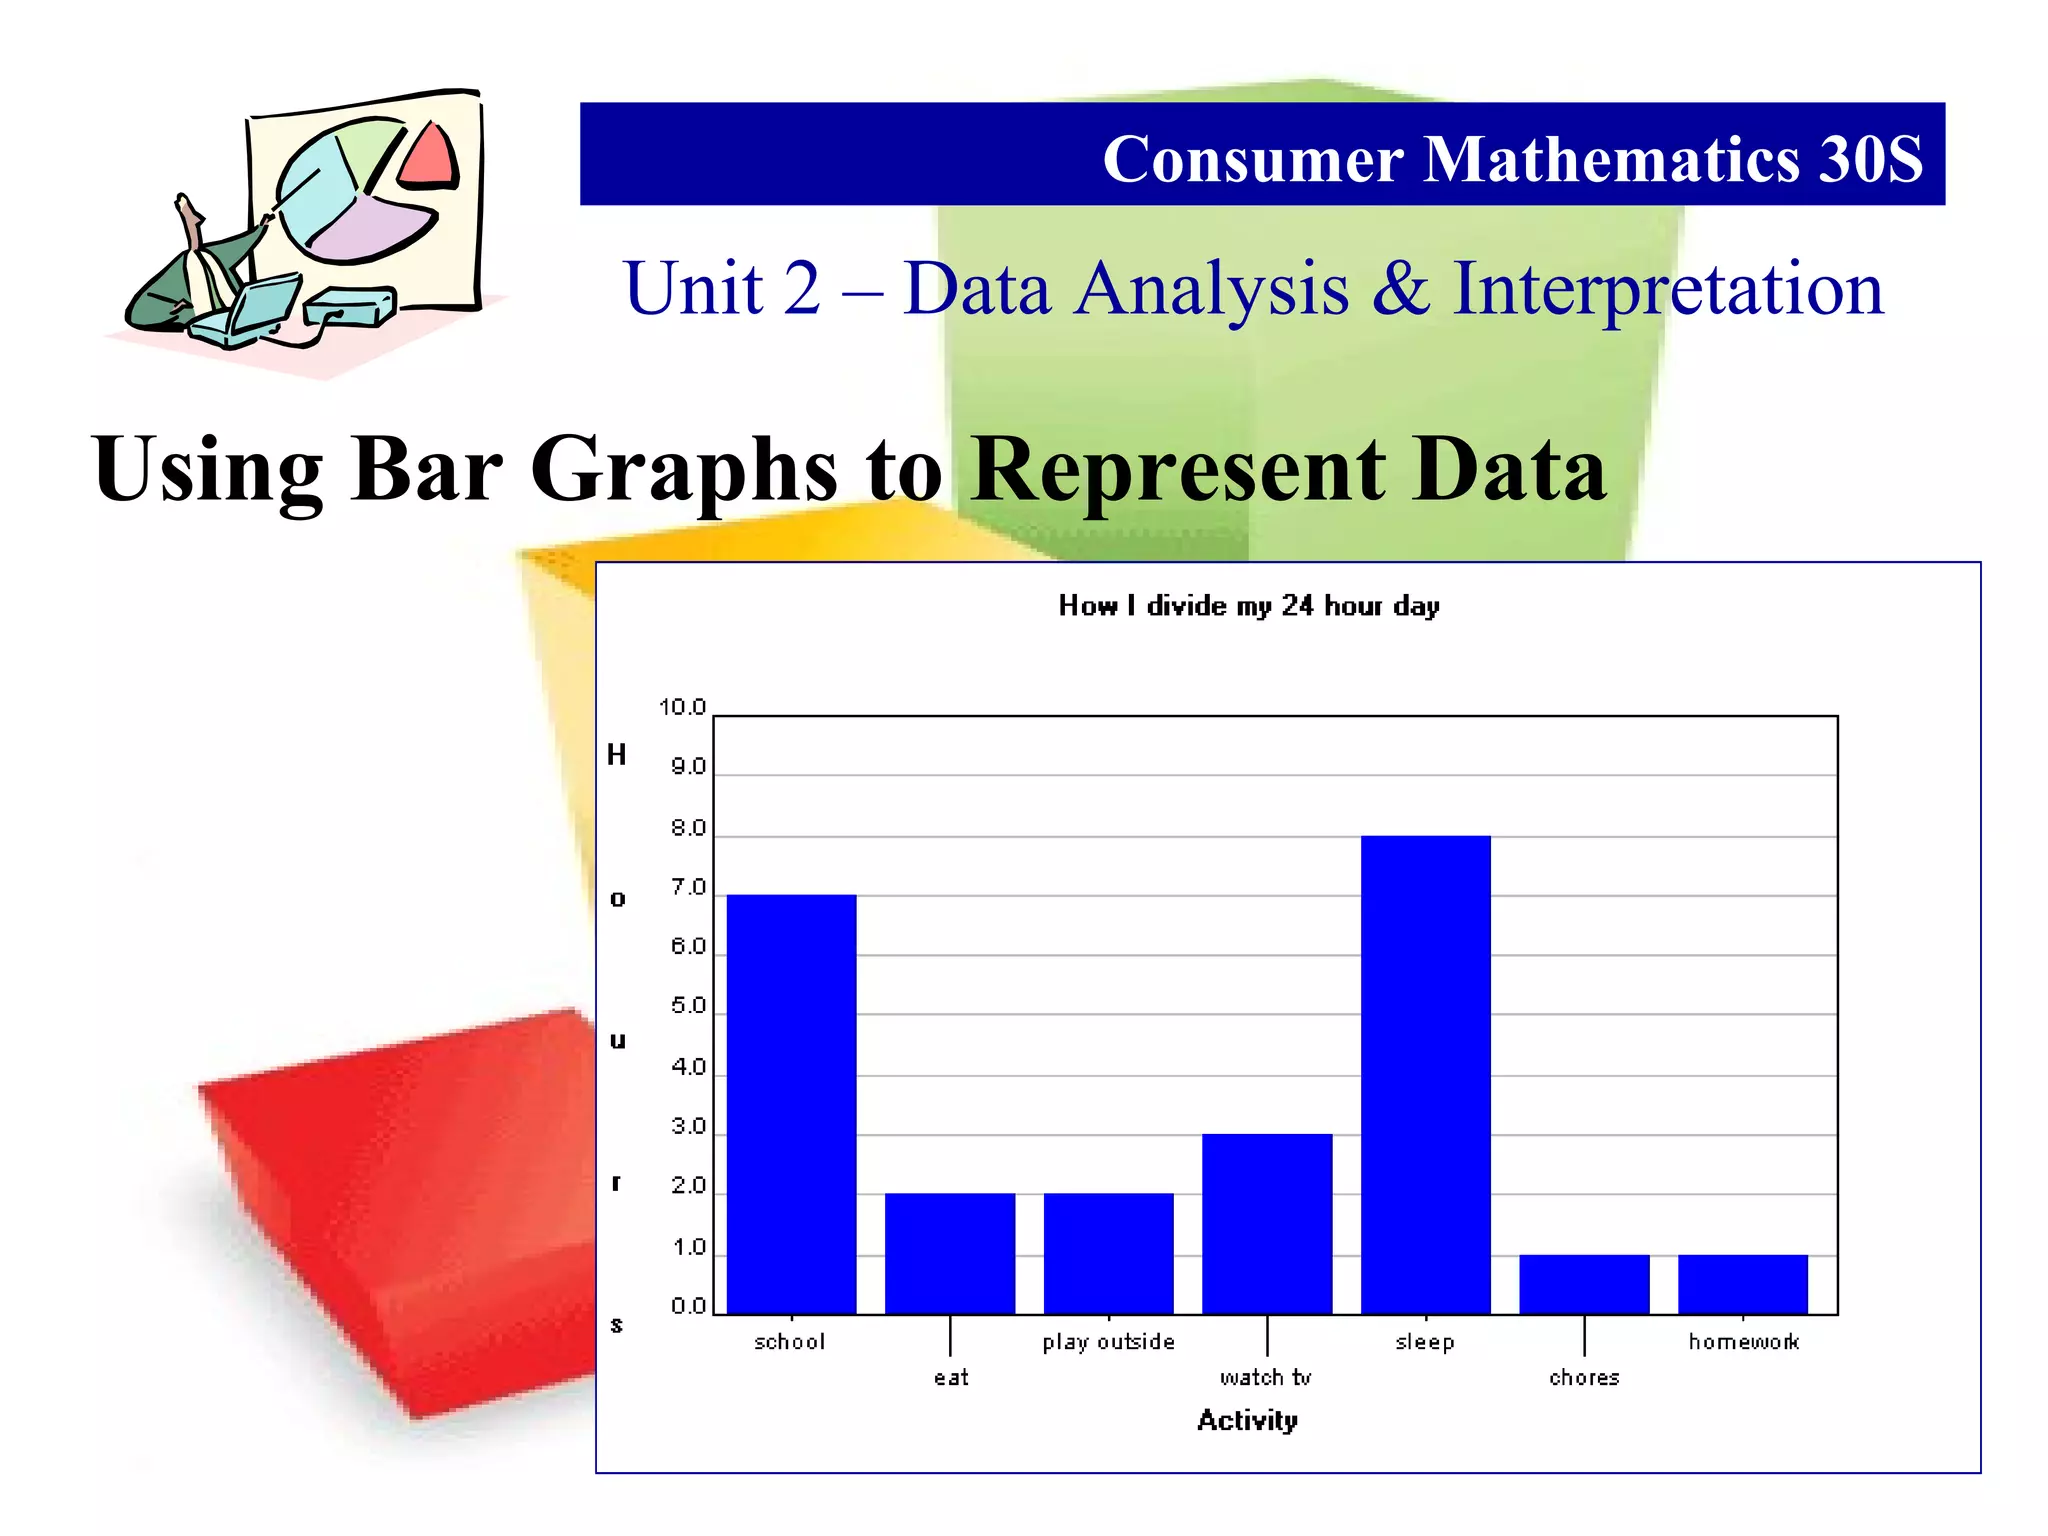
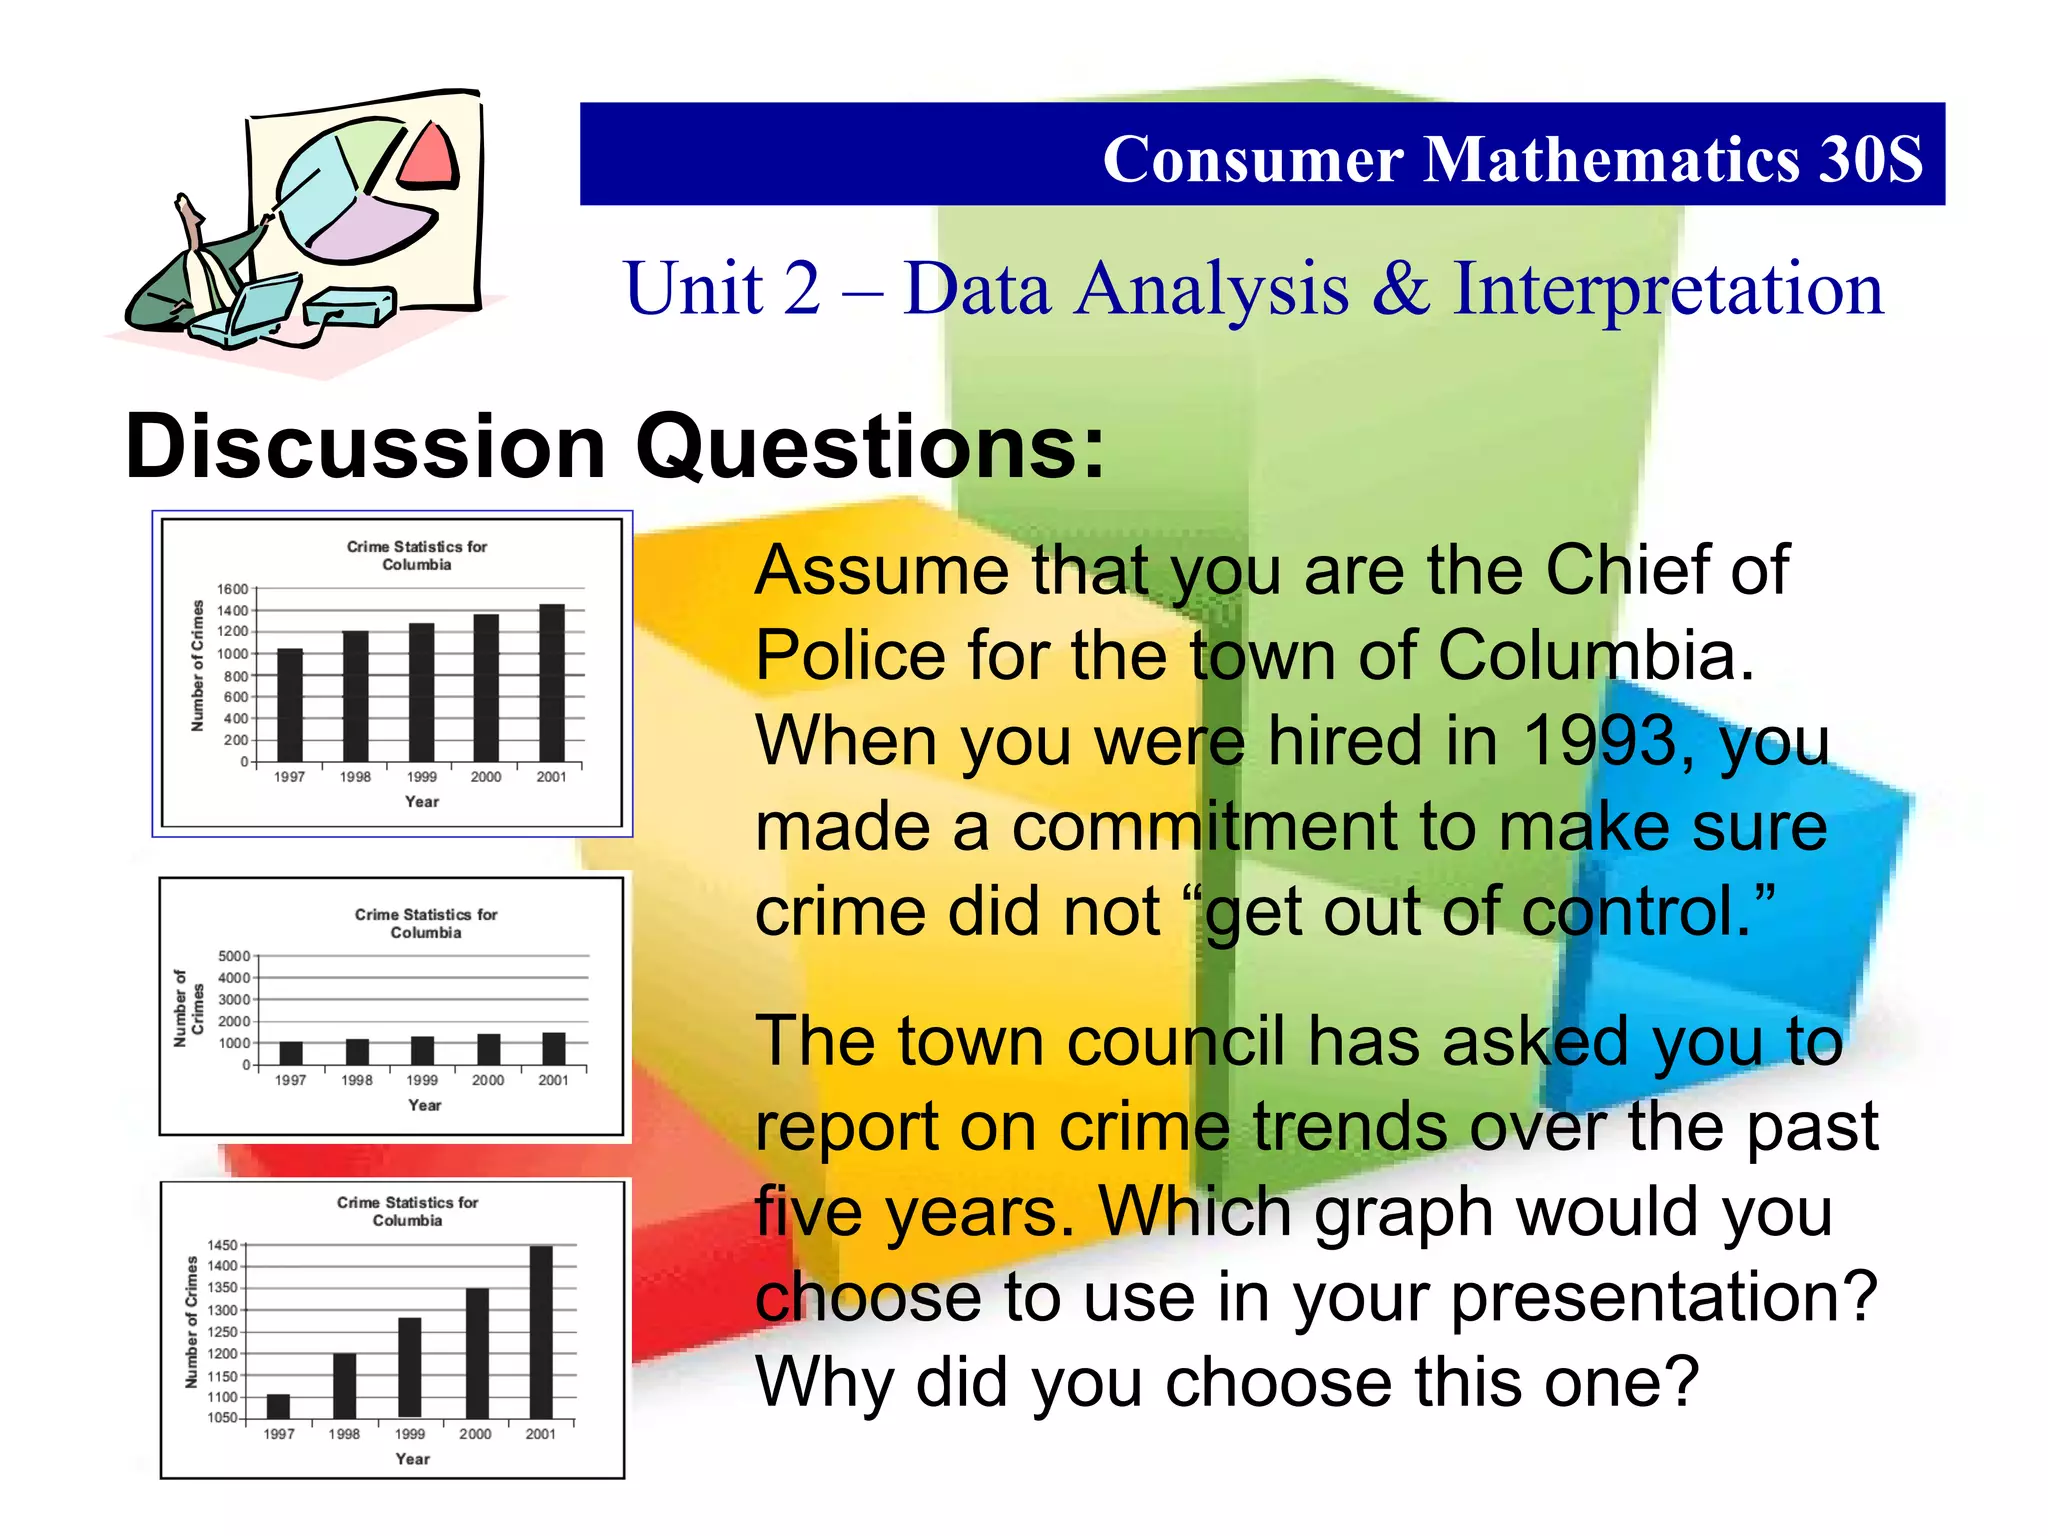
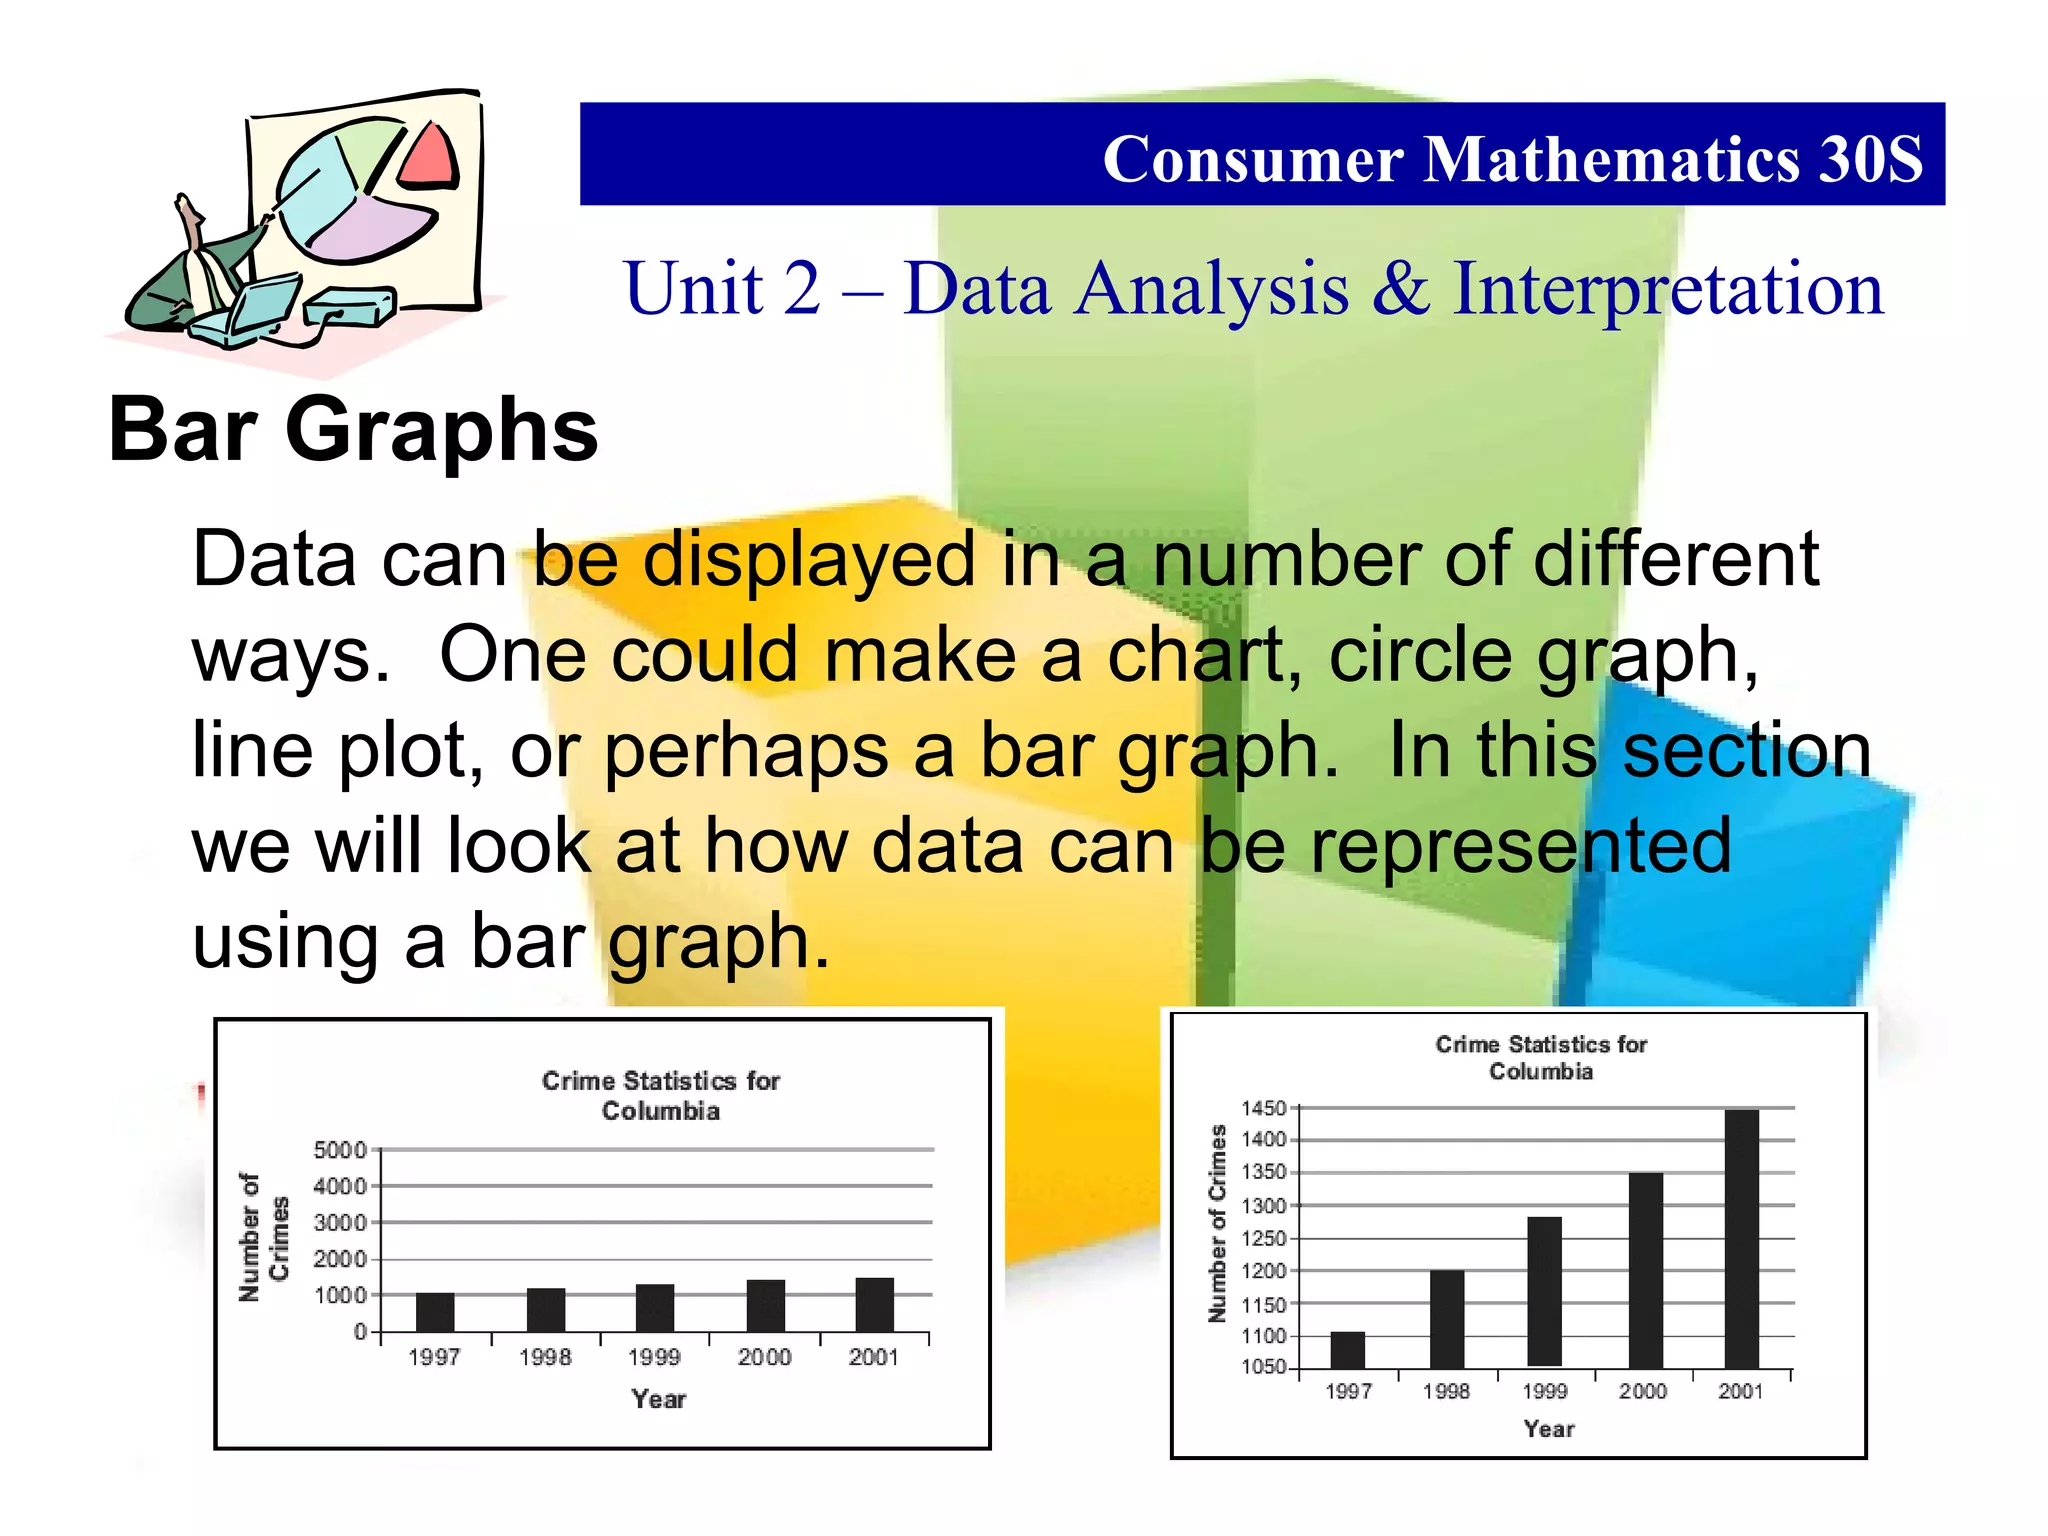
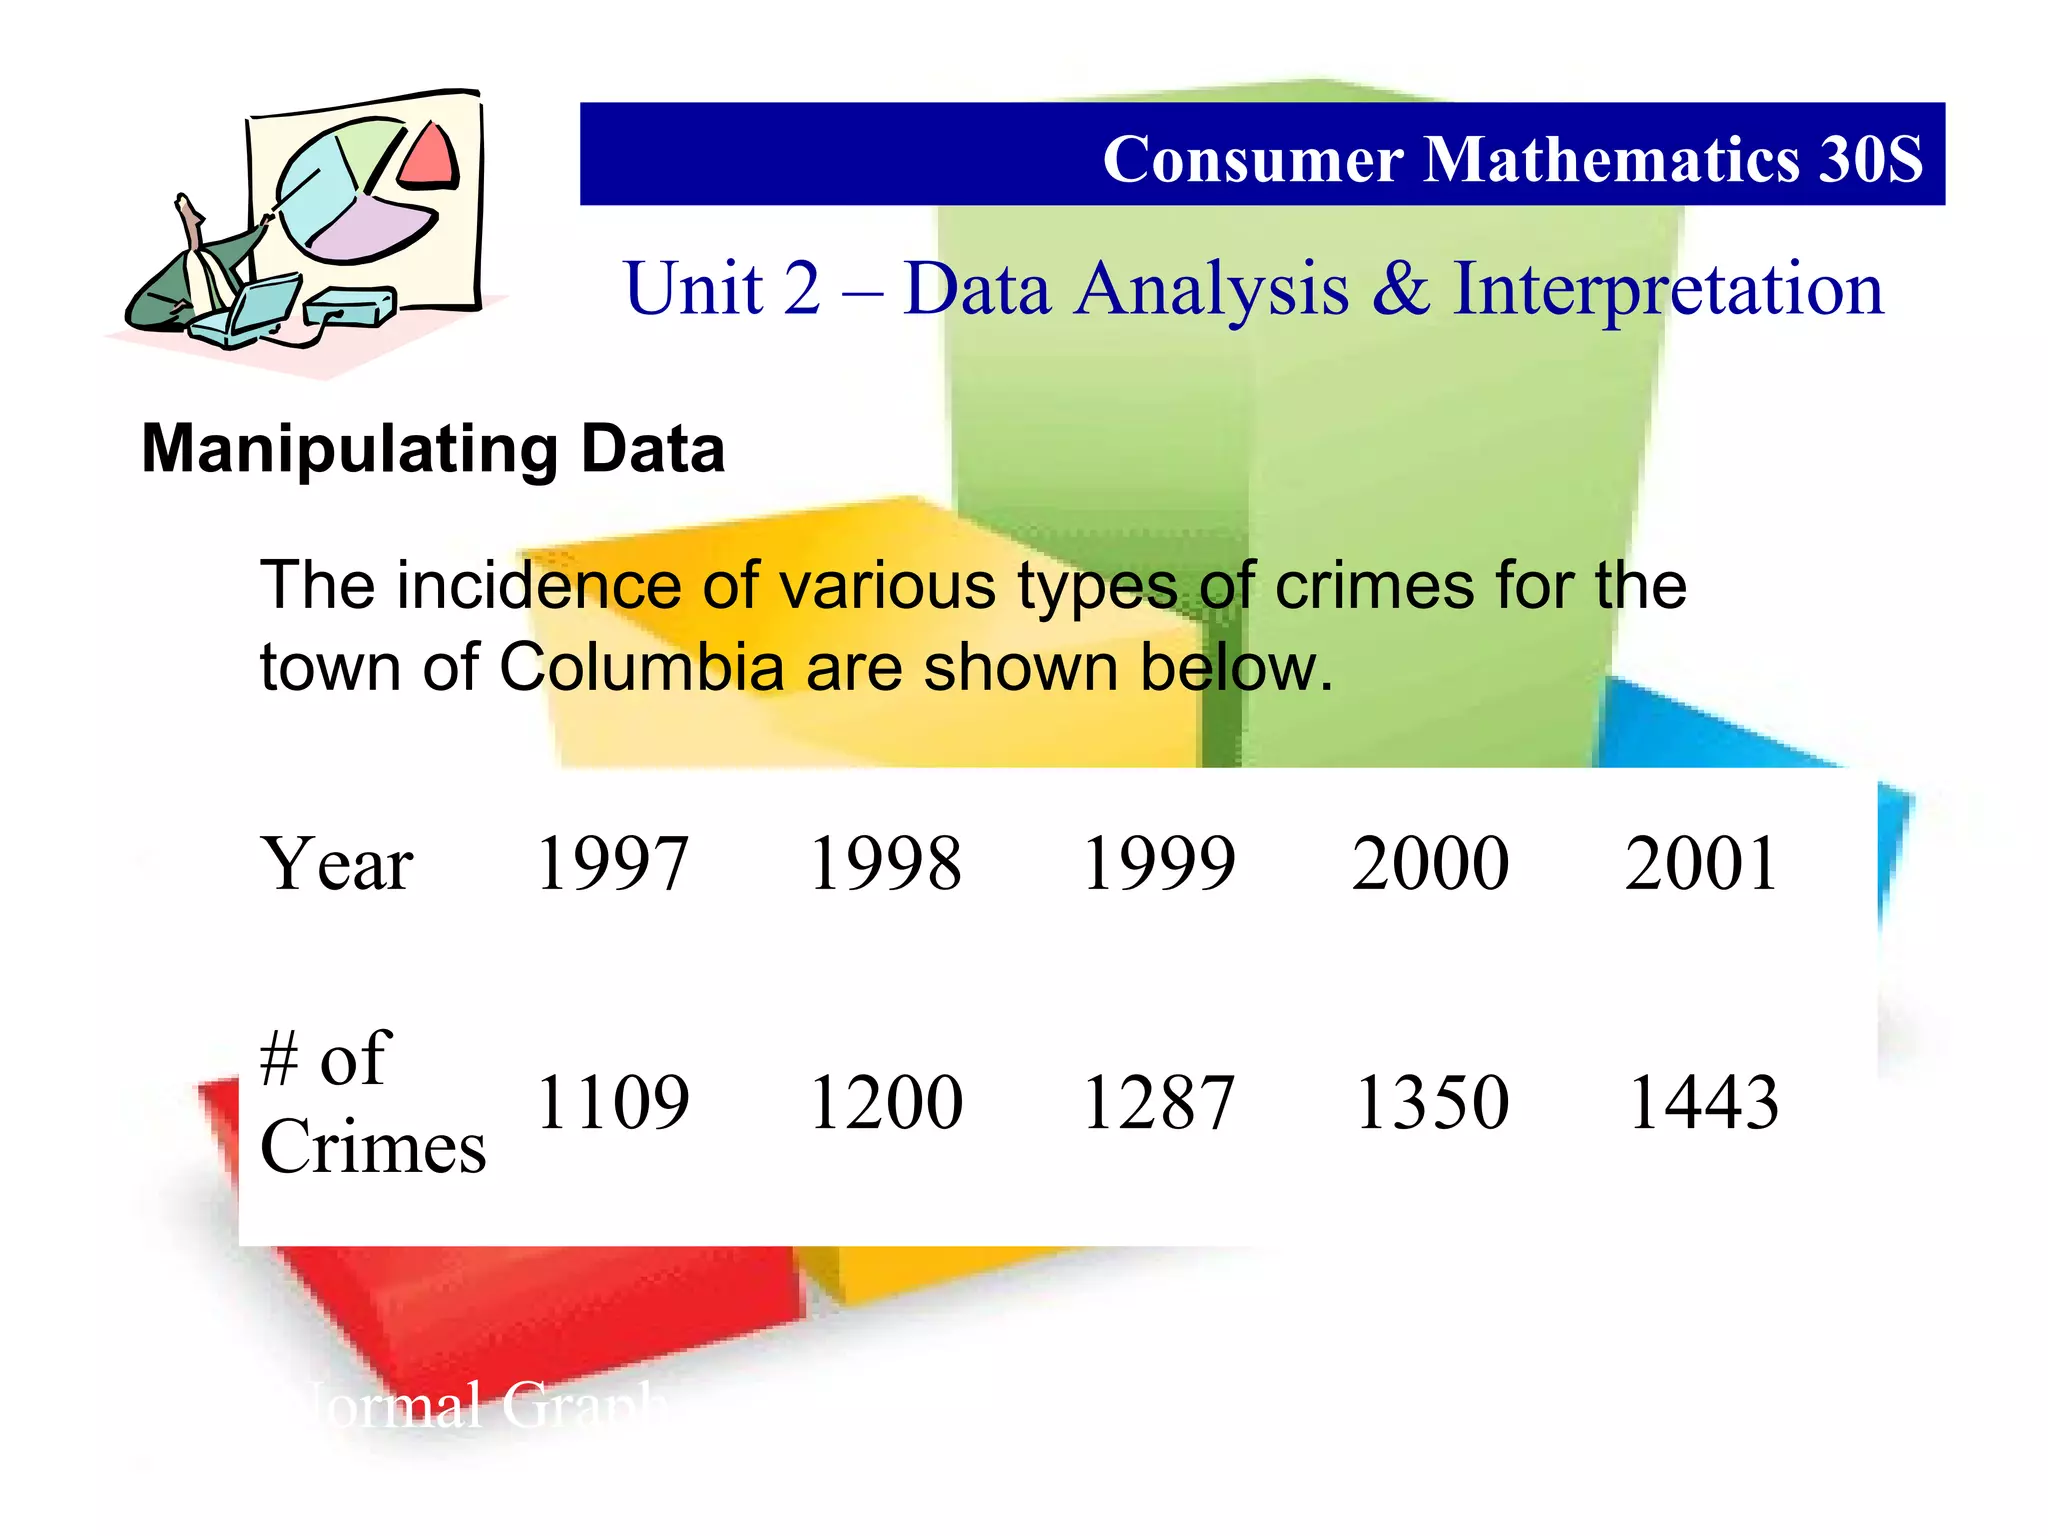
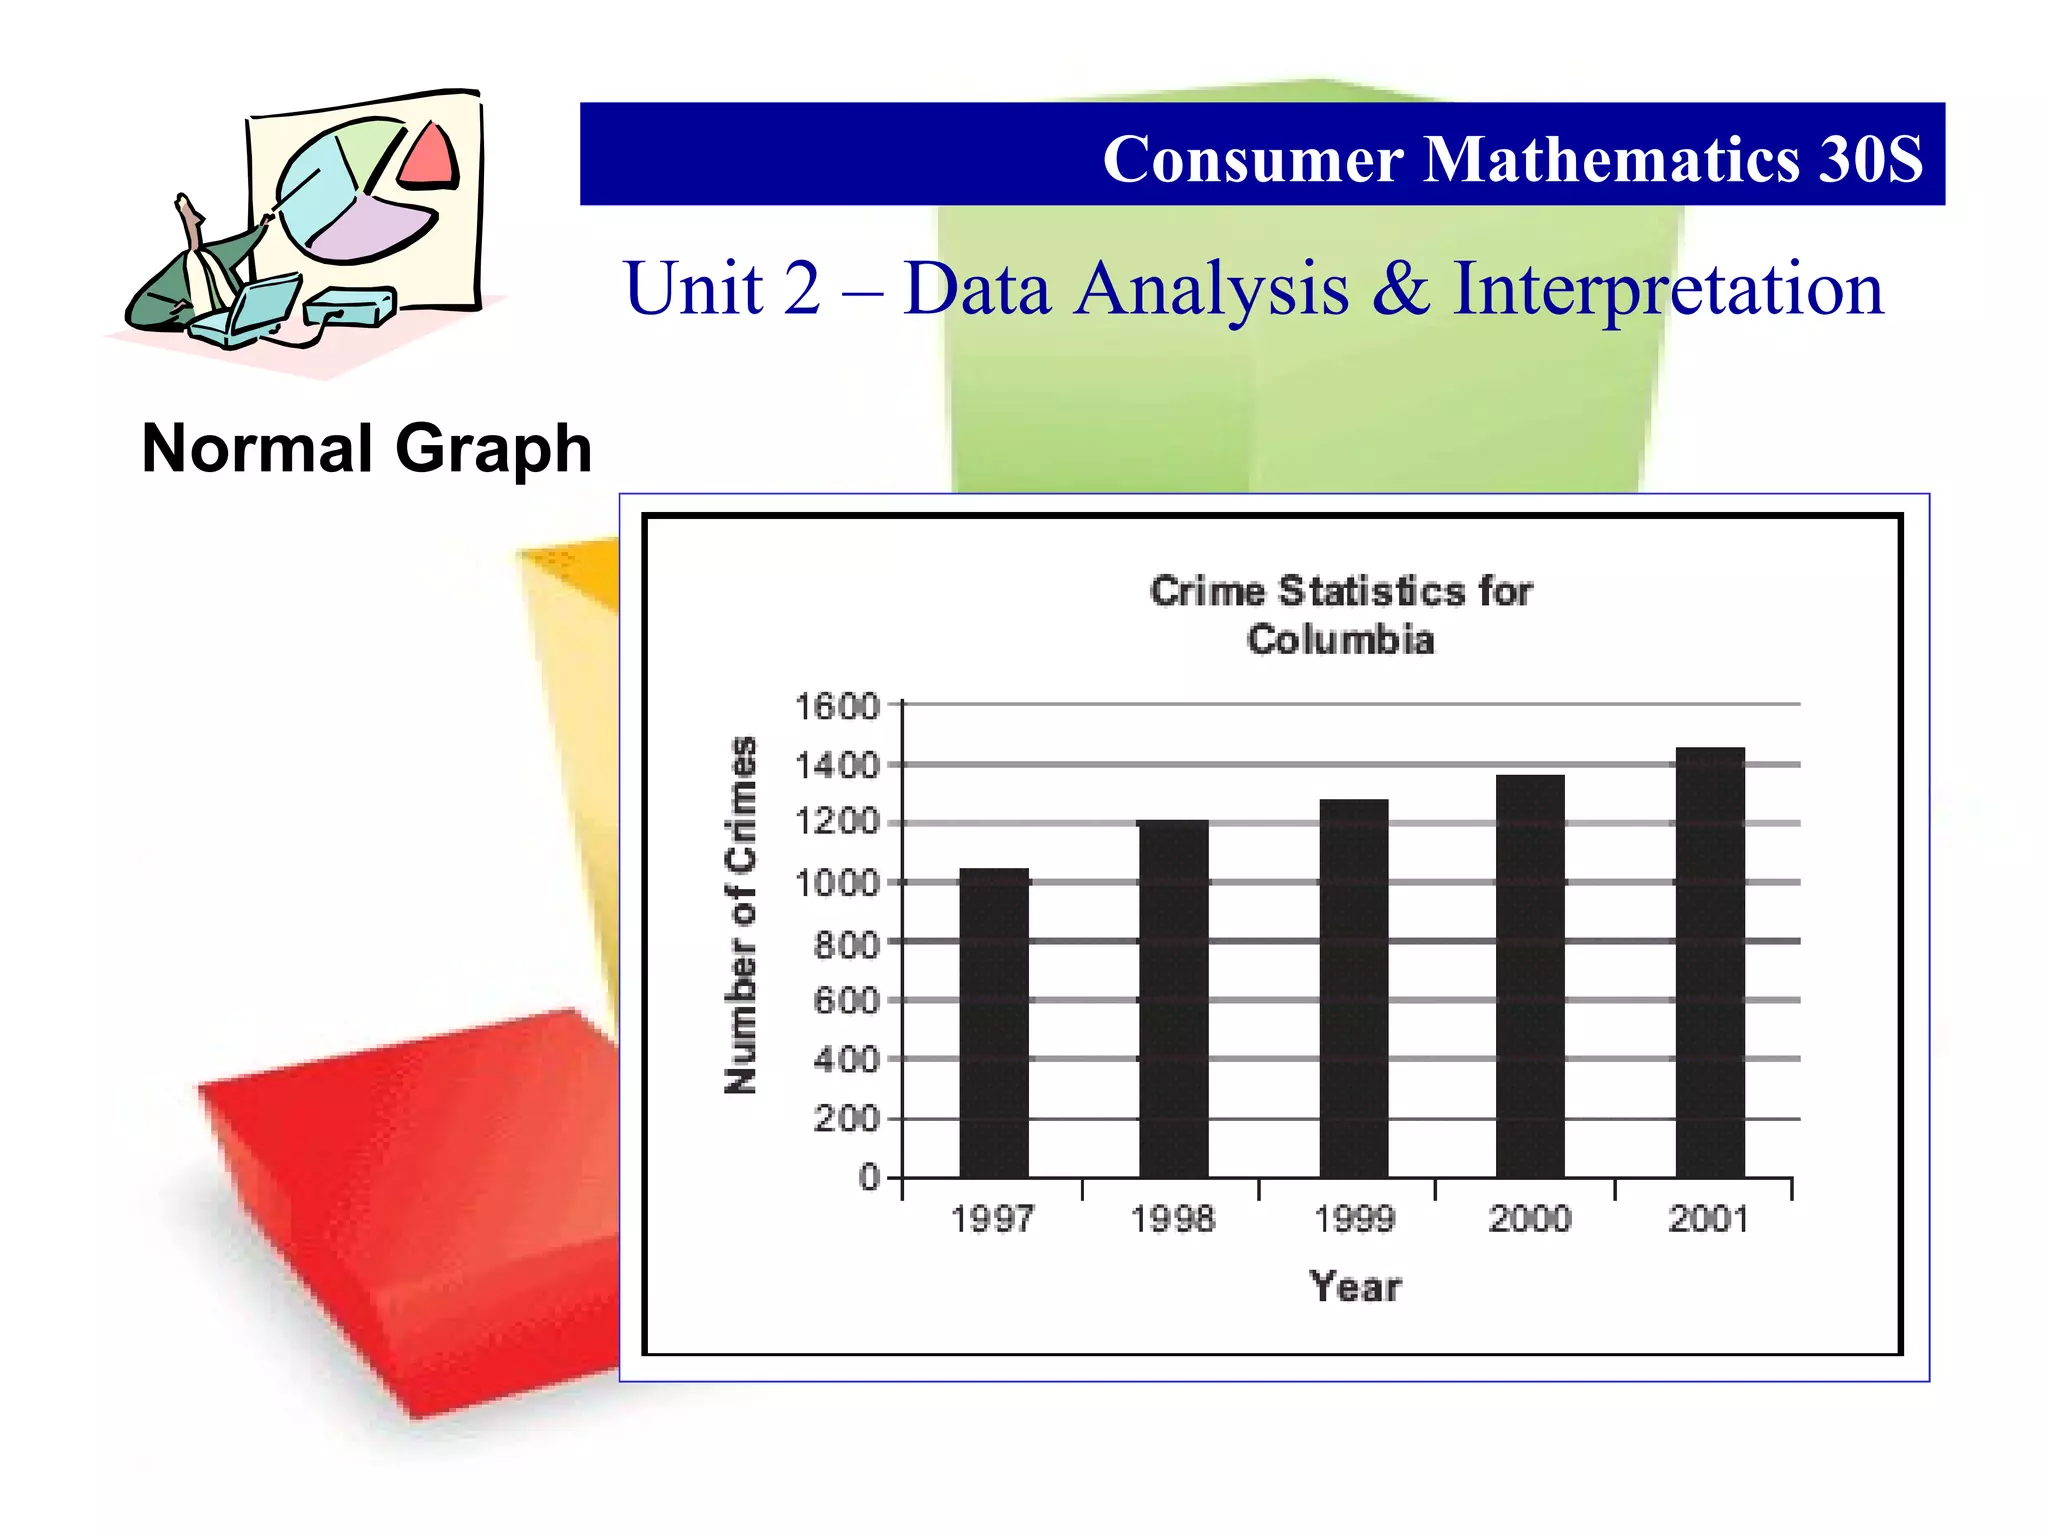
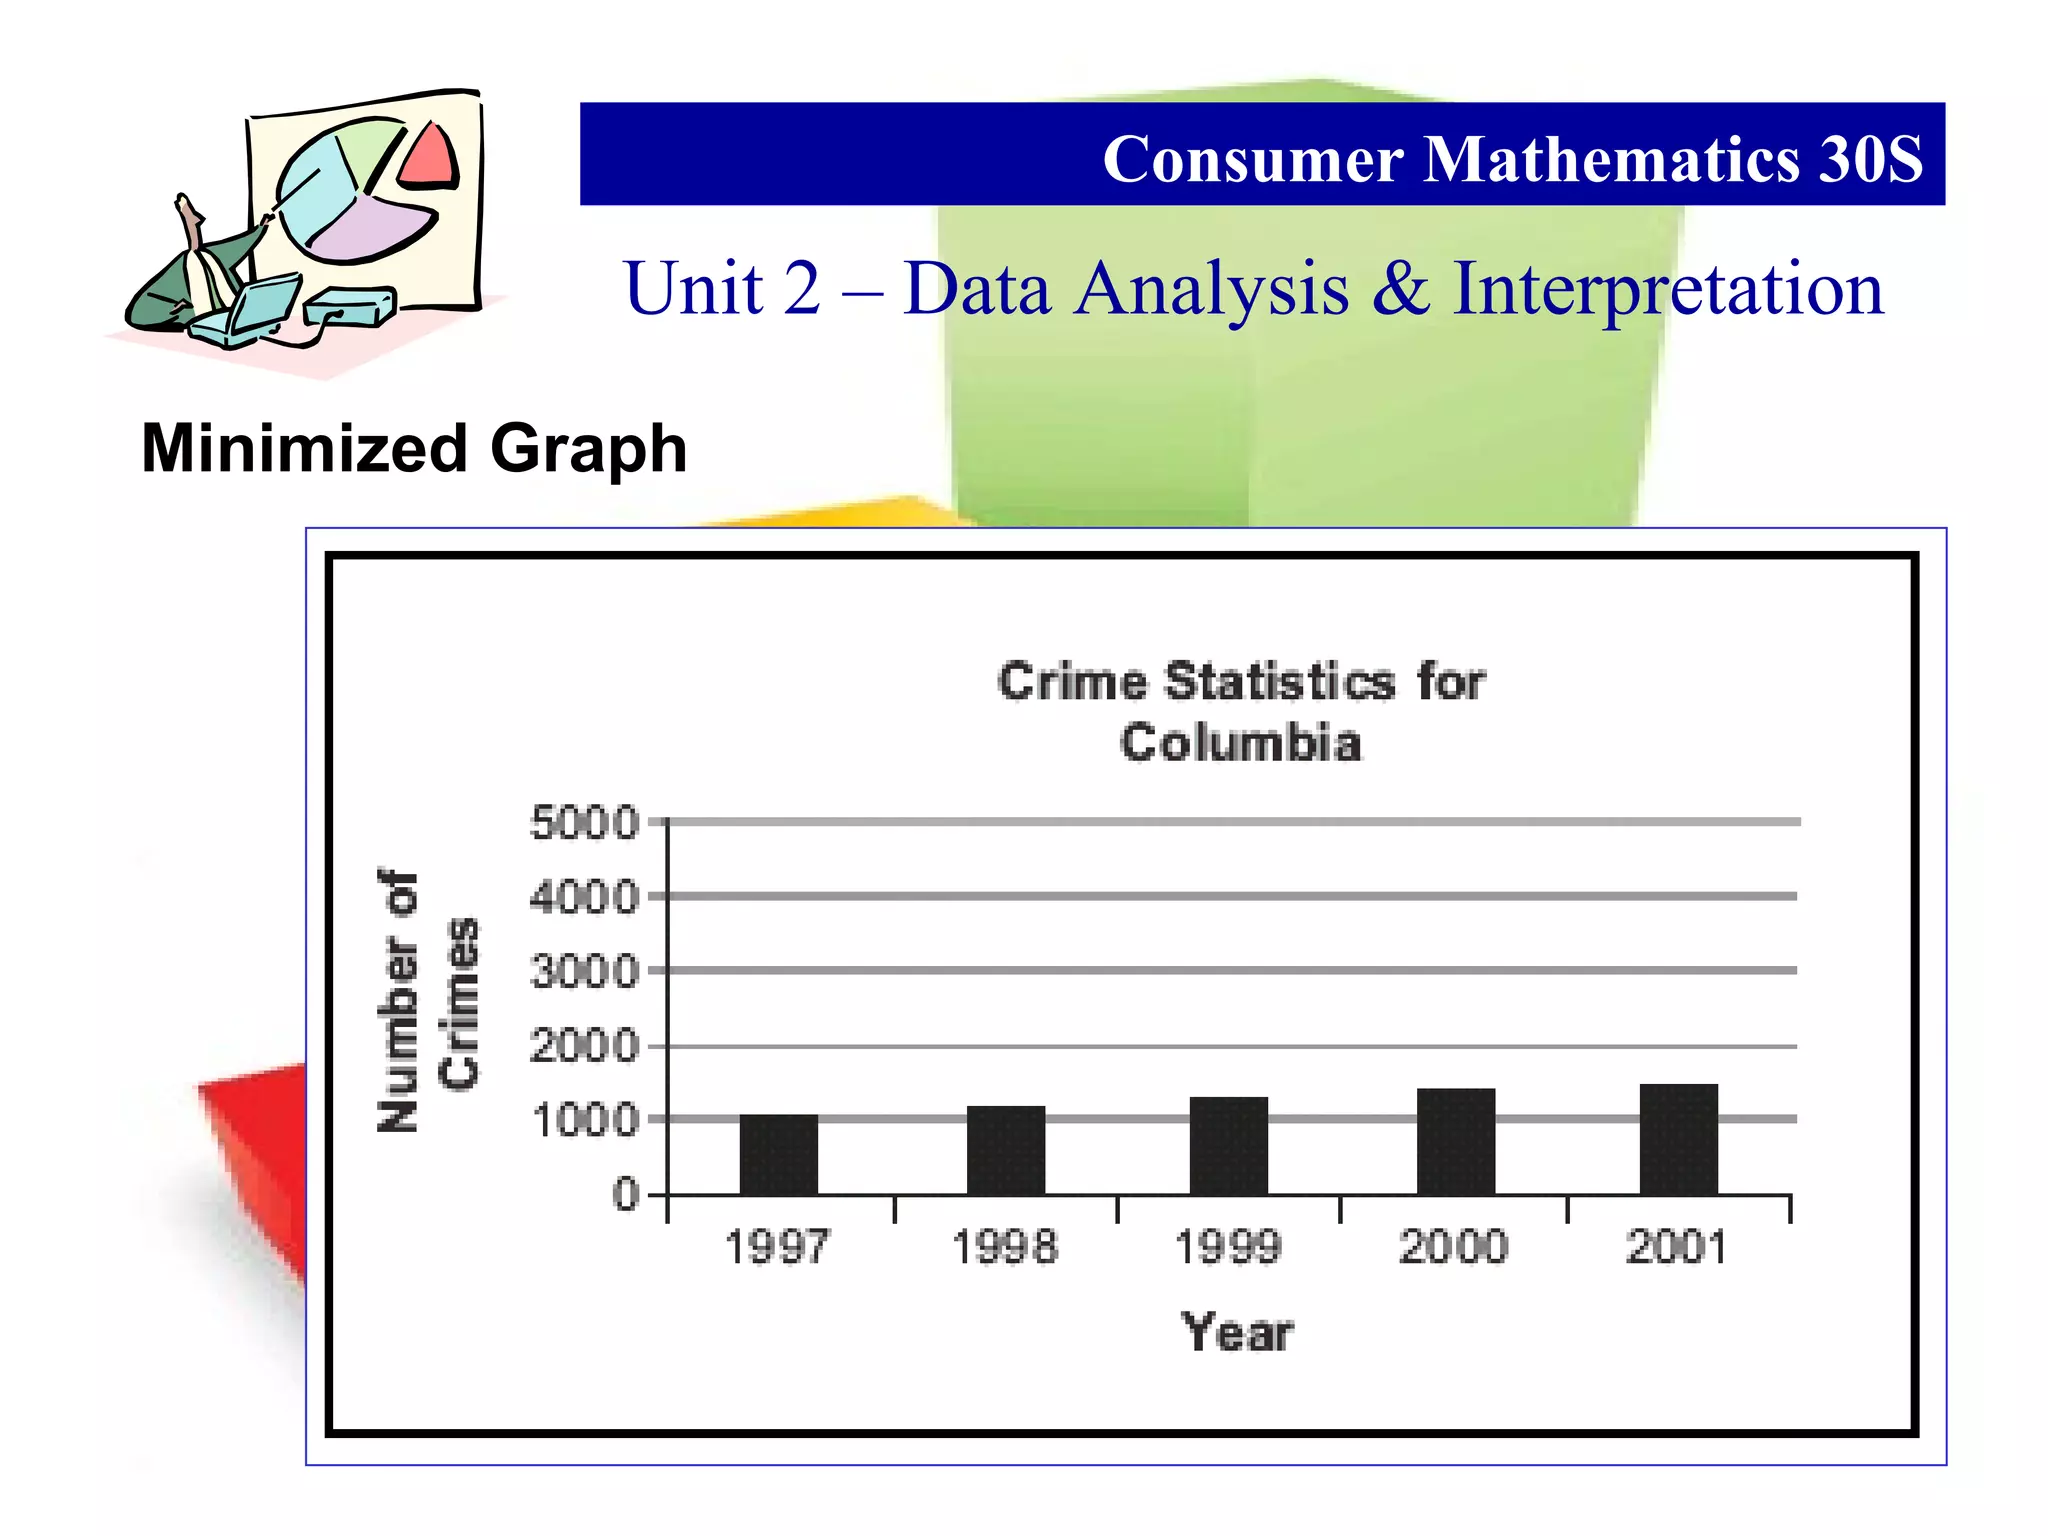
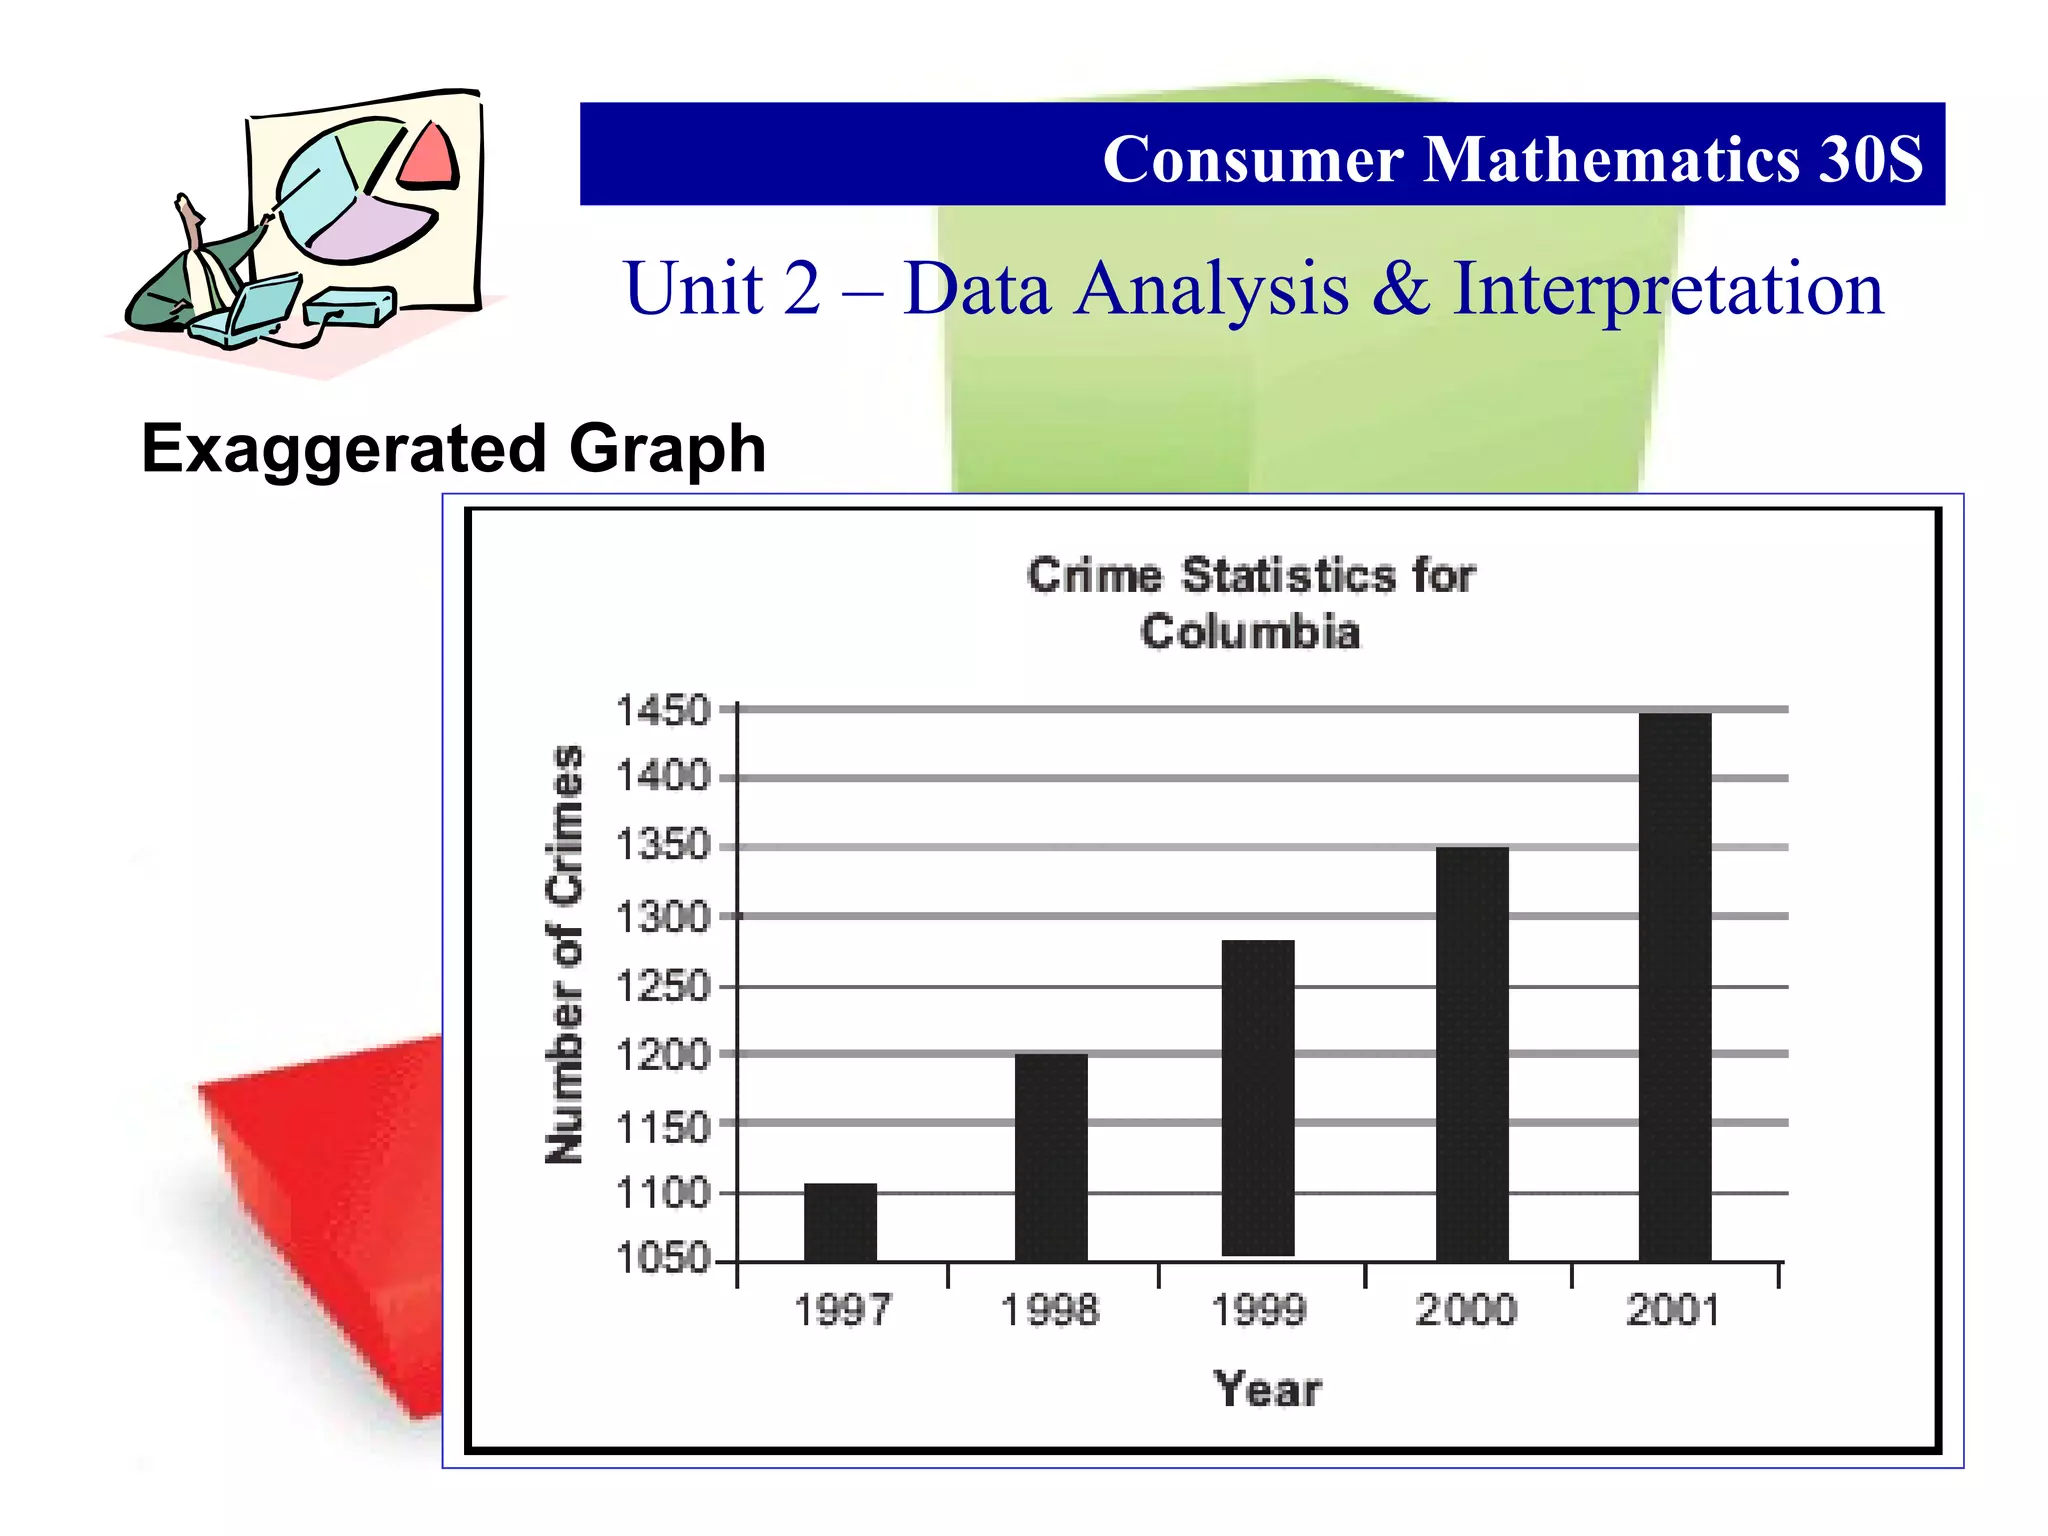


The document discusses using bar graphs to represent crime data from the town of Columbia over 5 years. It explains how bar graphs can be manipulated by changing the scale or starting point to either minimize or exaggerate differences in the data. Three example graphs are shown - a normal graph and one graph each that minimizes and exaggerates the differences. The chief of police is asked to choose a graph for a town council presentation and explain the choice.


