Download as PDF, PPTX

![Cell-based Operations
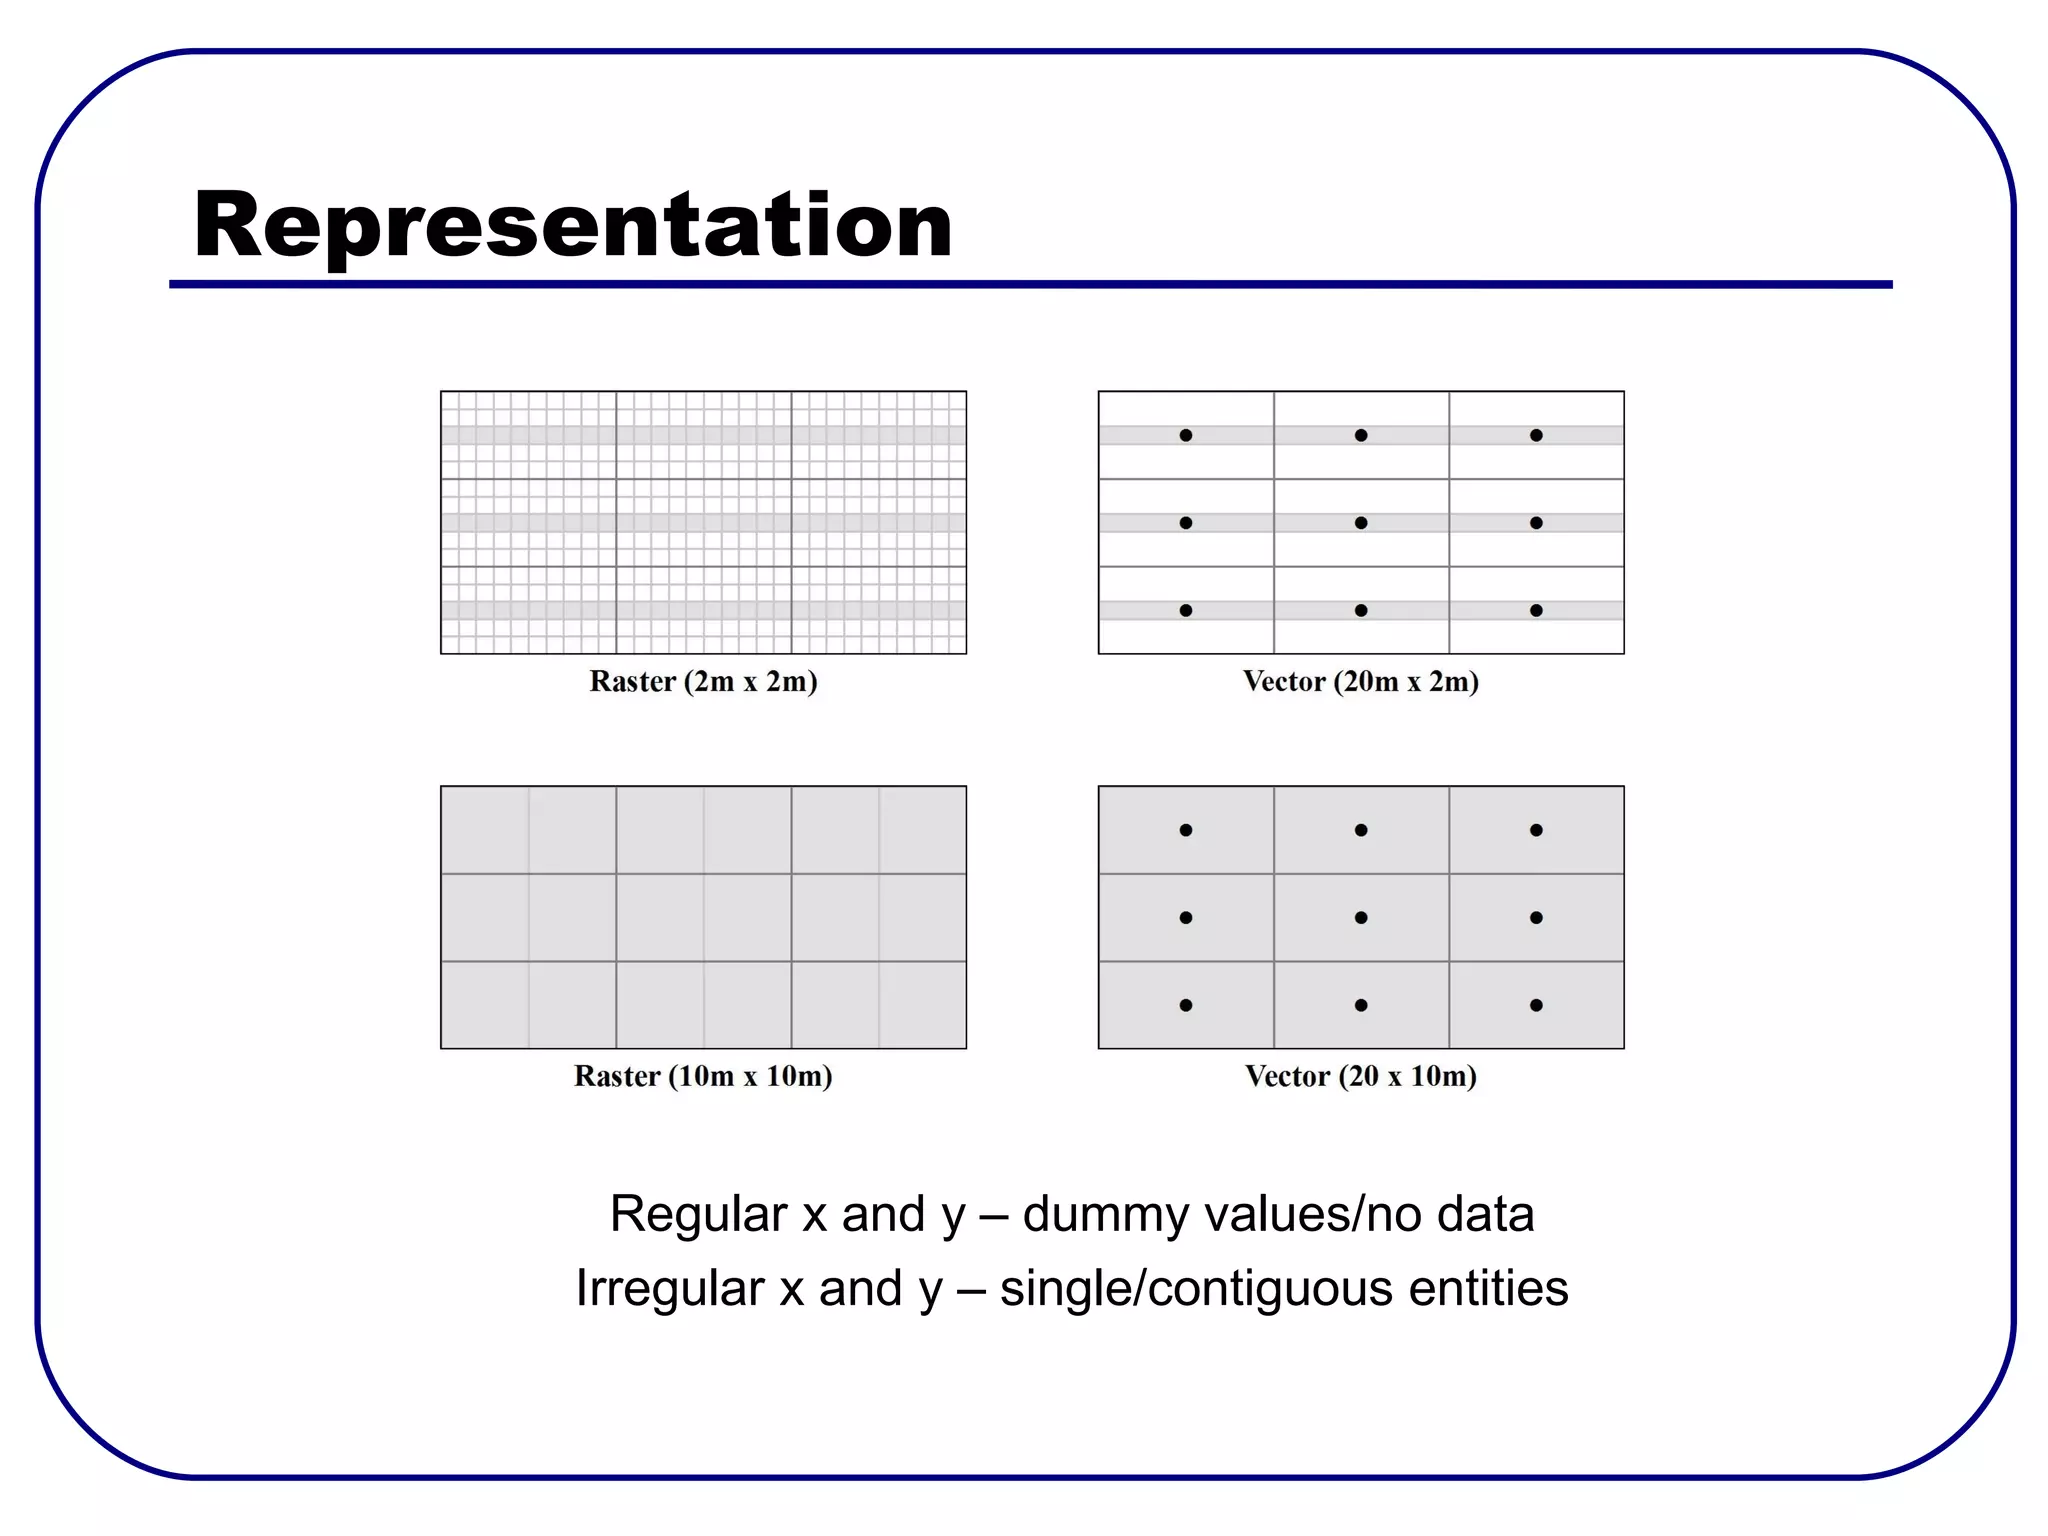
● Raster datasets 1 2 3 4 5
Regular configuration of cells,
6 7 8 9 10
each cell has the same:
a) Geometric properties 11 12 13 14 15
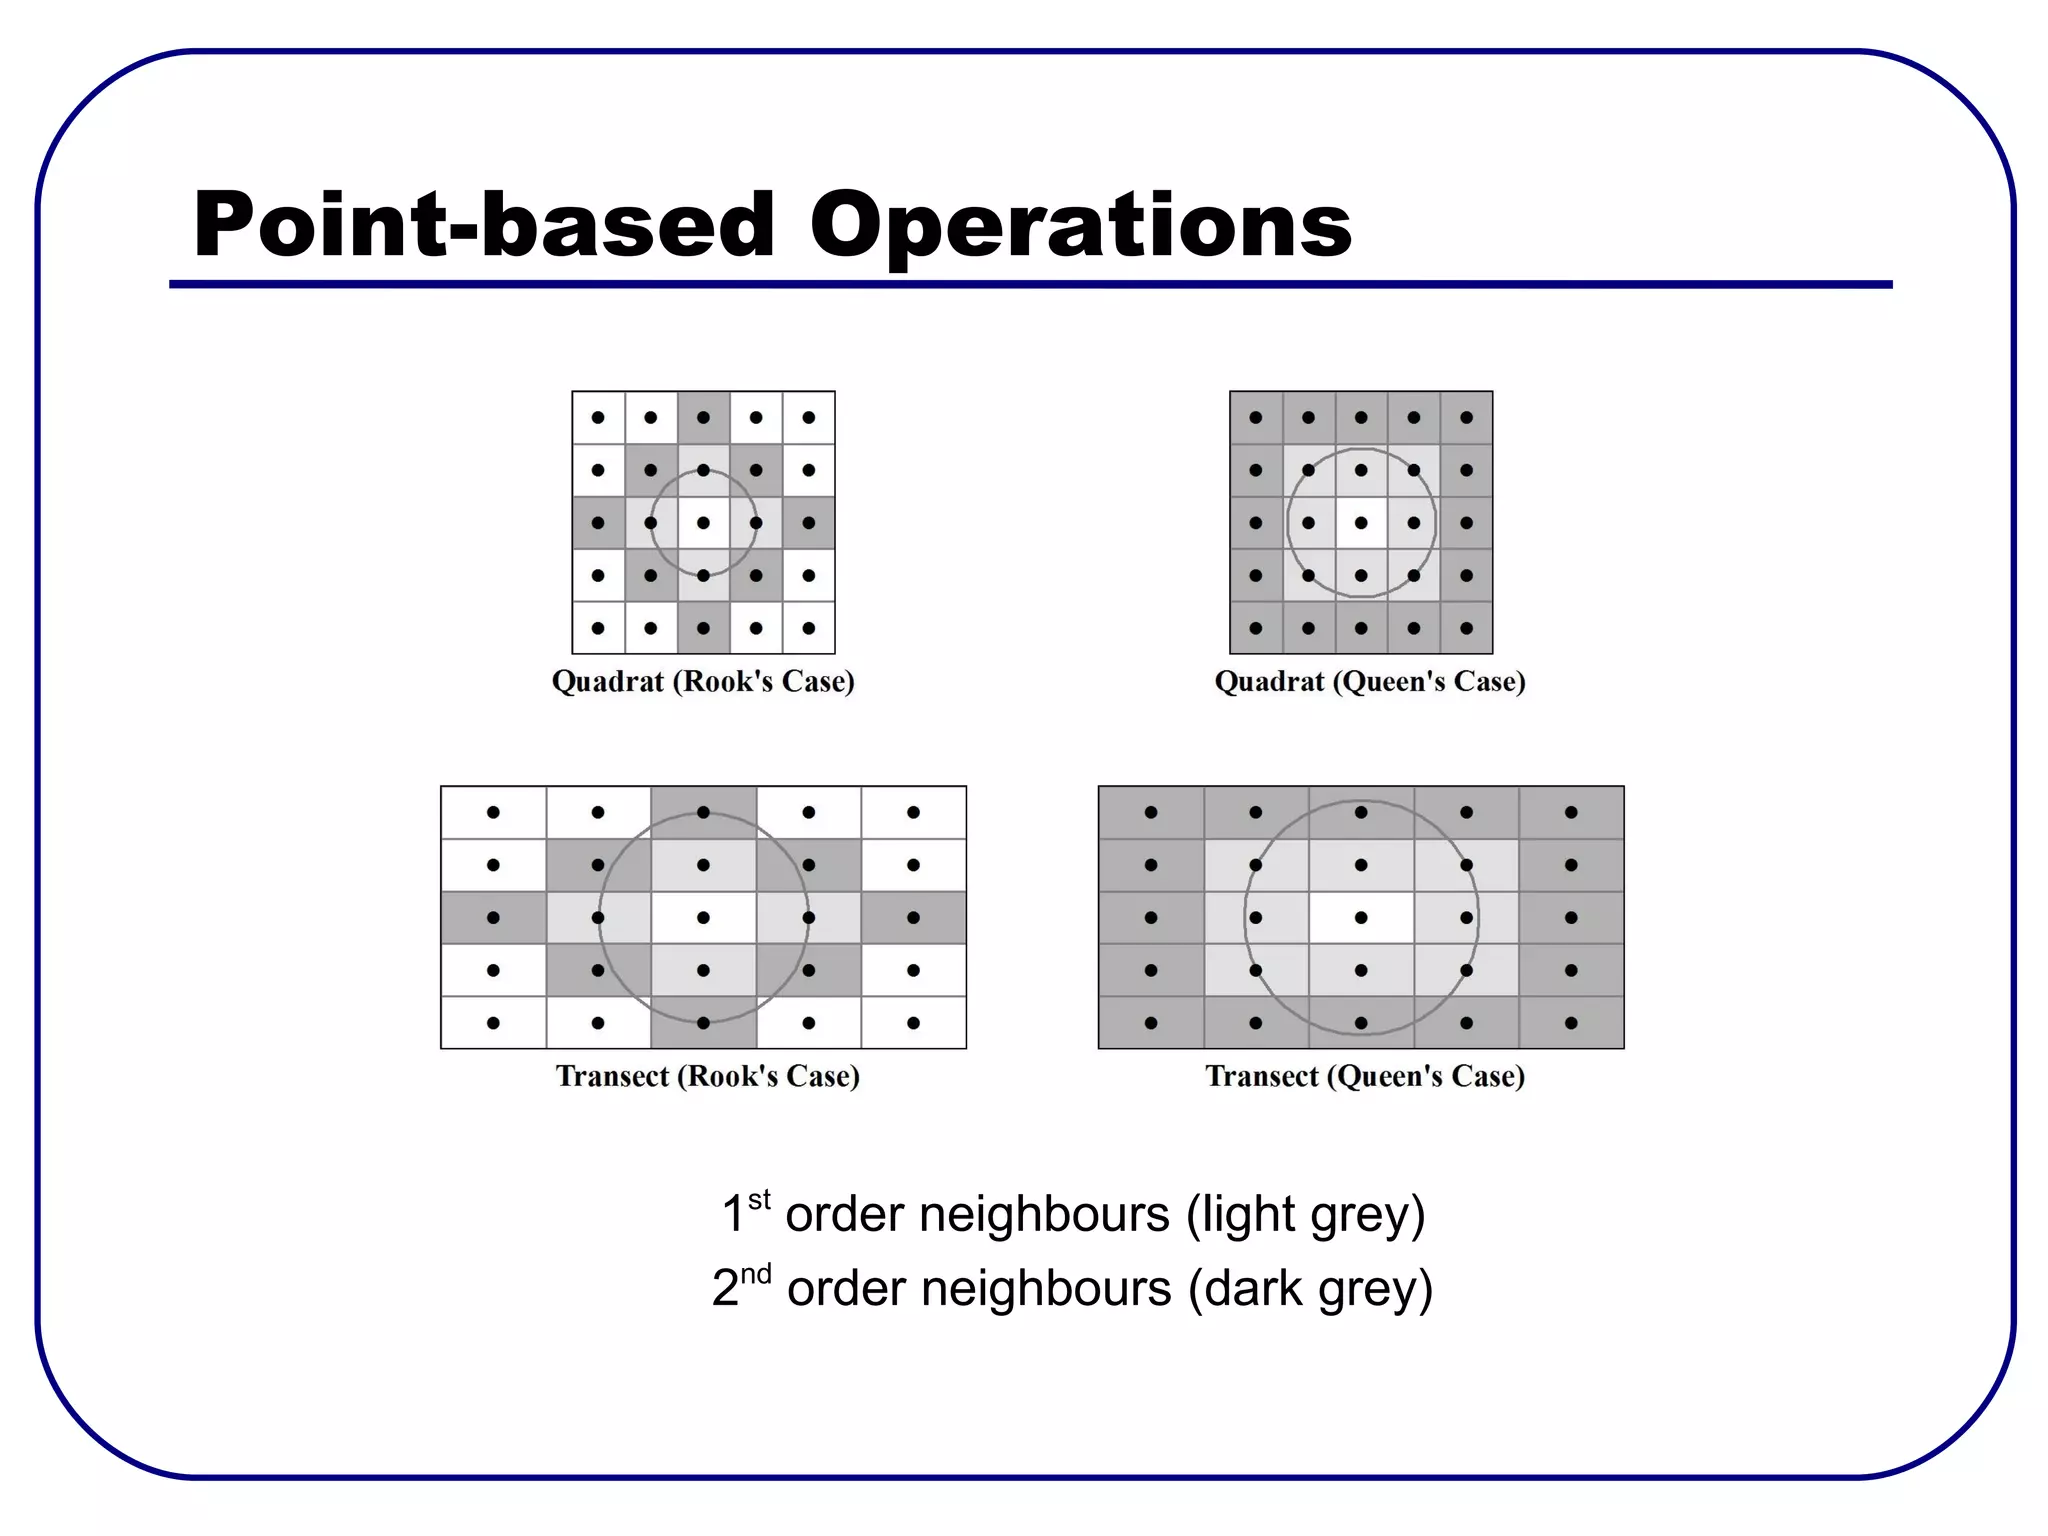
b) Number of neighbours
16 17 18 19 20
Robust syntax for map algebra
based on: 21 22 23 24 25
a) Row/column offsets [r,c]
b) Kernels (0/1 or weighted)](https://image.slidesharecdn.com/caa2011pouncettgowans-110418145622-phpapp02/75/Highs-and-Lows-A-Resel-based-Approach-to-the-Analysis-of-Data-from-Geophysical-and-Surface-11-2048.jpg)
![Adjacency
● 1st Order Neighbours ● 2nd Order Neighbours
Neighbours of cell 13 Neighbours of 1st neighbours
ID FID NID Weight # Neighbours
1 13 7 0 7 1 2 3 6 8 11 12 13
2 13 8 10 8 2 3 4 7 9 12 13 14
3 13 9 0 9 3 4 5 8 10 13 14 15
4 13 12 10 12 6 7 8 11 13 16 17 18
5 13 14 10 14 8 9 10 13 15 18 19 20
6 13 17 0 17 11 12 13 16 18 21 22 23
7 13 18 10 18 12 13 14 17 19 22 23 24
8 13 19 0 19 13 14 15 18 20 23 24 25
0 = Queen's case Remove duplicates
10 = Rook's case [Remove lower orders]](https://image.slidesharecdn.com/caa2011pouncettgowans-110418145622-phpapp02/75/Highs-and-Lows-A-Resel-based-Approach-to-the-Analysis-of-Data-from-Geophysical-and-Surface-15-2048.jpg)
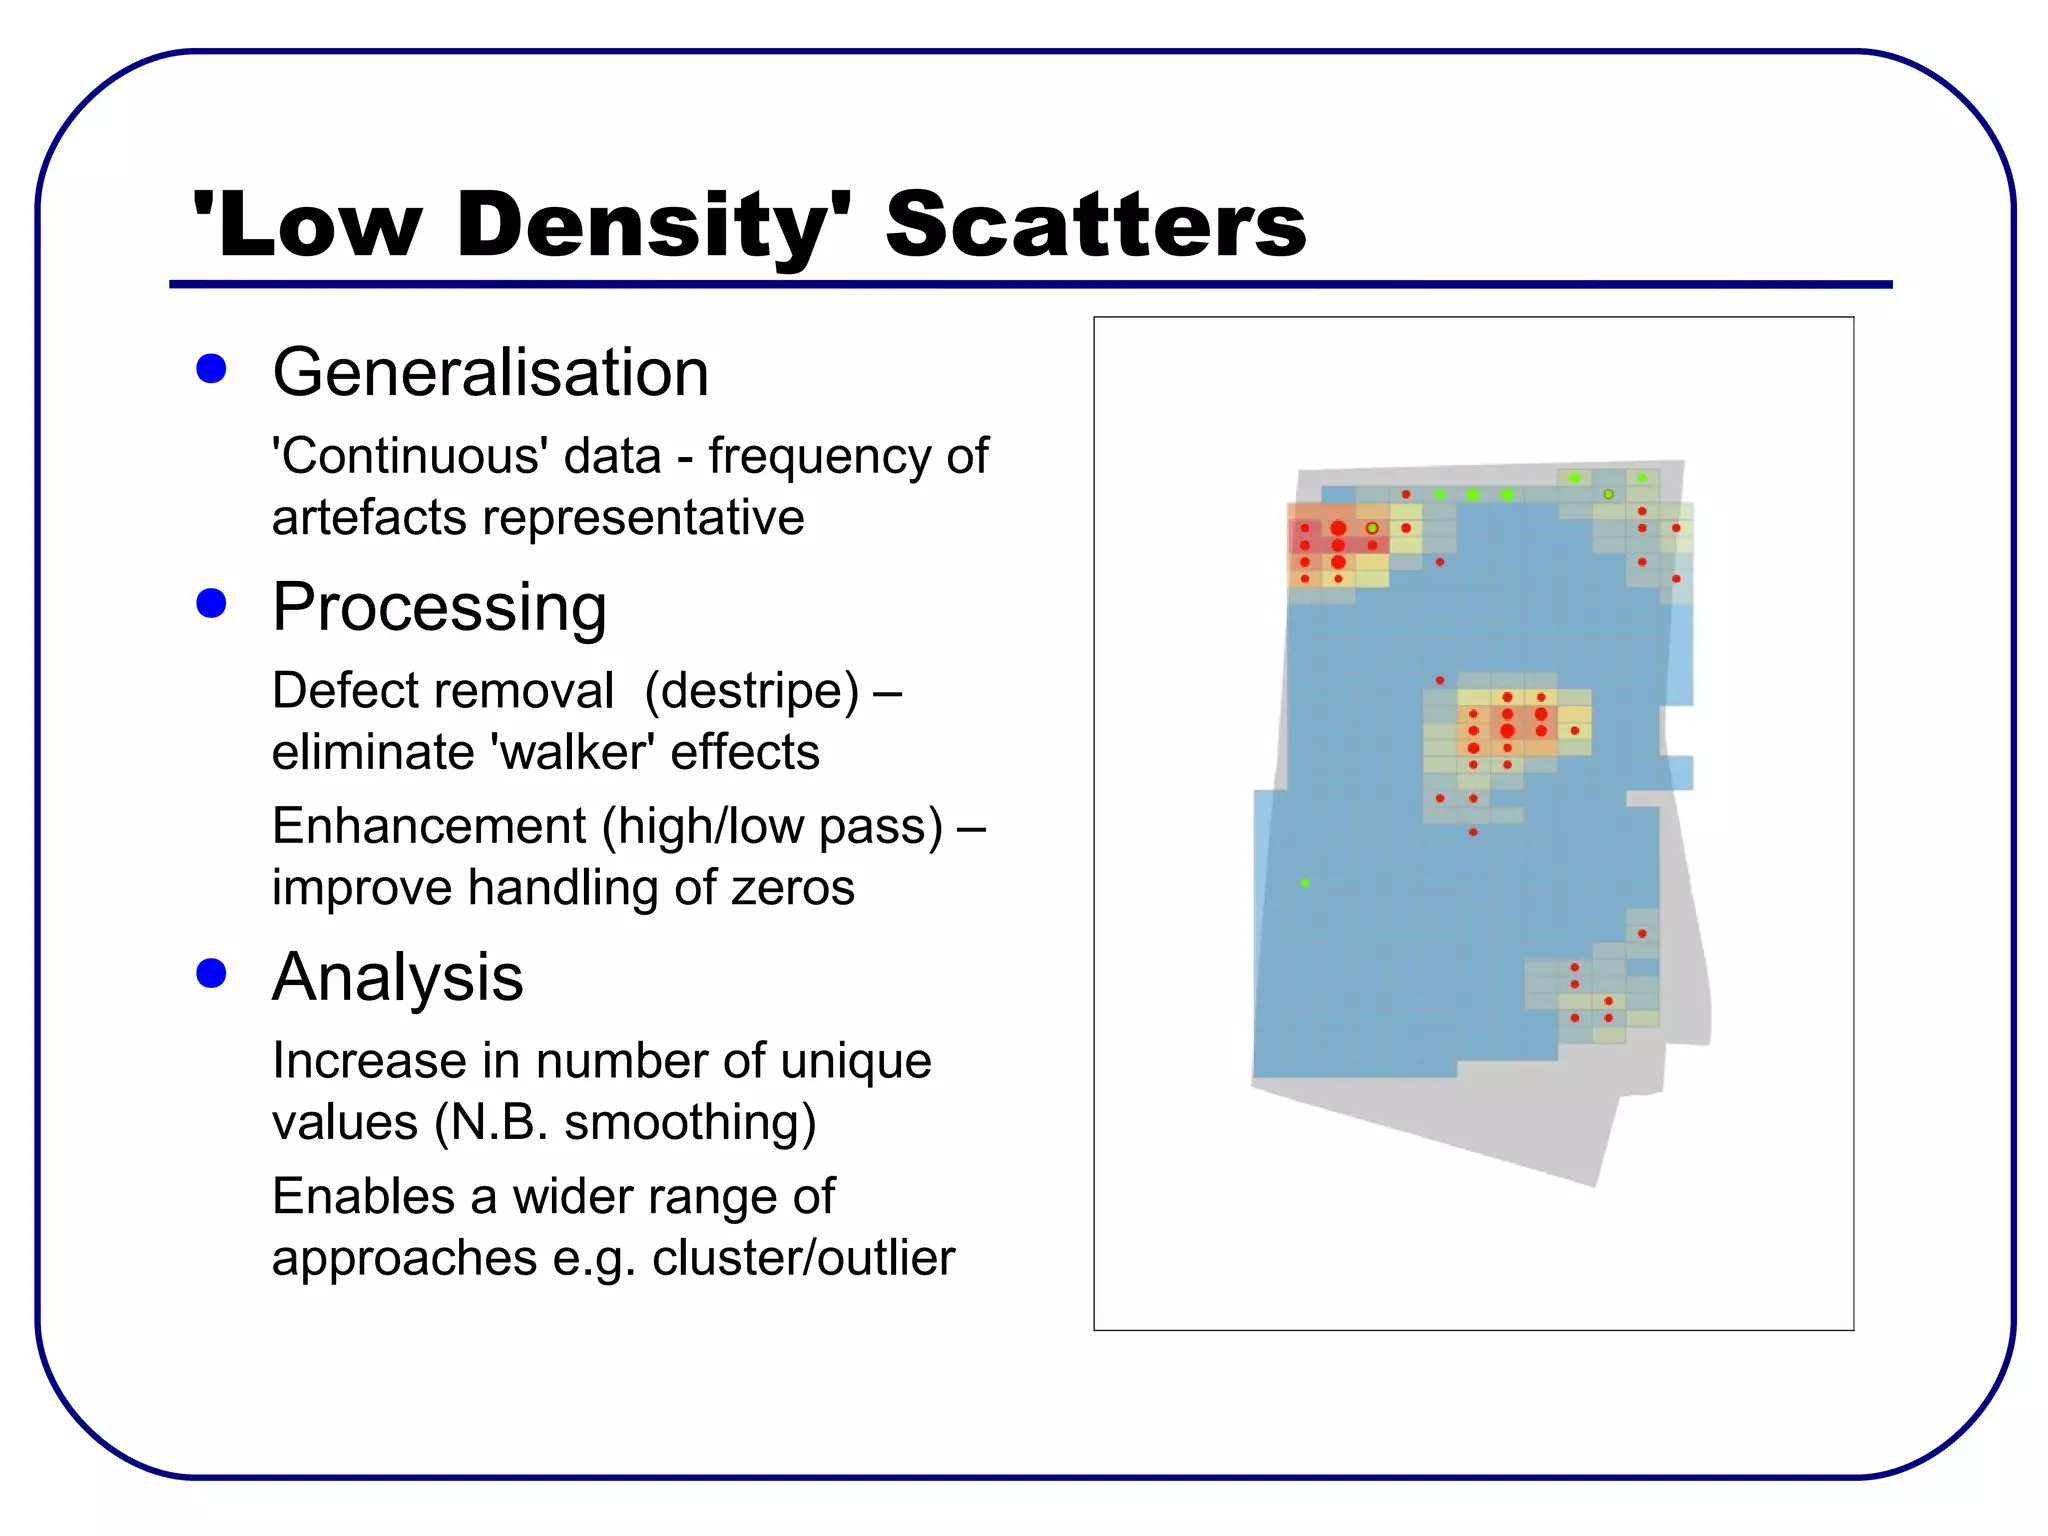

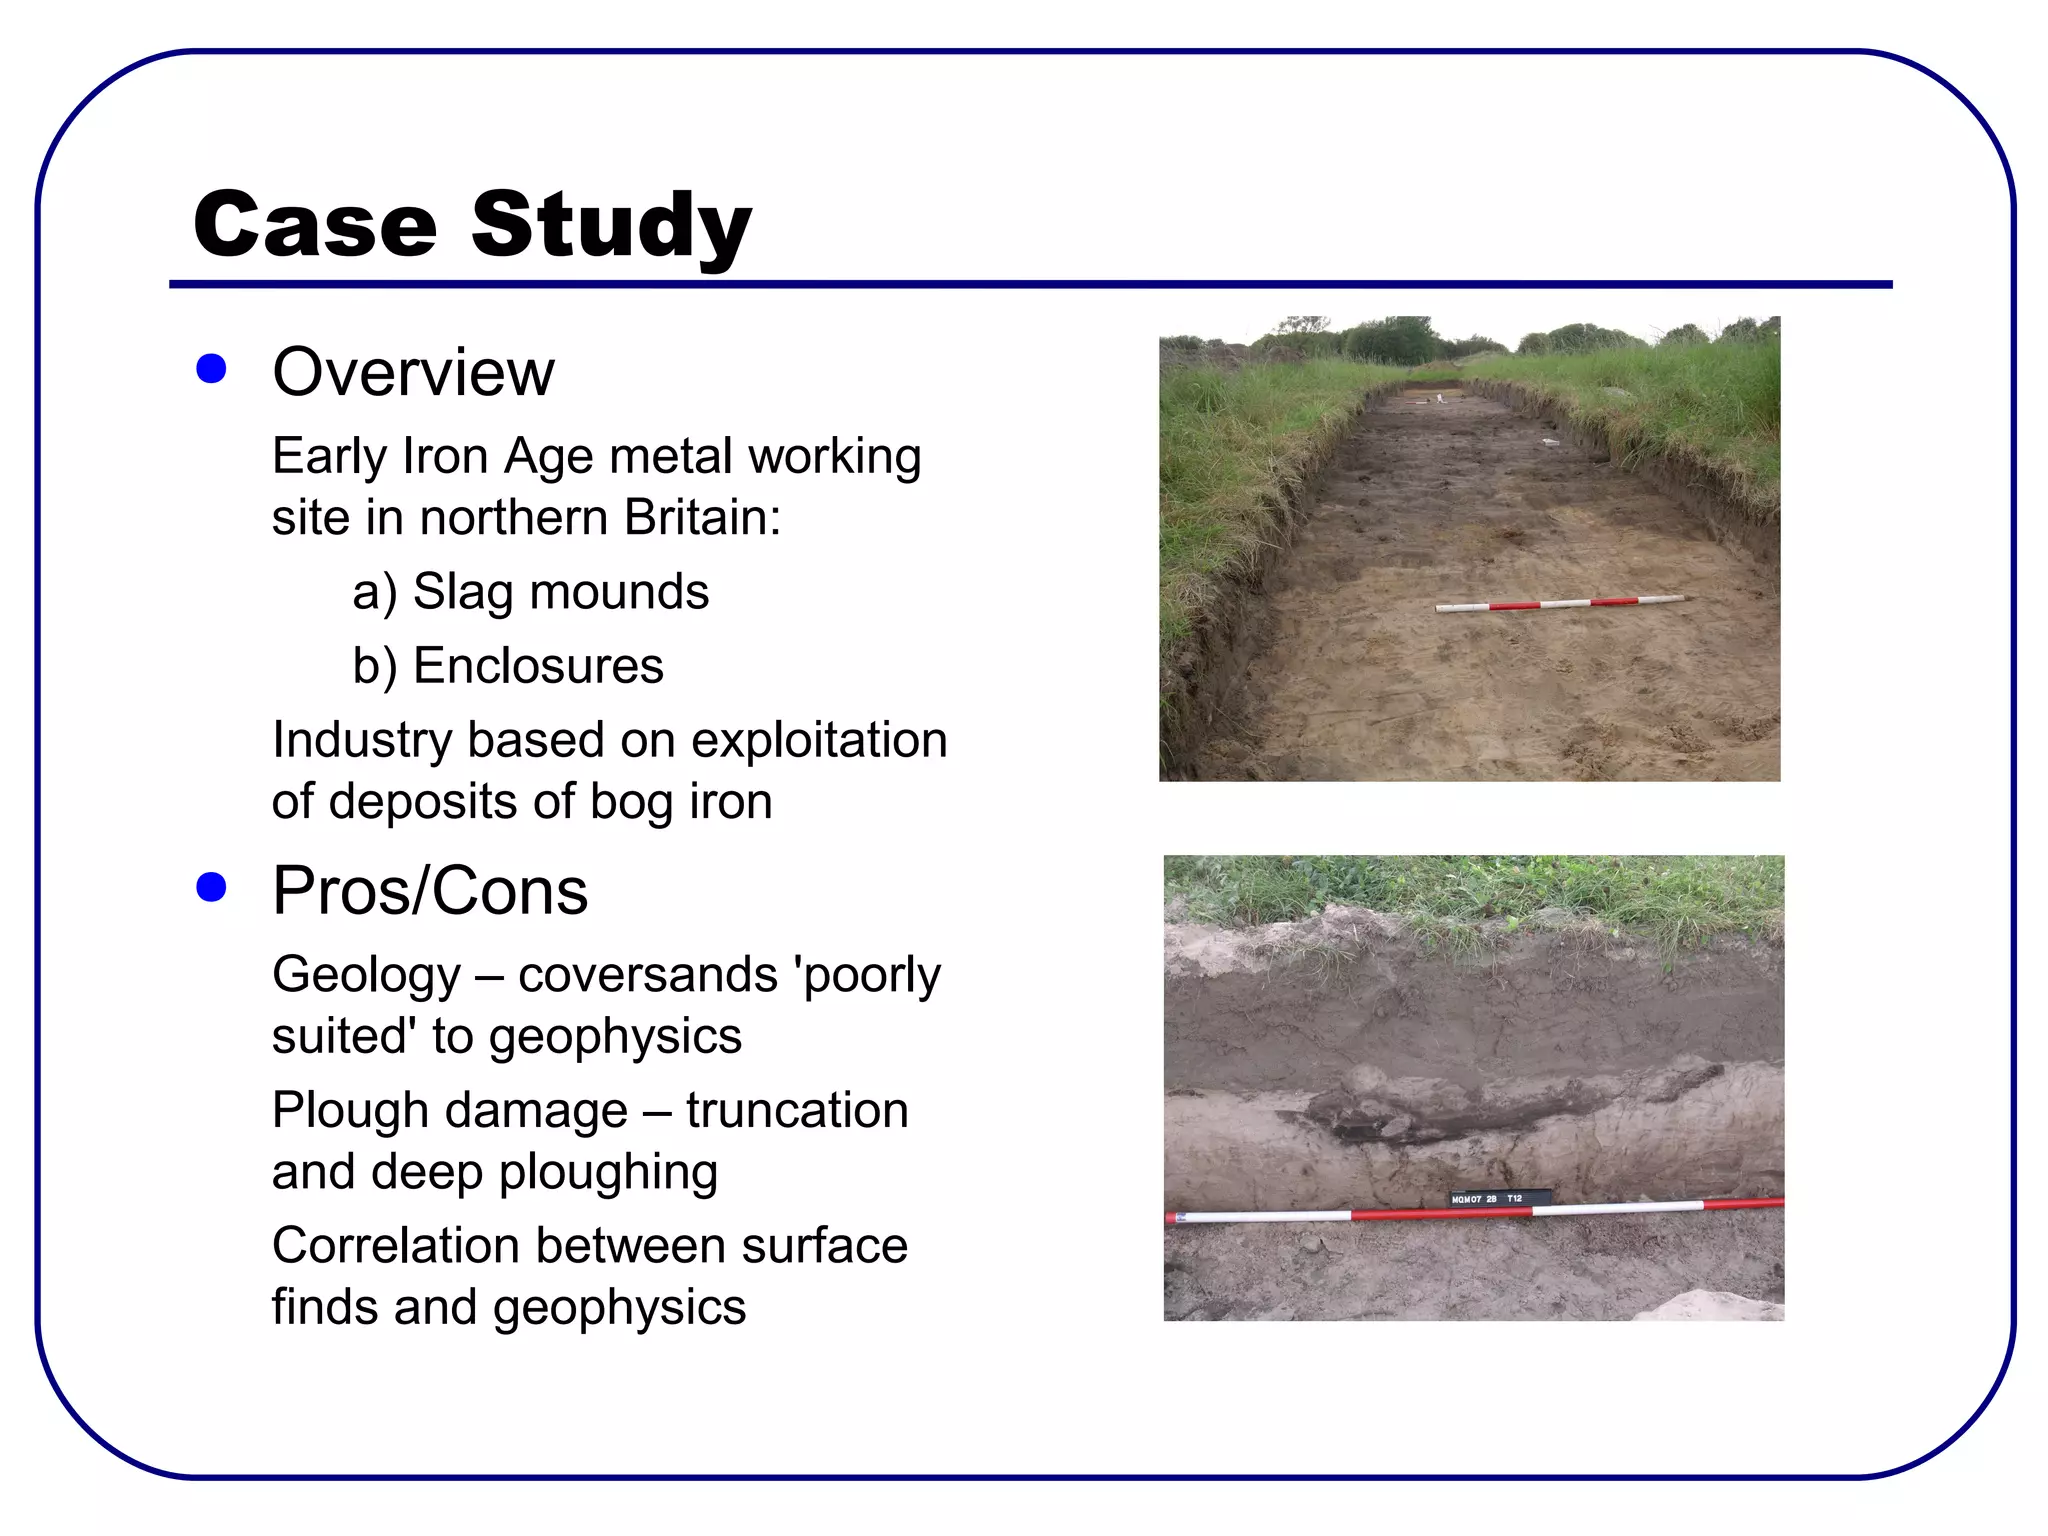
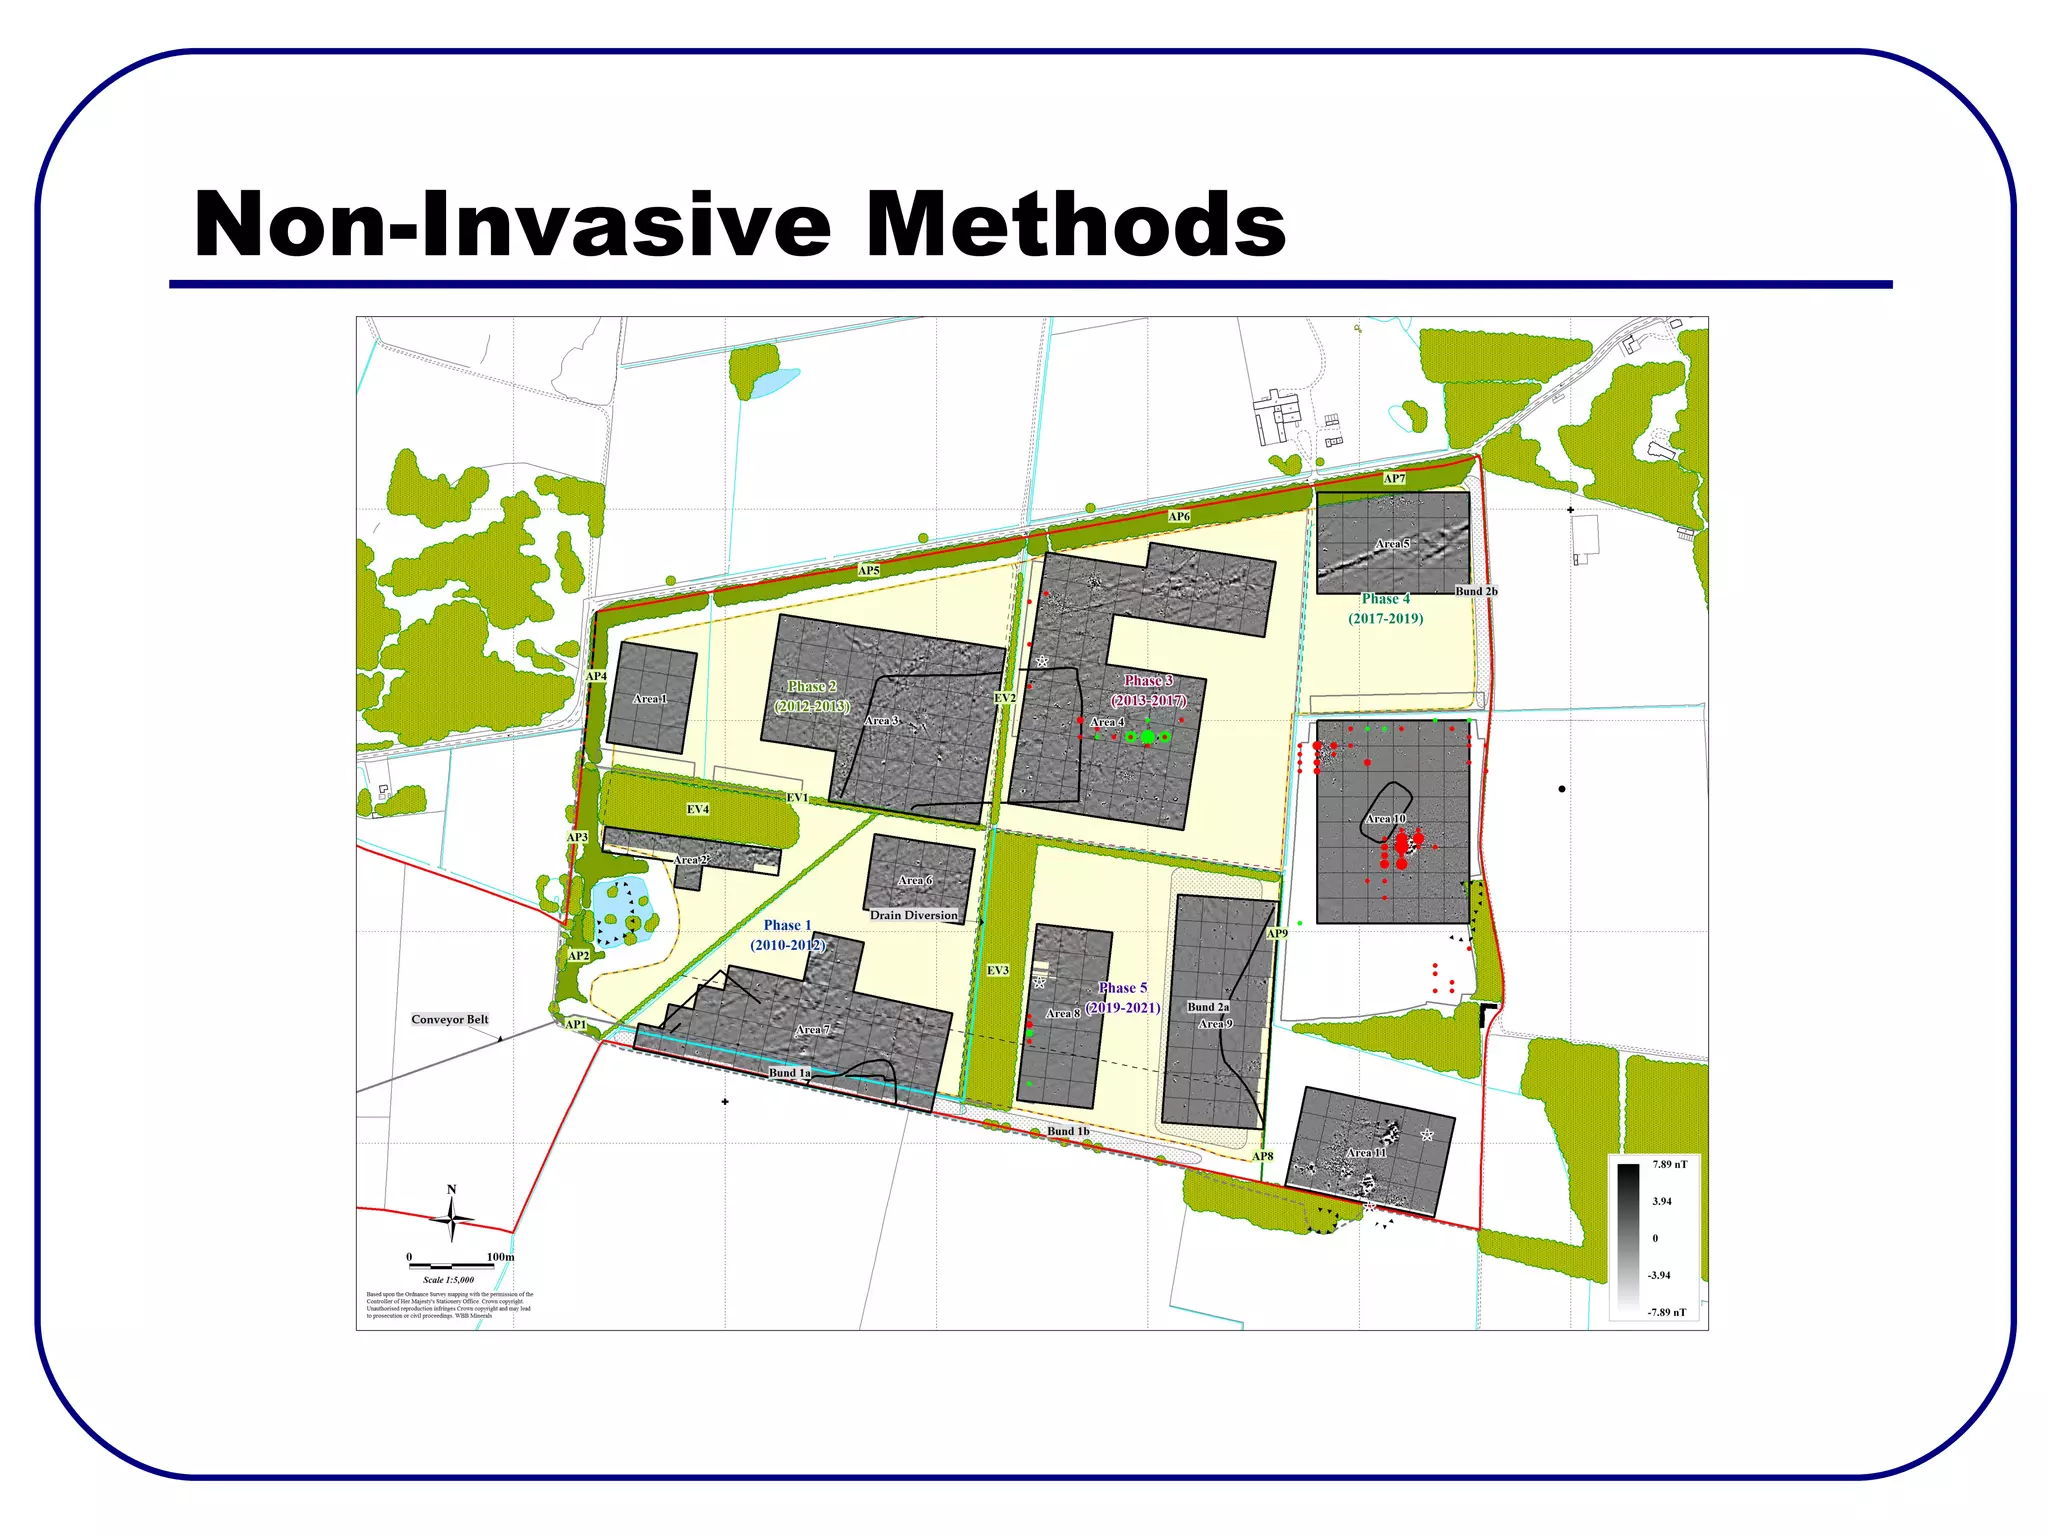
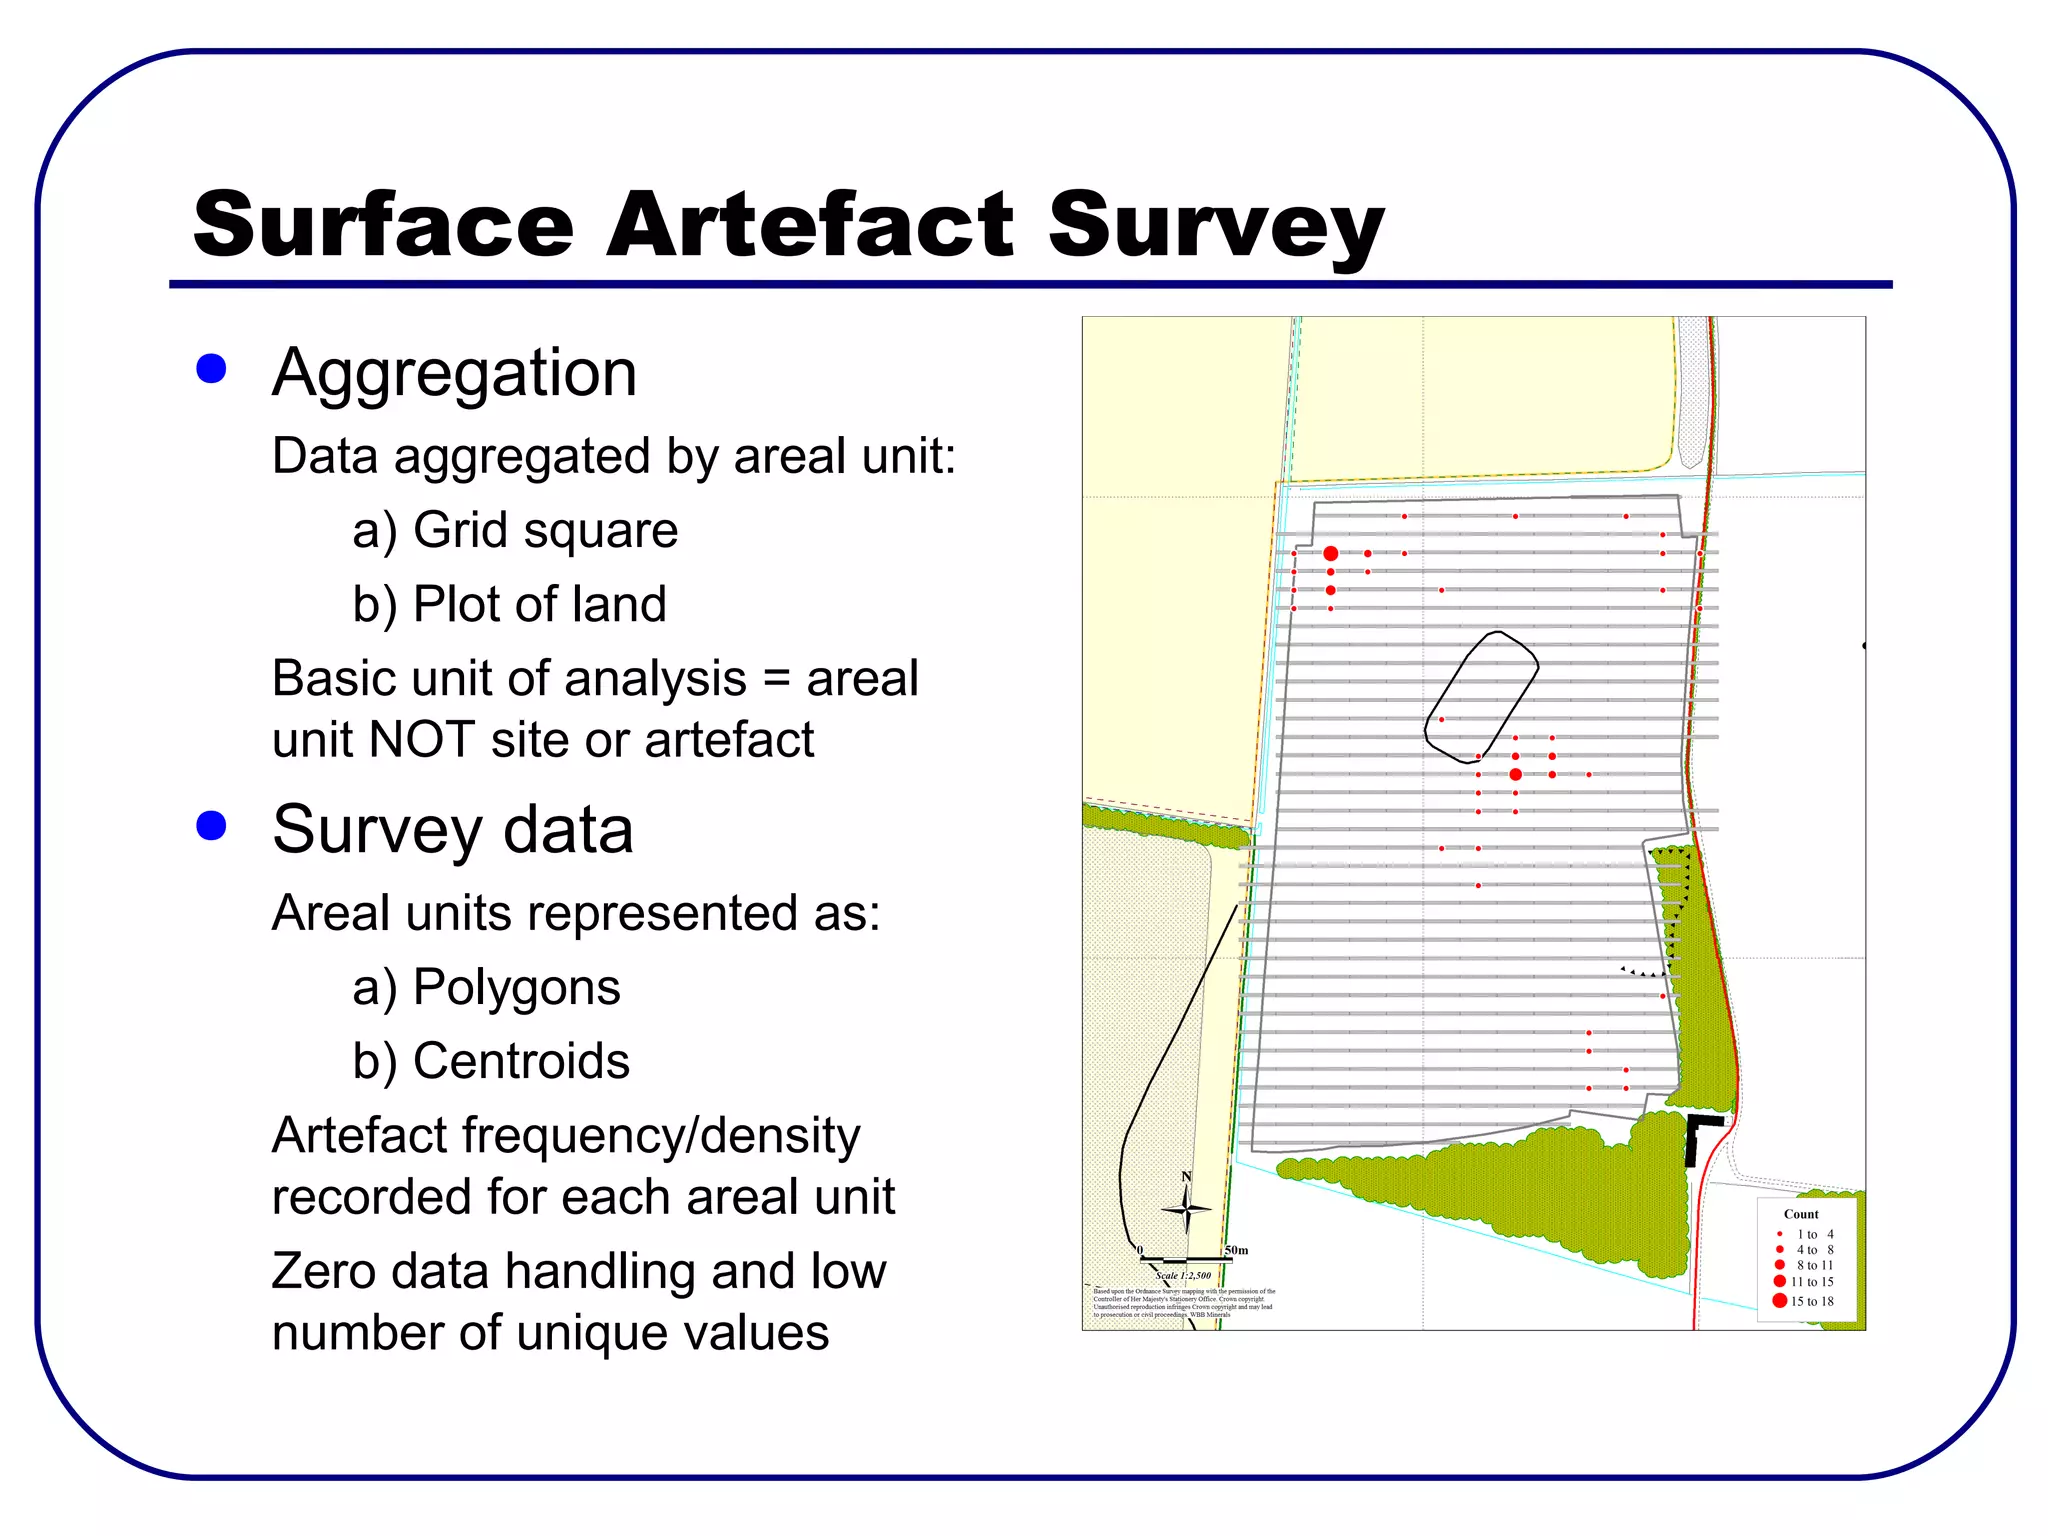
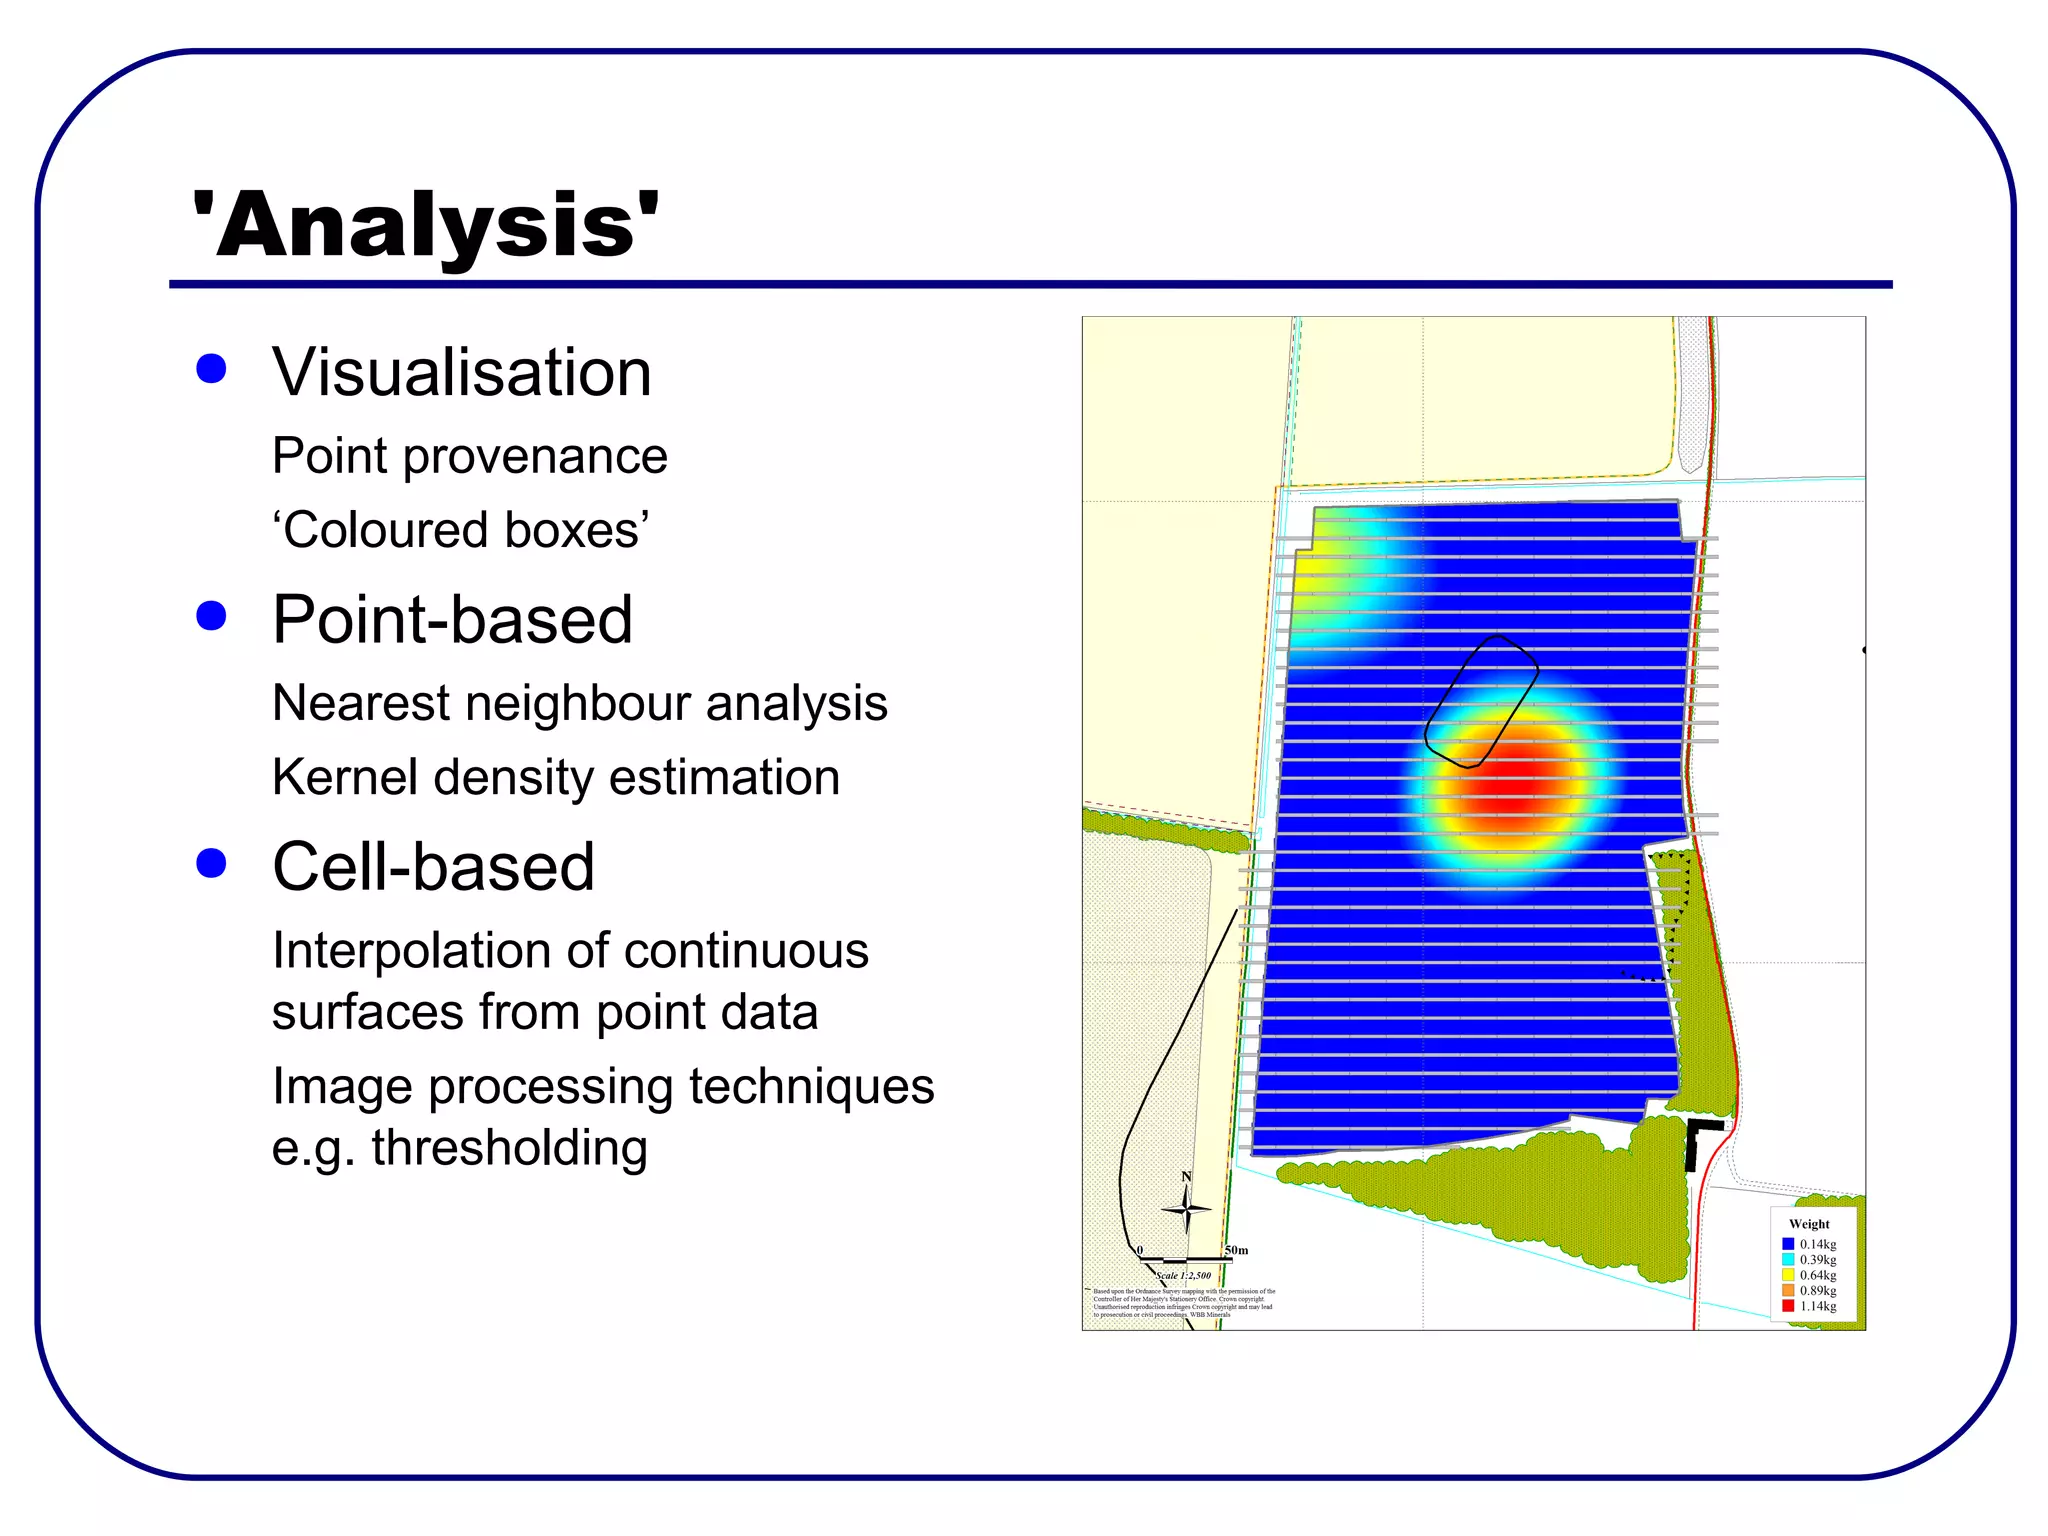
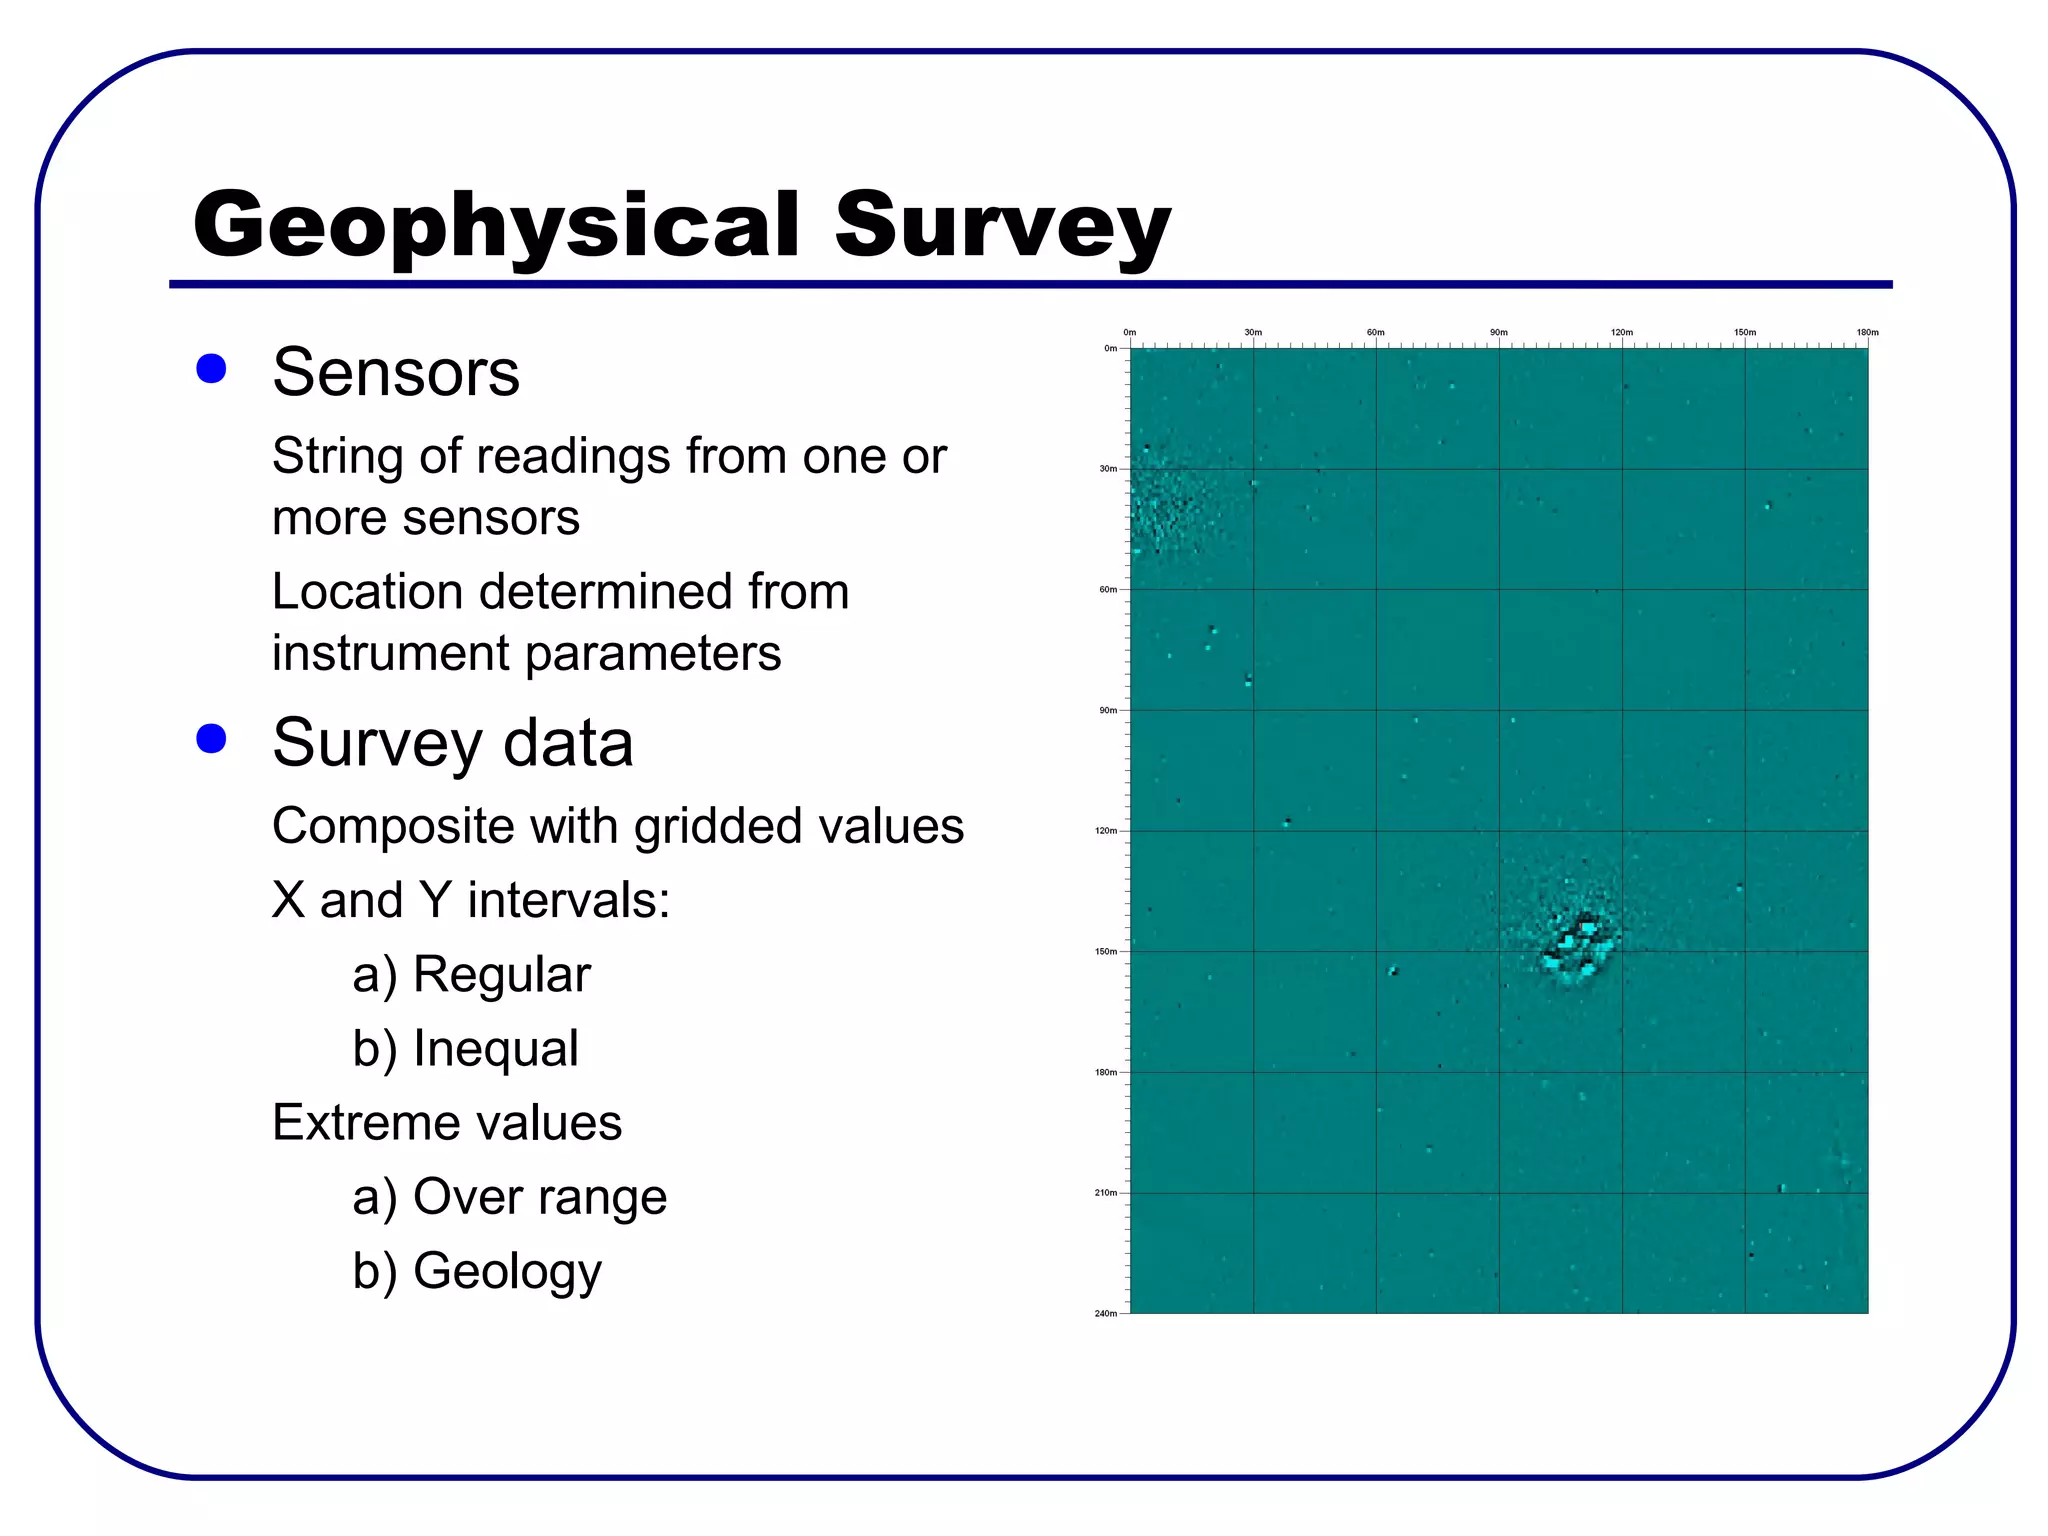
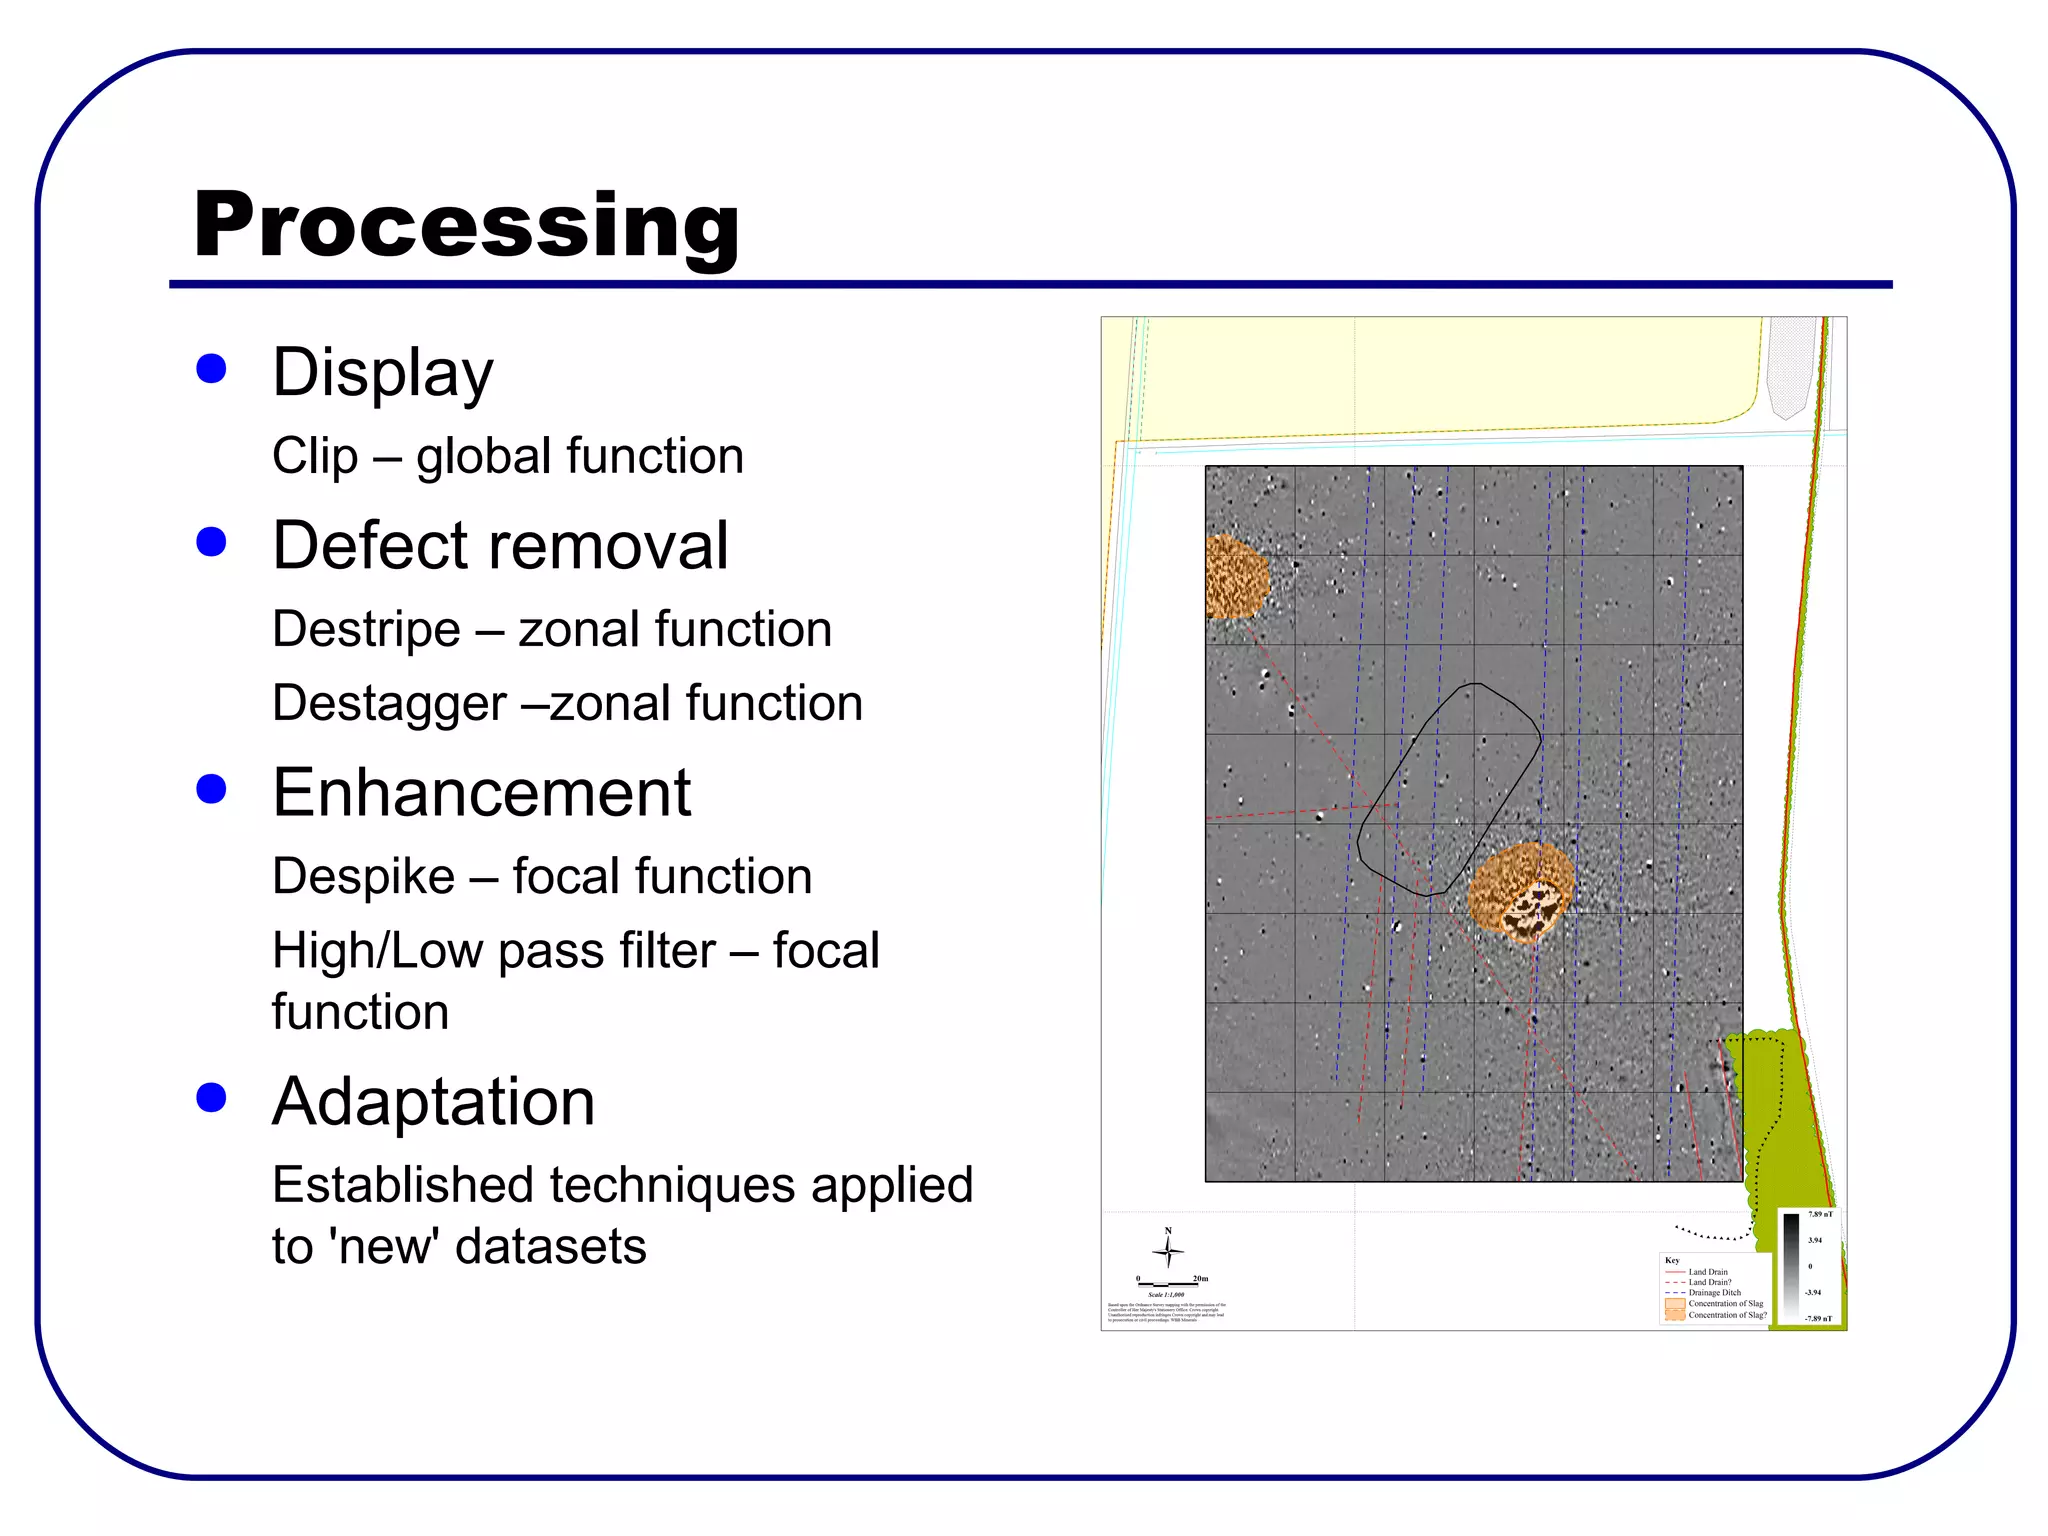
This paper presents a resel-based approach to analyzing data from geophysical and surface artifact surveys, emphasizing the application of various processing and analysis techniques. It discusses a case study on an Early Iron Age metalworking site in Northern Britain, detailing the challenges and methods used to correlate surface finds with geophysical data. Furthermore, it highlights established processing techniques adaptable to different datasets, ensuring comprehensive analysis regardless of data structure or configuration.


