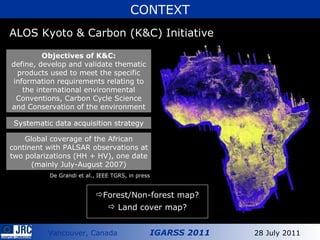
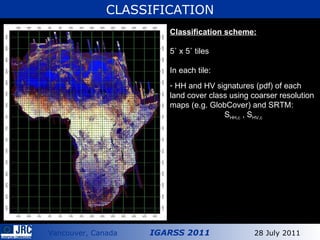
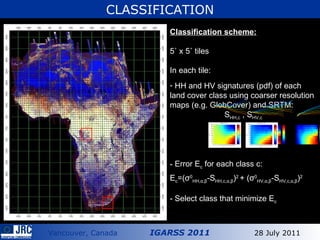
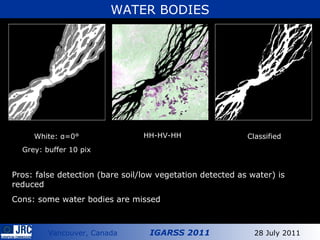
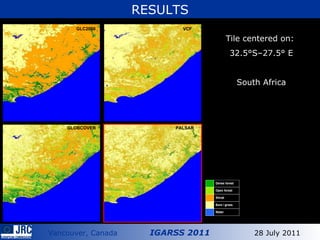
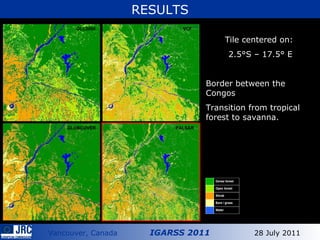
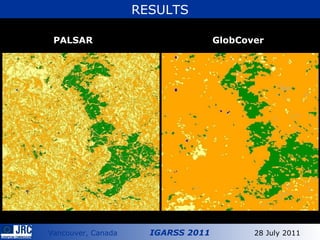
1) A land cover map of Africa was created at 100m resolution using dual-polarization ALOS PALSAR data from 2007.
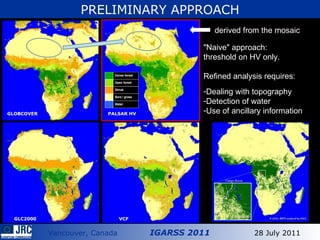
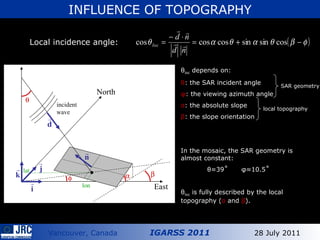
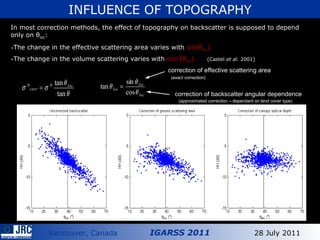
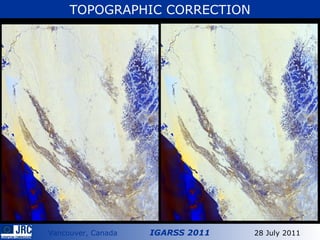
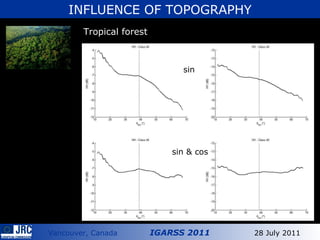
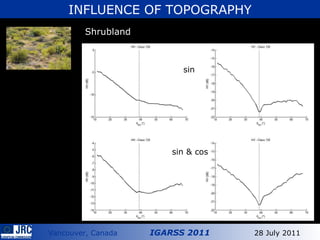
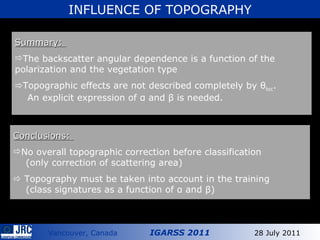
2) A preliminary approach used HV backscatter thresholds but a refined analysis considered topography, water detection, and ancillary data.
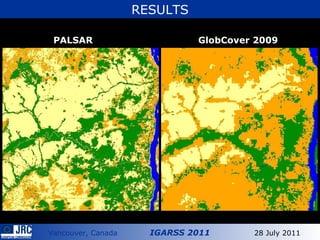
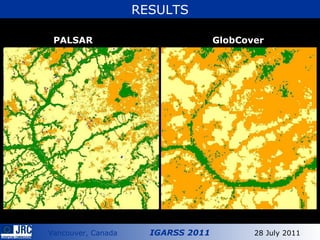
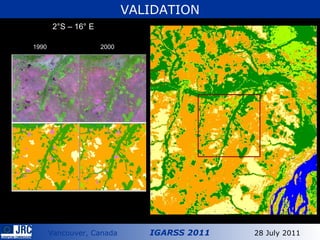
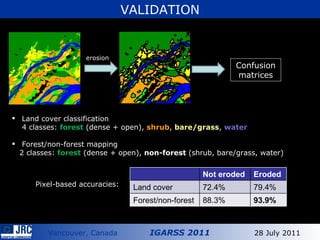
3) The map was validated against other datasets with an accuracy of 72.4% for land cover classes and 88.3% for forest/non-forest.
![A land cover map of Africa at 100m using a mosaic of ALOS PALSAR dual-polarization data - Preliminary developments - Alexandre Bouvet, Gianfranco De Grandi European Commission DG Joint Research Centre 21027, Ispra (VA), Italy e-mail: [email_address]](https://image.slidesharecdn.com/bouvet-igarss2011-110728105351-phpapp02/85/Bouvet_IGARSS2011-ppt-1-320.jpg)
![A land cover map of Africa at 100m using a mosaic of ALOS PALSAR dual-polarization data - Preliminary developments - Alexandre Bouvet, Gianfranco De Grandi European Commission DG Joint Research Centre 21027, Ispra (VA), Italy e-mail: [email_address]](https://image.slidesharecdn.com/bouvet-igarss2011-110728105351-phpapp02/75/Bouvet_IGARSS2011-ppt-1-2048.jpg)