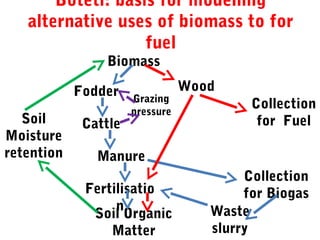
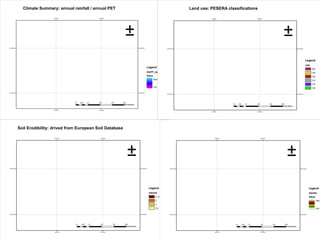
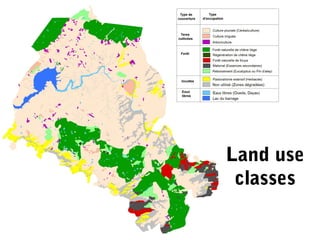
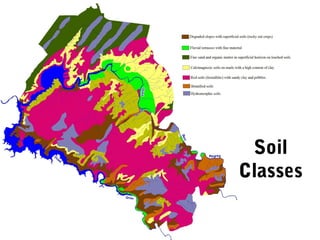
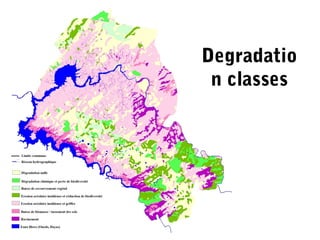
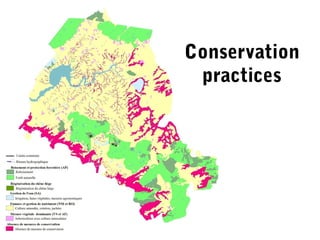
This document discusses using the PESERA model to analyze soil erosion in various locations:
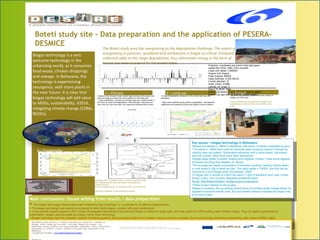
1) In Portugal, the PESERA model results matched fieldwork showing low erosion in mature forests but higher erosion in areas disturbed by wildfires. Prescribed burning increased erosion slightly less than wildfires.
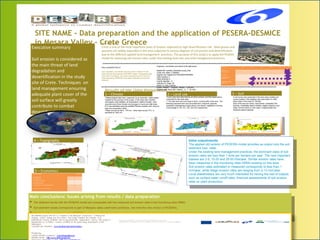
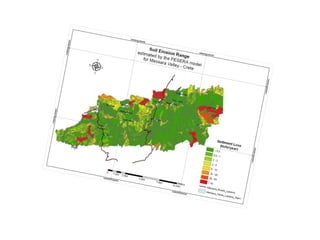
2) In Crete, Greece, PESERA results were comparable to measured erosion rates and reflected catchment conditions.
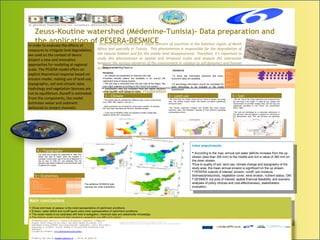
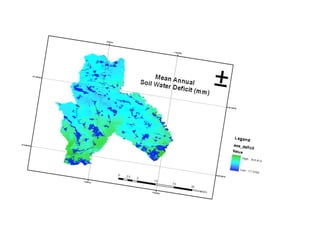
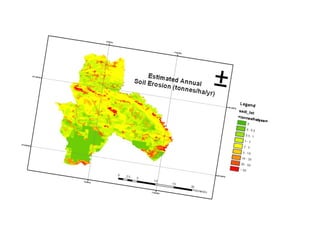
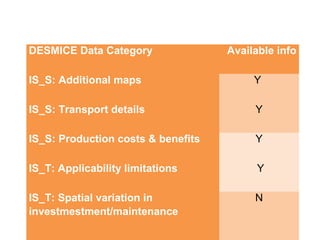
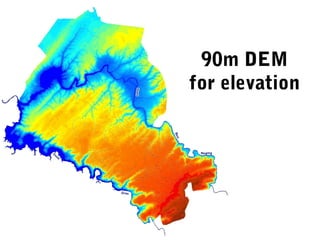
3) Data preparation for running PESERA in other locations, like Morocco and Russia, is discussed. Maps, soil data, and climate data were used as inputs to the model.


![27
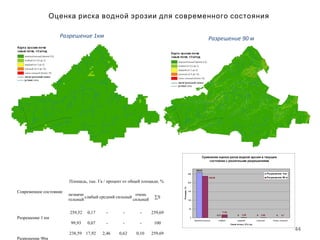
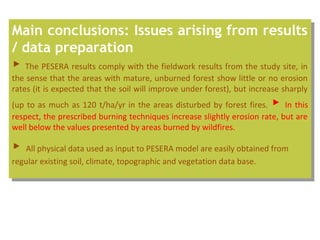
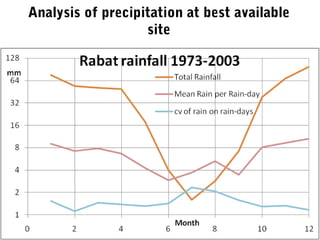
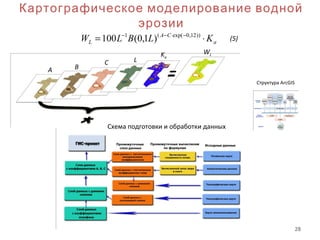
Водная эрозия
Виды эрозии по морфологическим признакам:
а) поверхностная плоскостная эрозия (во время
снеготаяния); б) поверхностная струйчатая эрозия;
в) линейная эрозия.
Эрозия почвы - совокупность взаимосвязанных процессов отрыва, переноса и
отложения почвы поверхностным стоком временных водных потоков и ветром.
a
CA
L KLBLW ⋅= −⋅−− ))12,0exp((1
)1,0(100
Уравнение для определения смыва почв талыми водами
(по Г. А. Ларионову), т/га/год
N
PhB =
Z
ThSA )( +=
)( h
MeR
FhC
−
−
=
WL – смыв почвы талыми водами, [т/га/год];
A, B, C - эмпирические коэффициенты;
L – длина склона, [м] (топографический фактор);
Ka – коэффициент агрофона (биогенный фактор)
h – слой склонового стока, [мм] (климатический фактор);
P, N, S, T, Z, F, R, M – эмпирические коэффициенты, зависящие от
смываемости почвы (почвенные факторы).
(1)
(3)
(2)
(4)](https://image.slidesharecdn.com/cn9wed13allwb5posters-101027103617-phpapp01/85/Cn-9-wed13_all_wb5_posters-27-320.jpg)
![30
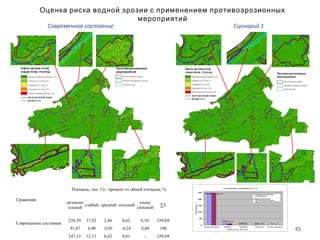
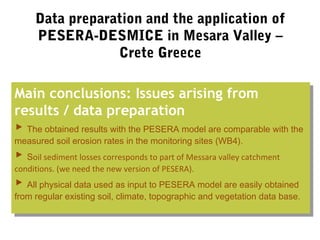
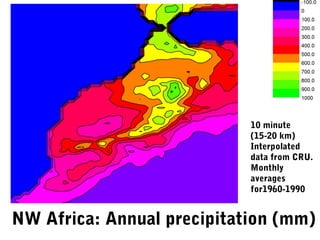
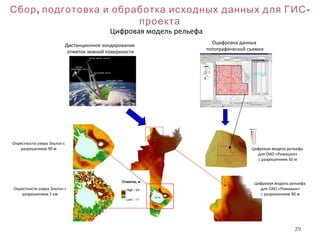
, -Сбор подготовка и обработка исходных данных для ГИС
проекта
Примеры слоев данных с посчитанным
коэффициентом склонового стока (h) в Палласовском
районе с разрешениями
90 м (слева); 1 км (справа)
Склоновый сток (h)
E
HDih =
H - запас воды в снеге, [мм] (зависит от толщины снега;
толщина снега принималась равной 40 см - среднегодовое значение)
D, E – коэффициенты, зависящие от типа почвы;
i – уклон поверхности земли, %
Слой данных
с коэффициентом агрофона
(разрешение 1 км)
Слой данных,
показывающий тип землепользования
(разрешение 1 км)
Табл. 1
Часть таблицы для определения коэффициента агрофона
Коэффициент агрофона (Ka)
Табл. 2
Значение параметров D и E
(6)](https://image.slidesharecdn.com/cn9wed13allwb5posters-101027103617-phpapp01/85/Cn-9-wed13_all_wb5_posters-30-320.jpg)
![37
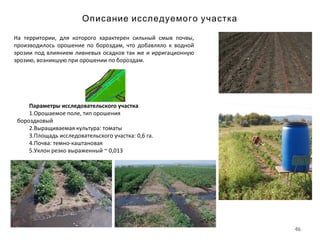
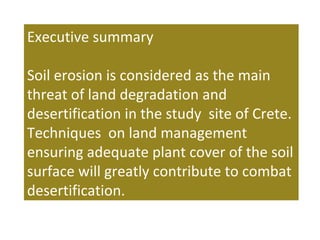
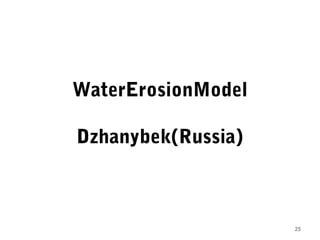
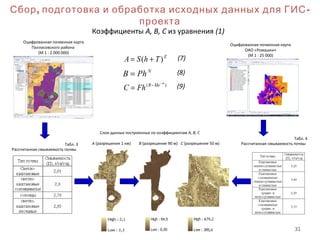
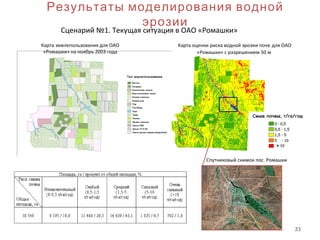
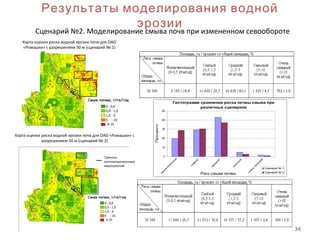
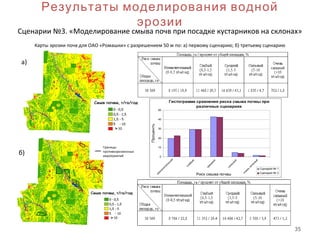
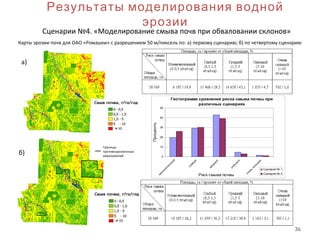
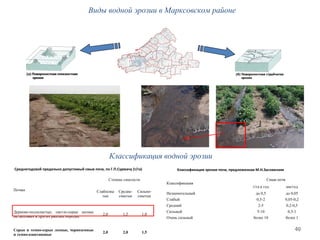
Результаты моделирования водной эрозии
Эффективность различных сценариев с точки зрения уменьшения негативного антропогенного
воздействия вызывающего водную эрозию для ОАО «Ромашки»
100
SSЭ
×
−
=
М
М
Э
S
Э SЭ - площадь эрозионно-опасных земель без мероприятий, [га];
- площадь эрозионно-опасных земель с противоэрозионными мероприятиями, [га];
SМ - площадь земель задействованных в противоэрозионных мероприятиях, [га]
М
ЭS
Гистограмма сравнения риска смыва повы при
различных сценариях
0
10
20
30
40
50
60
70
В переделах допустимого (<1.5 т/га/год) Выше допустимого (>1.5 т/га/год)
Риск смыва почвы
Проценты
Сценарий № 1
Сценарий № 2
Сценарий № 3
Сценарий № 4
0
10
20
30
40
50
60
Эффективность,%
2 3 4
№ Сценария
Эффективность сценариев с
противоэрозионными мероприятиями](https://image.slidesharecdn.com/cn9wed13allwb5posters-101027103617-phpapp01/85/Cn-9-wed13_all_wb5_posters-37-320.jpg)

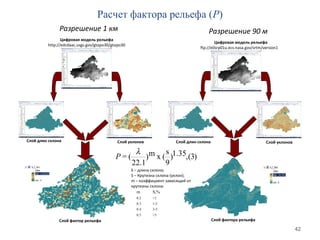
![43
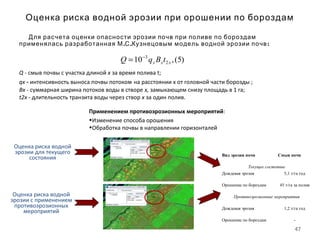
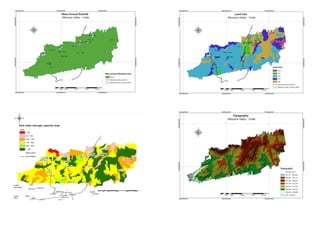
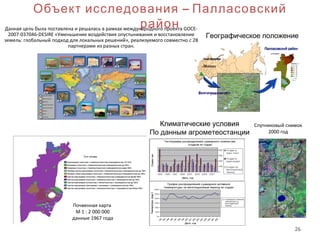
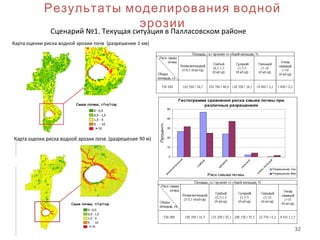
Слой эрозионного
потенциала дождевых осадков Слой эродируемости почвы
Слои эрозионного индекса культур
а) Разрешение 1км (Global Map Version 1.2 Specifications)
б) Разрешение 90м (классификация полученная при помощи программы ENVI)
Смываемость почв (П)
Эрозионный индекс растительности (С)
Эрозионный потенциал дождевых осадков (Д)
)5(,}])h64I8.94(lg2.3[24.73{01.0= 30
nj
nj
jj IД ∑
=
=
+
Ij – интенсивность дождя за j-ый интервал времени;
hj – слой дождя за j – ый интервал времени;
I30 – максимальная 30-минутная интенсивность осадков.
Расчет факторов водной эрозии
f – содержание фракции 0,1-0,001
e – содержание фракции <0,001
a – содержание гумуса,
b – класс структуры почвы;
c – класс водопроницаемости почвы;
d – поправочный коэффициент на каменистость почвы.
П={16,67*10-6*[f*(100-e)]1,14*(12-a) +0,25*(b-2)+0,193(4-c)}*d (4)](https://image.slidesharecdn.com/cn9wed13allwb5posters-101027103617-phpapp01/85/Cn-9-wed13_all_wb5_posters-43-320.jpg)