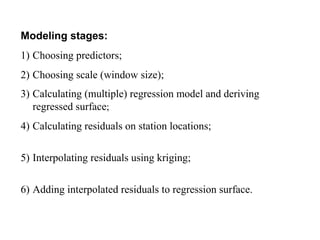
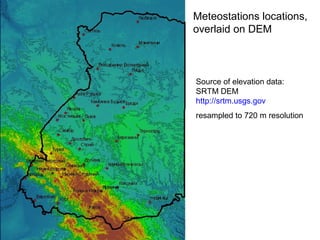
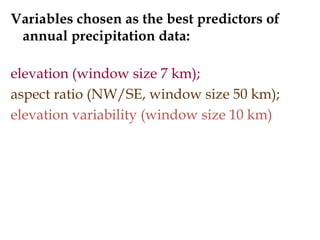
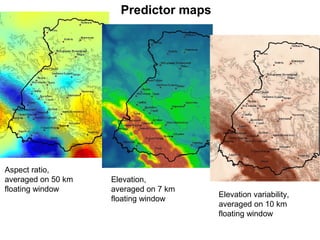
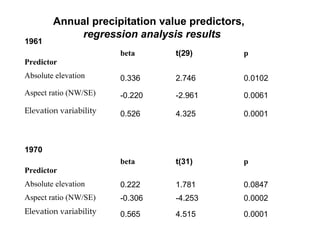
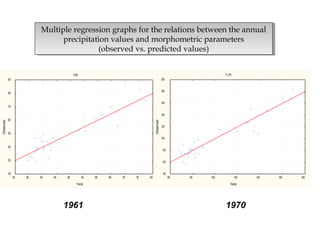
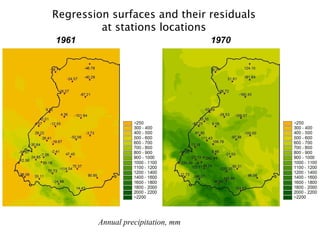
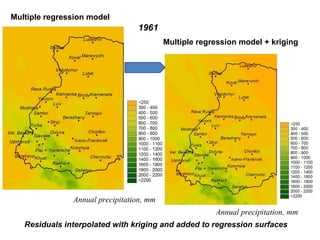
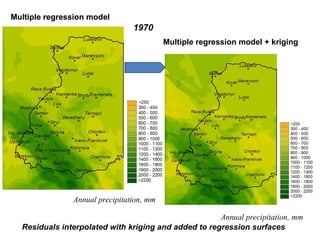
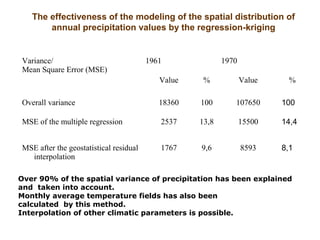
Alexander Mkrtchian (alemkrt@gmail.com),
Interpolation of meteodata using the method
of regression-kriging
The regression-kriging method is based on the combination of multiple
regression modeling, which utilizes DEM-derived morphometric data
interpreted as factors influencing precipitation, and the geostatistical
interpolation of regression residuals.
Modeling stages:
1) Choosing predictors;
2) Choosing scale (floating window size);
3) Calculating (multiple) regression model and deriving
regressed surface;
4) Calculating residuals on station locations;
5) Interpolating residuals using kriging;
6) Adding interpolated residuals to regression surface.
Meteostations locations,
overlaid on DEM
Source of elevation data:
SRTM DEM
http://srtm.usgs.gov
resampled to 720 m resolution
Definition of variables chosen as the best
predictors of annual precipitation data:
Elevation
- average value for the floating window
window size 7 km;
Aspect ratio (NW/SE)
- difference of average elevation values btw. two opposite
floating window quadrants
window size 50 km;
Elevation variability
- standard deviation of elevation values in floating window
window size 10 km
Aspect ratio,
averaged on 50 km
floating window
Elevation,
averaged on 7 km
floating window
Elevation variability,
averaged on 10 km
floating window
Predictor maps
Predictor
beta t(31) p
Absolute elevation 0.222 1.781 0.0847
Aspect ratio (NW/SE) -0.306 -4.253 0.0002
Elevation variability 0.565 4.515 0.0001
Predictor
beta t(29) p
Absolute elevation 0.336 2.746 0.0102
Aspect ratio (NW/SE) -0.220 -2.961 0.0061
Elevation variability 0.526 4.325 0.0001
1961
1970
Annual precipitation value predictors,
regression analysis results
Pr1961
300 350 400 450 500 550 600 650 700 750 800
Predicted
200
300
400
500
600
700
800
900
Observed
Pr_1970
600 800 1000 1200 1400 1600 1800
Predicted
400
600
800
1000
1200
1400
1600
1800
2000
Observed
1961 1970
Multiple regression graphs for the relationships between the
annual precipitation values and morphometric parameters
(observed vs. predicted values)
Multiple regression graphs for the relationships between the
annual precipitation values and morphometric parameters
(observed vs. predicted values)
Regression surfaces and their residuals
at stations locations
1961 1970
Predicted annual precipitation and residuals, mm
1961
Multiple regression model
Multiple regression model + kriging
Annual precipitation, mm
Residuals interpolated with kriging and added to regression surfaces
Multiple regression model
Multiple regression model + kriging
1970
Annual precipitation, mm
Multiple regression model
Residuals interpolated with kriging and added to regression surfaces
Variance/
Mean Square Error (MSE)
1961 1970
Value % Value %
Overall variance 18360 100 107650 100
MSE of the multiple regression 2537 13,8 15500 14,4
MSE after the geostatistical residual
interpolation
1767 9,6 8593 8,1
The effectiveness of the modeling of the spatial distribution of
annual precipitation values by the regression-kriging
Over 90% of the spatial variance of precipitation has been explained
and taken into account.
Monthly average temperature fields has also been
calculated by this method.
Interpolation of other climatic parameters is possible.

Interpolation of meteodata using the method of regression-kriging

  • 1.
    Alexander Mkrtchian (alemkrt@gmail.com), Interpolationof meteodata using the method of regression-kriging The regression-kriging method is based on the combination of multiple regression modeling, which utilizes DEM-derived morphometric data interpreted as factors influencing precipitation, and the geostatistical interpolation of regression residuals.
  • 2.
    Modeling stages: 1) Choosingpredictors; 2) Choosing scale (floating window size); 3) Calculating (multiple) regression model and deriving regressed surface; 4) Calculating residuals on station locations; 5) Interpolating residuals using kriging; 6) Adding interpolated residuals to regression surface.
  • 3.
    Meteostations locations, overlaid onDEM Source of elevation data: SRTM DEM http://srtm.usgs.gov resampled to 720 m resolution
  • 4.
    Definition of variableschosen as the best predictors of annual precipitation data: Elevation - average value for the floating window window size 7 km; Aspect ratio (NW/SE) - difference of average elevation values btw. two opposite floating window quadrants window size 50 km; Elevation variability - standard deviation of elevation values in floating window window size 10 km
  • 5.
    Aspect ratio, averaged on50 km floating window Elevation, averaged on 7 km floating window Elevation variability, averaged on 10 km floating window Predictor maps
  • 6.
    Predictor beta t(31) p Absoluteelevation 0.222 1.781 0.0847 Aspect ratio (NW/SE) -0.306 -4.253 0.0002 Elevation variability 0.565 4.515 0.0001 Predictor beta t(29) p Absolute elevation 0.336 2.746 0.0102 Aspect ratio (NW/SE) -0.220 -2.961 0.0061 Elevation variability 0.526 4.325 0.0001 1961 1970 Annual precipitation value predictors, regression analysis results
  • 7.
    Pr1961 300 350 400450 500 550 600 650 700 750 800 Predicted 200 300 400 500 600 700 800 900 Observed Pr_1970 600 800 1000 1200 1400 1600 1800 Predicted 400 600 800 1000 1200 1400 1600 1800 2000 Observed 1961 1970 Multiple regression graphs for the relationships between the annual precipitation values and morphometric parameters (observed vs. predicted values) Multiple regression graphs for the relationships between the annual precipitation values and morphometric parameters (observed vs. predicted values)
  • 8.
    Regression surfaces andtheir residuals at stations locations 1961 1970 Predicted annual precipitation and residuals, mm
  • 9.
    1961 Multiple regression model Multipleregression model + kriging Annual precipitation, mm Annual precipitation, mm Residuals interpolated with kriging and added to regression surfaces
  • 10.
    Multiple regression model Multipleregression model + kriging 1970 Annual precipitation, mm Annual precipitation, mm Multiple regression model Residuals interpolated with kriging and added to regression surfaces
  • 11.
    Variance/ Mean Square Error(MSE) 1961 1970 Value % Value % Overall variance 18360 100 107650 100 MSE of the multiple regression 2537 13,8 15500 14,4 MSE after the geostatistical residual interpolation 1767 9,6 8593 8,1 The effectiveness of the modeling of the spatial distribution of annual precipitation values by the regression-kriging Over 90% of the spatial variance of precipitation has been explained and taken into account. Monthly average temperature fields has also been calculated by this method. Interpolation of other climatic parameters is possible.