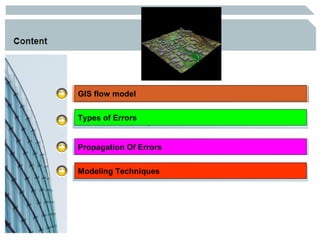
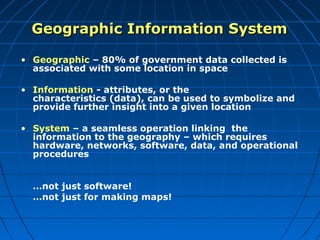
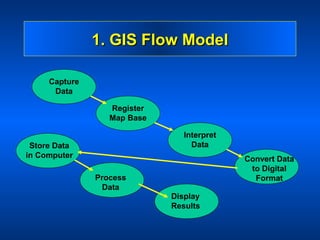
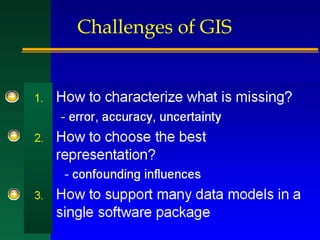
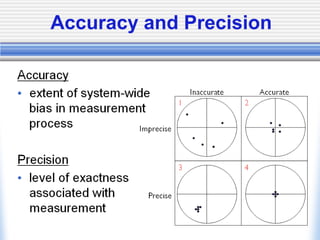
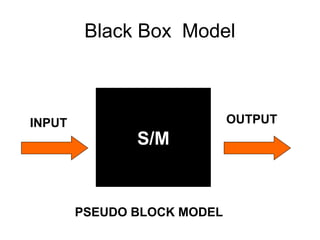
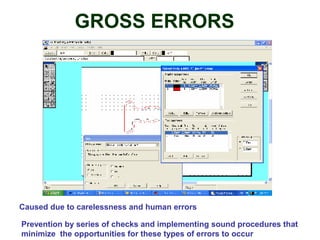
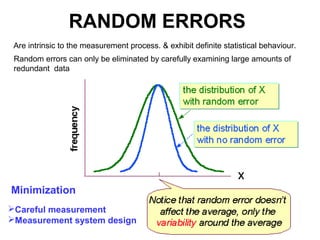
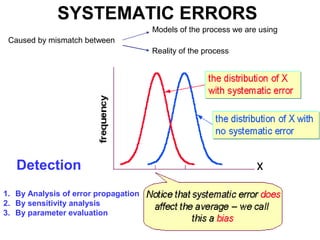
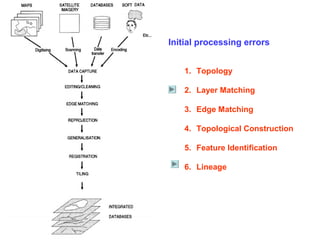
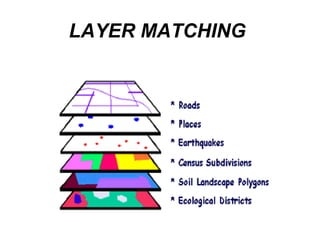
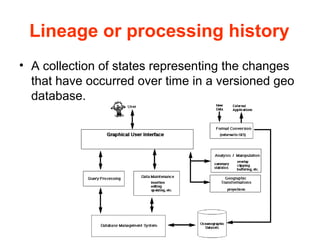
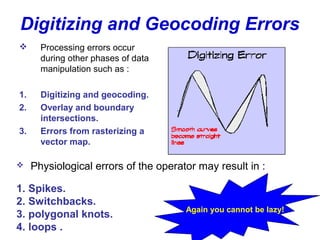
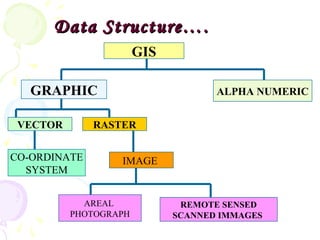
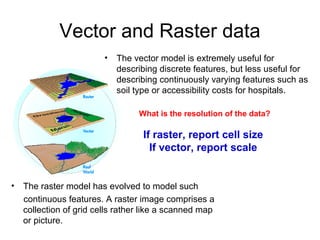
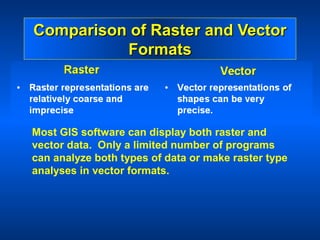
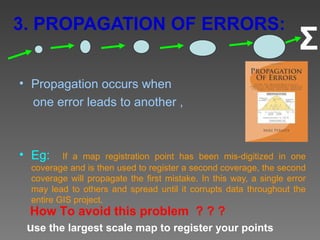
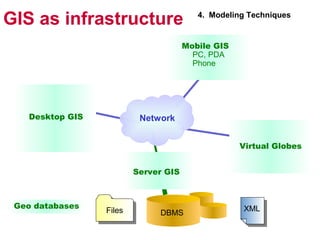
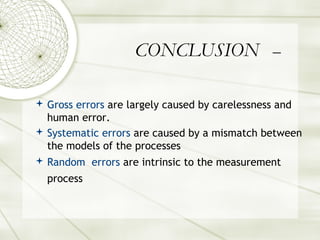
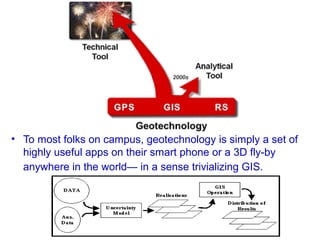
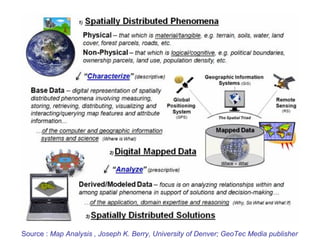
ICGE 2012 - December 3-4,2012 (Paper No. D005)
GIS flow model


Types of Errors


Propagation Of Errors


Modeling Techniques
Geographic Information System

• Geographic – 80% of government data collected is
  associated with some location in space

• Information - attributes, or the
  characteristics (data), can be used to symbolize and
  provide further insight into a given location

• System – a seamless operation linking the
  information to the geography – which requires
  hardware, networks, software, data, and operational
  procedures


  …not just software!
  …not just for making maps!
1. GIS Flow Model

     Capture
      Data

                  Register
                  Map Base

                                Interpret
 Store Data                       Data
in Computer                                 Convert Data
                                             to Digital
               Process                        Format
                 Data
                             Display
                             Results
Challenges of GIS
Accuracy and Precision
ERROR AND UNCERTAINTY
SOURCES OF ERROR
HANDLING ERROR
HANDLING ERROR
TIME LINE


ACTION                         FORECASTING


               PREDICTION


     PRESENT                        FUTURE
Black Box Model


INPUT                        OUTPUT
               S/M


        PSEUDO BLOCK MODEL
2. TYPES OF ERRORS


• GROSS ERRORS
• RANDOM ERRORS
• SYSTEMATIC ERRORS
GROSS ERRORS


Caused due to carelessness and human errors

Prevention by series of checks and implementing sound procedures that
minimize the opportunities for these types of errors to occur
RANDOM ERRORS
 Are intrinsic to the measurement process. & exhibit definite statistical behaviour.
 Random errors can only be eliminated by carefully examining large amounts of
 redundant data


Minimization
Careful measurement
Measurement system design
SYSTEMATIC ERRORS
                                      Models of the process we are using
 Caused by mismatch between
                                      Reality of the process


   Detection
1. By Analysis of error propagation
2. By sensitivity analysis
3. By parameter evaluation
Initial processing errors


   1. Topology

   2. Layer Matching

   3. Edge Matching

   4. Topological Construction

   5. Feature Identification

   6. Lineage
LAYER MATCHING
Lineage or processing history
• A collection of states representing the changes
  that have occurred over time in a versioned geo
  database.
Metadata

   Metadata is data about data.


It is a summary document providing :
1.        content,
2.        quality,
3.        type,
4.        creation,
5.        and spatial information about a dataset.
Meta data Analysis
Digitizing and Geocoding Errors
      Processing errors occur
       during other phases of data
       manipulation such as :

1.     Digitizing and geocoding.
2.     Overlay and boundary
       intersections.
3.     Errors from rasterizing a
       vector map.

    Physiological errors of the operator may result in :

1. Spikes.
2. Switchbacks.
                                       Again you cannot be lazy!
3. polygonal knots.
4. loops .
Data Structure….
                       GIS

   GRAPHIC                          ALPHA NUMERIC


 VECTOR       RASTER


CO-ORDINATE       IMAGE
  SYSTEM


            AREAL             REMOTE SENSED
          PHOTOGRAPH         SCANNED IMMAGES
Vector and Raster data
                         •   The vector model is extremely useful for
                             describing discrete features, but less useful for
                             describing continuously varying features such as
                             soil type or accessibility costs for hospitals.

                                  What is the resolution of the data?

                                   If raster, report cell size
                                     If vector, report scale


•   The raster model has evolved to model such
    continuous features. A raster image comprises a
    collection of grid cells rather like a scanned map
    or picture.
Comparison of Raster and Vector
          Formats


Most GIS software can display both raster and
vector data. Only a limited number of programs
can analyze both types of data or make raster type
analyses in vector formats.
3. PROPAGATION OF ERRORS:
                                                                      Σ
• Propagation occurs when
  one error leads to another ,


• Eg:     If a map registration point has been mis-digitized in one
  coverage and is then used to register a second coverage, the second
  coverage will propagate the first mistake. In this way, a single error
  may lead to others and spread until it corrupts data throughout the
  entire GIS project.
 How To avoid this problem ? ? ?
 use the largest scale map to register your points
Why Use GIS in Schools?
•   Encourage seminars demonstrating applications

•   Establish a networking organization encompassing all interested
    disciplines

•   Teach a class or lab for a department outside of your own

•   Organize or team-teach a discipline-oriented workshop with a
    domain expert

•   Write proposals for non-GIS teaching, research and outreach

•   Consider adopting a SpatialSTEM approach that translates grid-based map
    analysis operations into a mathematical/statistical framework that serves as
    the communal language of science, technology, engineering and
    mathematics disciplines
GIS as infrastructure                    4. Modeling Techniques


                                      Mobile GIS
                                        PC, PDA
                                        Phone


   Desktop GIS            Network


                                                   Virtual Globes


                         Server GIS


 Geo databases                                     XML
                 Files        DBMS
CONCLUSION –

 Gross errors are largely caused by carelessness and
  human error.
 Systematic errors are caused by a mismatch between
  the models of the processes
 Random errors are intrinsic to the measurement
  process
REFERENCES :
1.   BURROUGH, P.A., 1986. Principles of Geographical Information
     Systems for Land Resources Assessment. Oxford, UK : Oxford University
     Press.
2.   CASSETTARI , S., 1993. Introduction to Integration Geo-Information
     Management. London : Chapman and Hall.
3.   CHRISMAN, N.R., 1983. The role of quality information in the long-term
     functioning of a geographic information system. Cartographica 21 : 79.
4.   CHRISMAN, N.R., and LESTER, M.K., 1991. A. Diagnostic Test for
     Categorical Maps. Technical Papers 1991 ACSM – ASPRS Anual
     Convention, Vol.6, pp. 330-348.
5.   CHRISMAN, N.R., 1998. Rethinking Levels of Measurement for
     Cartography. Cartography and Geographic Information System, Vol. 25,
     No. 4, pp. 231 – 242.
6.   DALE, P.F., and MCLAUCHLIN , J.D., 1999. Land Information
     Management. Oxford University Press.
7.   LAURINI, R., and THOMPSON, D., 1992. Fundamentals of Spatial
     Information Systems. Sand Diego : Academic Press.
8.   STAR, J.L and J.E. ESTES, 1990. Geographic Information Systems : An
     Introduction, Prentice Hall.
Thank you.

     QUERRIES ? ? ?
One More Thing
SYSTEM DYNAMICS
Grid sampling examples
     within hexagonal grid
  A number of GIS software packages, such
 as TNTMips, ENVI, Idrisi and GRASS provide
tools to assist in the selection of sample points
Ontology-based model of space, time, and theme.
           Spatial Occurrents and Named Places are directly linked
          with Spatial Regions which record their geographic location.
              Temporal intervals on relationships denote when the
                         relationship holds (valid time).


Courtsey : Analyzing Theme, Space, and Time: An Ontology-based Approach
By Matthew Perry – ACM 2006
Vector and Raster Formats
• Most GIS software can display both vector and
  raster data.
• Raster formats are efficient when comparing
  information among arrays with the same cell size.
• Raster files are generally very large because each
  cell occupies a separate line of data.
• Vector formats are efficient when comparing
  information whose geographical dimensions are
  different.
How to Geomask
Outside a GIS
•Can perform arithmetic on X and Y (latitude
 and longitude fields)
•Can set a minimum or maximum distance
 based on population density (urban vs rural)


Inside a GIS
 •Generate a random point within a circular
  buffer
 •Add a population density layer to decide
  min/max distances
 •Can avoid placing points “out of bounds”
                                                GIS 43
Geocoding


      Input
      Address
                        yes           Matches?          no


  Parse Address       Score Matches


  Generate Soundex      Best Score      no
  for Address Name        >= 90?                   Output
                                                   Rejects
                         yes

   List Candidates:                          Correct Addresses
   No. Range,Zone         Output
                          Address            or Map


                                                                 GIS 44
U.S. Census Bureau TIGER


                           GEOCODER


       TOPOLOGICALLY
        NTEGRATED

         EOGRAPHIC

       I NCODING
       G EFERENCING
       E
                                      GIS 45
Software Used
   Arc/Info
   IDRISI
   Also use: ER-Mapper, ERDAS, Atlas*GIS
Textbooks


               Geographic Information
            Systems and Science, 3rd ed.
             by Longley, Goodchild, Maguire,
                       and Rhind
Textbooks


               GIS Tutorial 2: Spatial
            Analysis Workbook for ArcGIS
                     10, 2nd ed.
                       by Allen
Textbooks


            Place Matters: Geospatial
            Tools for Marine Science,
                Conservation, and
                   Management
             in the Pacific Northwest
             edited by Wright and Scholz
• To most folks on campus, geotechnology is simply a set of
  highly useful apps on their smart phone or a 3D fly-by
  anywhere in the world— in a sense trivializing GIS.
Source : Map Analysis , Joseph K. Berry, University of Denver; GeoTec Media publisher

Final ies

  • 1.
    ICGE 2012 -December 3-4,2012 (Paper No. D005)
  • 2.
    GIS flow model Typesof Errors Propagation Of Errors Modeling Techniques
  • 3.
    Geographic Information System •Geographic – 80% of government data collected is associated with some location in space • Information - attributes, or the characteristics (data), can be used to symbolize and provide further insight into a given location • System – a seamless operation linking the information to the geography – which requires hardware, networks, software, data, and operational procedures …not just software! …not just for making maps!
  • 4.
    1. GIS FlowModel Capture Data Register Map Base Interpret Store Data Data in Computer Convert Data to Digital Process Format Data Display Results
  • 5.
  • 6.
  • 7.
  • 8.
  • 9.
  • 10.
  • 11.
    TIME LINE ACTION FORECASTING PREDICTION PRESENT FUTURE
  • 12.
    Black Box Model INPUT OUTPUT S/M PSEUDO BLOCK MODEL
  • 13.
    2. TYPES OFERRORS • GROSS ERRORS • RANDOM ERRORS • SYSTEMATIC ERRORS
  • 14.
    GROSS ERRORS Caused dueto carelessness and human errors Prevention by series of checks and implementing sound procedures that minimize the opportunities for these types of errors to occur
  • 15.
    RANDOM ERRORS Areintrinsic to the measurement process. & exhibit definite statistical behaviour. Random errors can only be eliminated by carefully examining large amounts of redundant data Minimization Careful measurement Measurement system design
  • 16.
    SYSTEMATIC ERRORS Models of the process we are using Caused by mismatch between Reality of the process Detection 1. By Analysis of error propagation 2. By sensitivity analysis 3. By parameter evaluation
  • 17.
    Initial processing errors 1. Topology 2. Layer Matching 3. Edge Matching 4. Topological Construction 5. Feature Identification 6. Lineage
  • 18.
  • 19.
    Lineage or processinghistory • A collection of states representing the changes that have occurred over time in a versioned geo database.
  • 20.
    Metadata  Metadata is data about data. It is a summary document providing : 1. content, 2. quality, 3. type, 4. creation, 5. and spatial information about a dataset.
  • 21.
  • 22.
    Digitizing and GeocodingErrors  Processing errors occur during other phases of data manipulation such as : 1. Digitizing and geocoding. 2. Overlay and boundary intersections. 3. Errors from rasterizing a vector map.  Physiological errors of the operator may result in : 1. Spikes. 2. Switchbacks. Again you cannot be lazy! 3. polygonal knots. 4. loops .
  • 23.
    Data Structure…. GIS GRAPHIC ALPHA NUMERIC VECTOR RASTER CO-ORDINATE IMAGE SYSTEM AREAL REMOTE SENSED PHOTOGRAPH SCANNED IMMAGES
  • 24.
    Vector and Rasterdata • The vector model is extremely useful for describing discrete features, but less useful for describing continuously varying features such as soil type or accessibility costs for hospitals. What is the resolution of the data? If raster, report cell size If vector, report scale • The raster model has evolved to model such continuous features. A raster image comprises a collection of grid cells rather like a scanned map or picture.
  • 25.
    Comparison of Rasterand Vector Formats Most GIS software can display both raster and vector data. Only a limited number of programs can analyze both types of data or make raster type analyses in vector formats.
  • 26.
    3. PROPAGATION OFERRORS: Σ • Propagation occurs when one error leads to another , • Eg: If a map registration point has been mis-digitized in one coverage and is then used to register a second coverage, the second coverage will propagate the first mistake. In this way, a single error may lead to others and spread until it corrupts data throughout the entire GIS project. How To avoid this problem ? ? ? use the largest scale map to register your points
  • 27.
    Why Use GISin Schools?
  • 28.
    Why Use GISin Schools? • Encourage seminars demonstrating applications • Establish a networking organization encompassing all interested disciplines • Teach a class or lab for a department outside of your own • Organize or team-teach a discipline-oriented workshop with a domain expert • Write proposals for non-GIS teaching, research and outreach • Consider adopting a SpatialSTEM approach that translates grid-based map analysis operations into a mathematical/statistical framework that serves as the communal language of science, technology, engineering and mathematics disciplines
  • 29.
    GIS as infrastructure 4. Modeling Techniques Mobile GIS PC, PDA Phone Desktop GIS Network Virtual Globes Server GIS Geo databases XML Files DBMS
  • 30.
    CONCLUSION –  Grosserrors are largely caused by carelessness and human error.  Systematic errors are caused by a mismatch between the models of the processes  Random errors are intrinsic to the measurement process
  • 31.
    REFERENCES : 1. BURROUGH, P.A., 1986. Principles of Geographical Information Systems for Land Resources Assessment. Oxford, UK : Oxford University Press. 2. CASSETTARI , S., 1993. Introduction to Integration Geo-Information Management. London : Chapman and Hall. 3. CHRISMAN, N.R., 1983. The role of quality information in the long-term functioning of a geographic information system. Cartographica 21 : 79. 4. CHRISMAN, N.R., and LESTER, M.K., 1991. A. Diagnostic Test for Categorical Maps. Technical Papers 1991 ACSM – ASPRS Anual Convention, Vol.6, pp. 330-348. 5. CHRISMAN, N.R., 1998. Rethinking Levels of Measurement for Cartography. Cartography and Geographic Information System, Vol. 25, No. 4, pp. 231 – 242. 6. DALE, P.F., and MCLAUCHLIN , J.D., 1999. Land Information Management. Oxford University Press. 7. LAURINI, R., and THOMPSON, D., 1992. Fundamentals of Spatial Information Systems. Sand Diego : Academic Press. 8. STAR, J.L and J.E. ESTES, 1990. Geographic Information Systems : An Introduction, Prentice Hall.
  • 36.
    Thank you. QUERRIES ? ? ?
  • 38.
  • 39.
    Grid sampling examples within hexagonal grid A number of GIS software packages, such as TNTMips, ENVI, Idrisi and GRASS provide tools to assist in the selection of sample points
  • 40.
    Ontology-based model ofspace, time, and theme. Spatial Occurrents and Named Places are directly linked with Spatial Regions which record their geographic location. Temporal intervals on relationships denote when the relationship holds (valid time). Courtsey : Analyzing Theme, Space, and Time: An Ontology-based Approach By Matthew Perry – ACM 2006
  • 41.
    Vector and RasterFormats • Most GIS software can display both vector and raster data. • Raster formats are efficient when comparing information among arrays with the same cell size. • Raster files are generally very large because each cell occupies a separate line of data. • Vector formats are efficient when comparing information whose geographical dimensions are different.
  • 43.
    How to Geomask Outsidea GIS •Can perform arithmetic on X and Y (latitude and longitude fields) •Can set a minimum or maximum distance based on population density (urban vs rural) Inside a GIS •Generate a random point within a circular buffer •Add a population density layer to decide min/max distances •Can avoid placing points “out of bounds” GIS 43
  • 44.
    Geocoding Input Address yes Matches? no Parse Address Score Matches Generate Soundex Best Score no for Address Name >= 90? Output Rejects yes List Candidates: Correct Addresses No. Range,Zone Output Address or Map GIS 44
  • 45.
    U.S. Census BureauTIGER GEOCODER TOPOLOGICALLY NTEGRATED EOGRAPHIC I NCODING G EFERENCING E GIS 45
  • 46.
    Software Used Arc/Info IDRISI Also use: ER-Mapper, ERDAS, Atlas*GIS
  • 47.
    Textbooks Geographic Information Systems and Science, 3rd ed. by Longley, Goodchild, Maguire, and Rhind
  • 48.
    Textbooks GIS Tutorial 2: Spatial Analysis Workbook for ArcGIS 10, 2nd ed. by Allen
  • 49.
    Textbooks Place Matters: Geospatial Tools for Marine Science, Conservation, and Management in the Pacific Northwest edited by Wright and Scholz
  • 50.
    • To mostfolks on campus, geotechnology is simply a set of highly useful apps on their smart phone or a 3D fly-by anywhere in the world— in a sense trivializing GIS.
  • 51.
    Source : MapAnalysis , Joseph K. Berry, University of Denver; GeoTec Media publisher