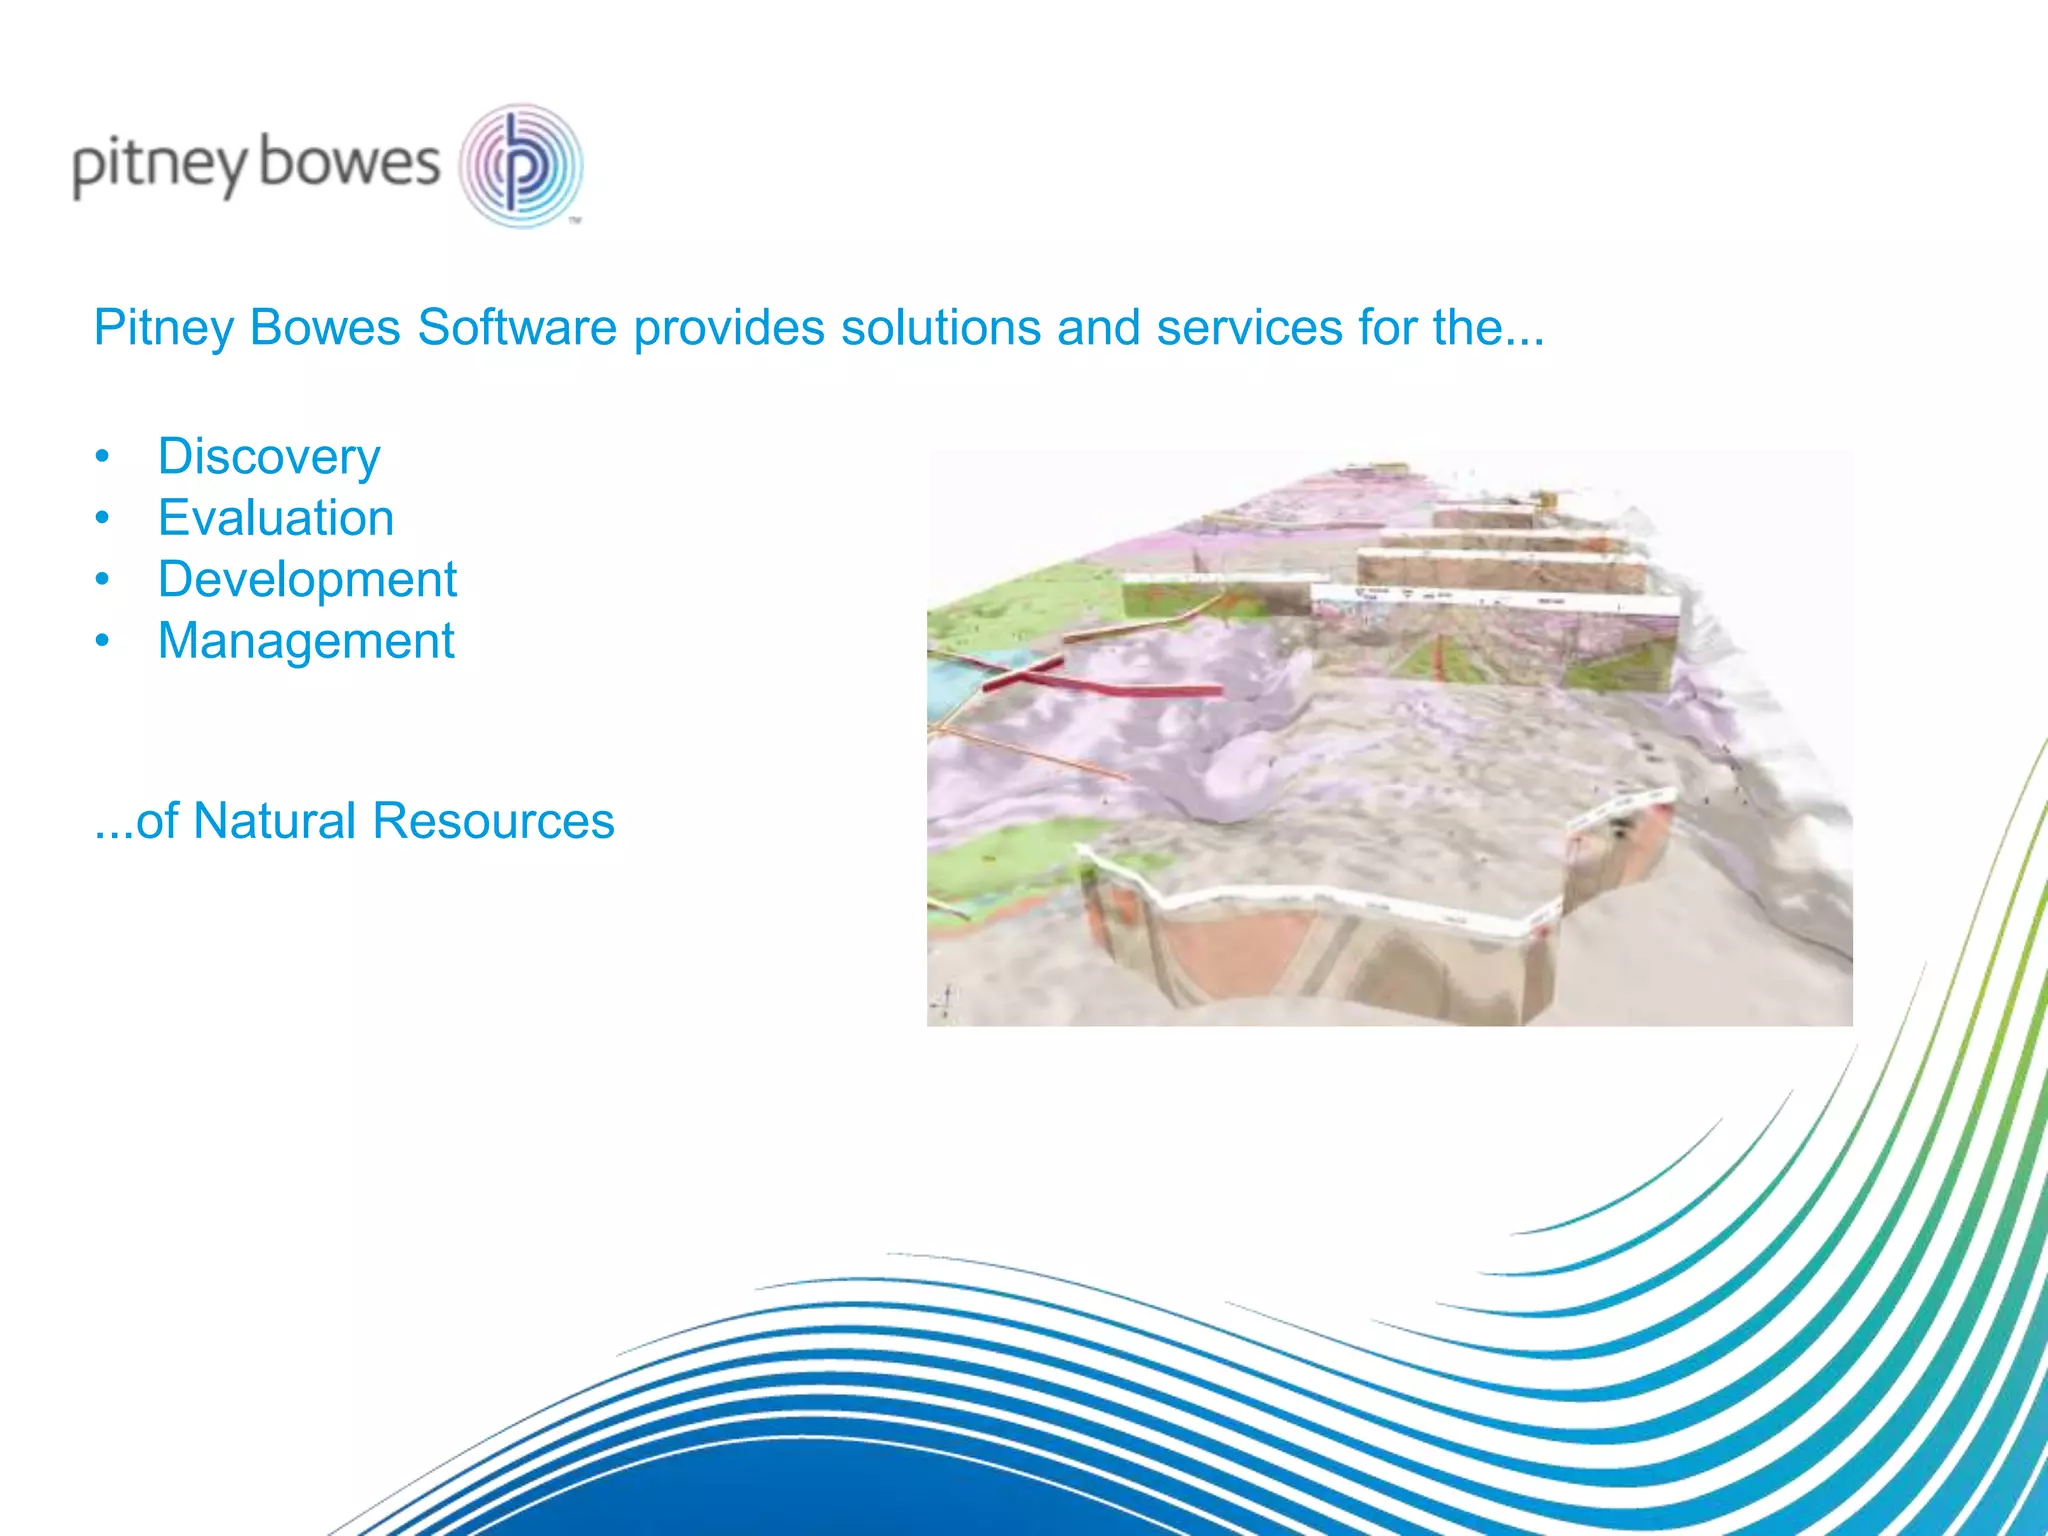
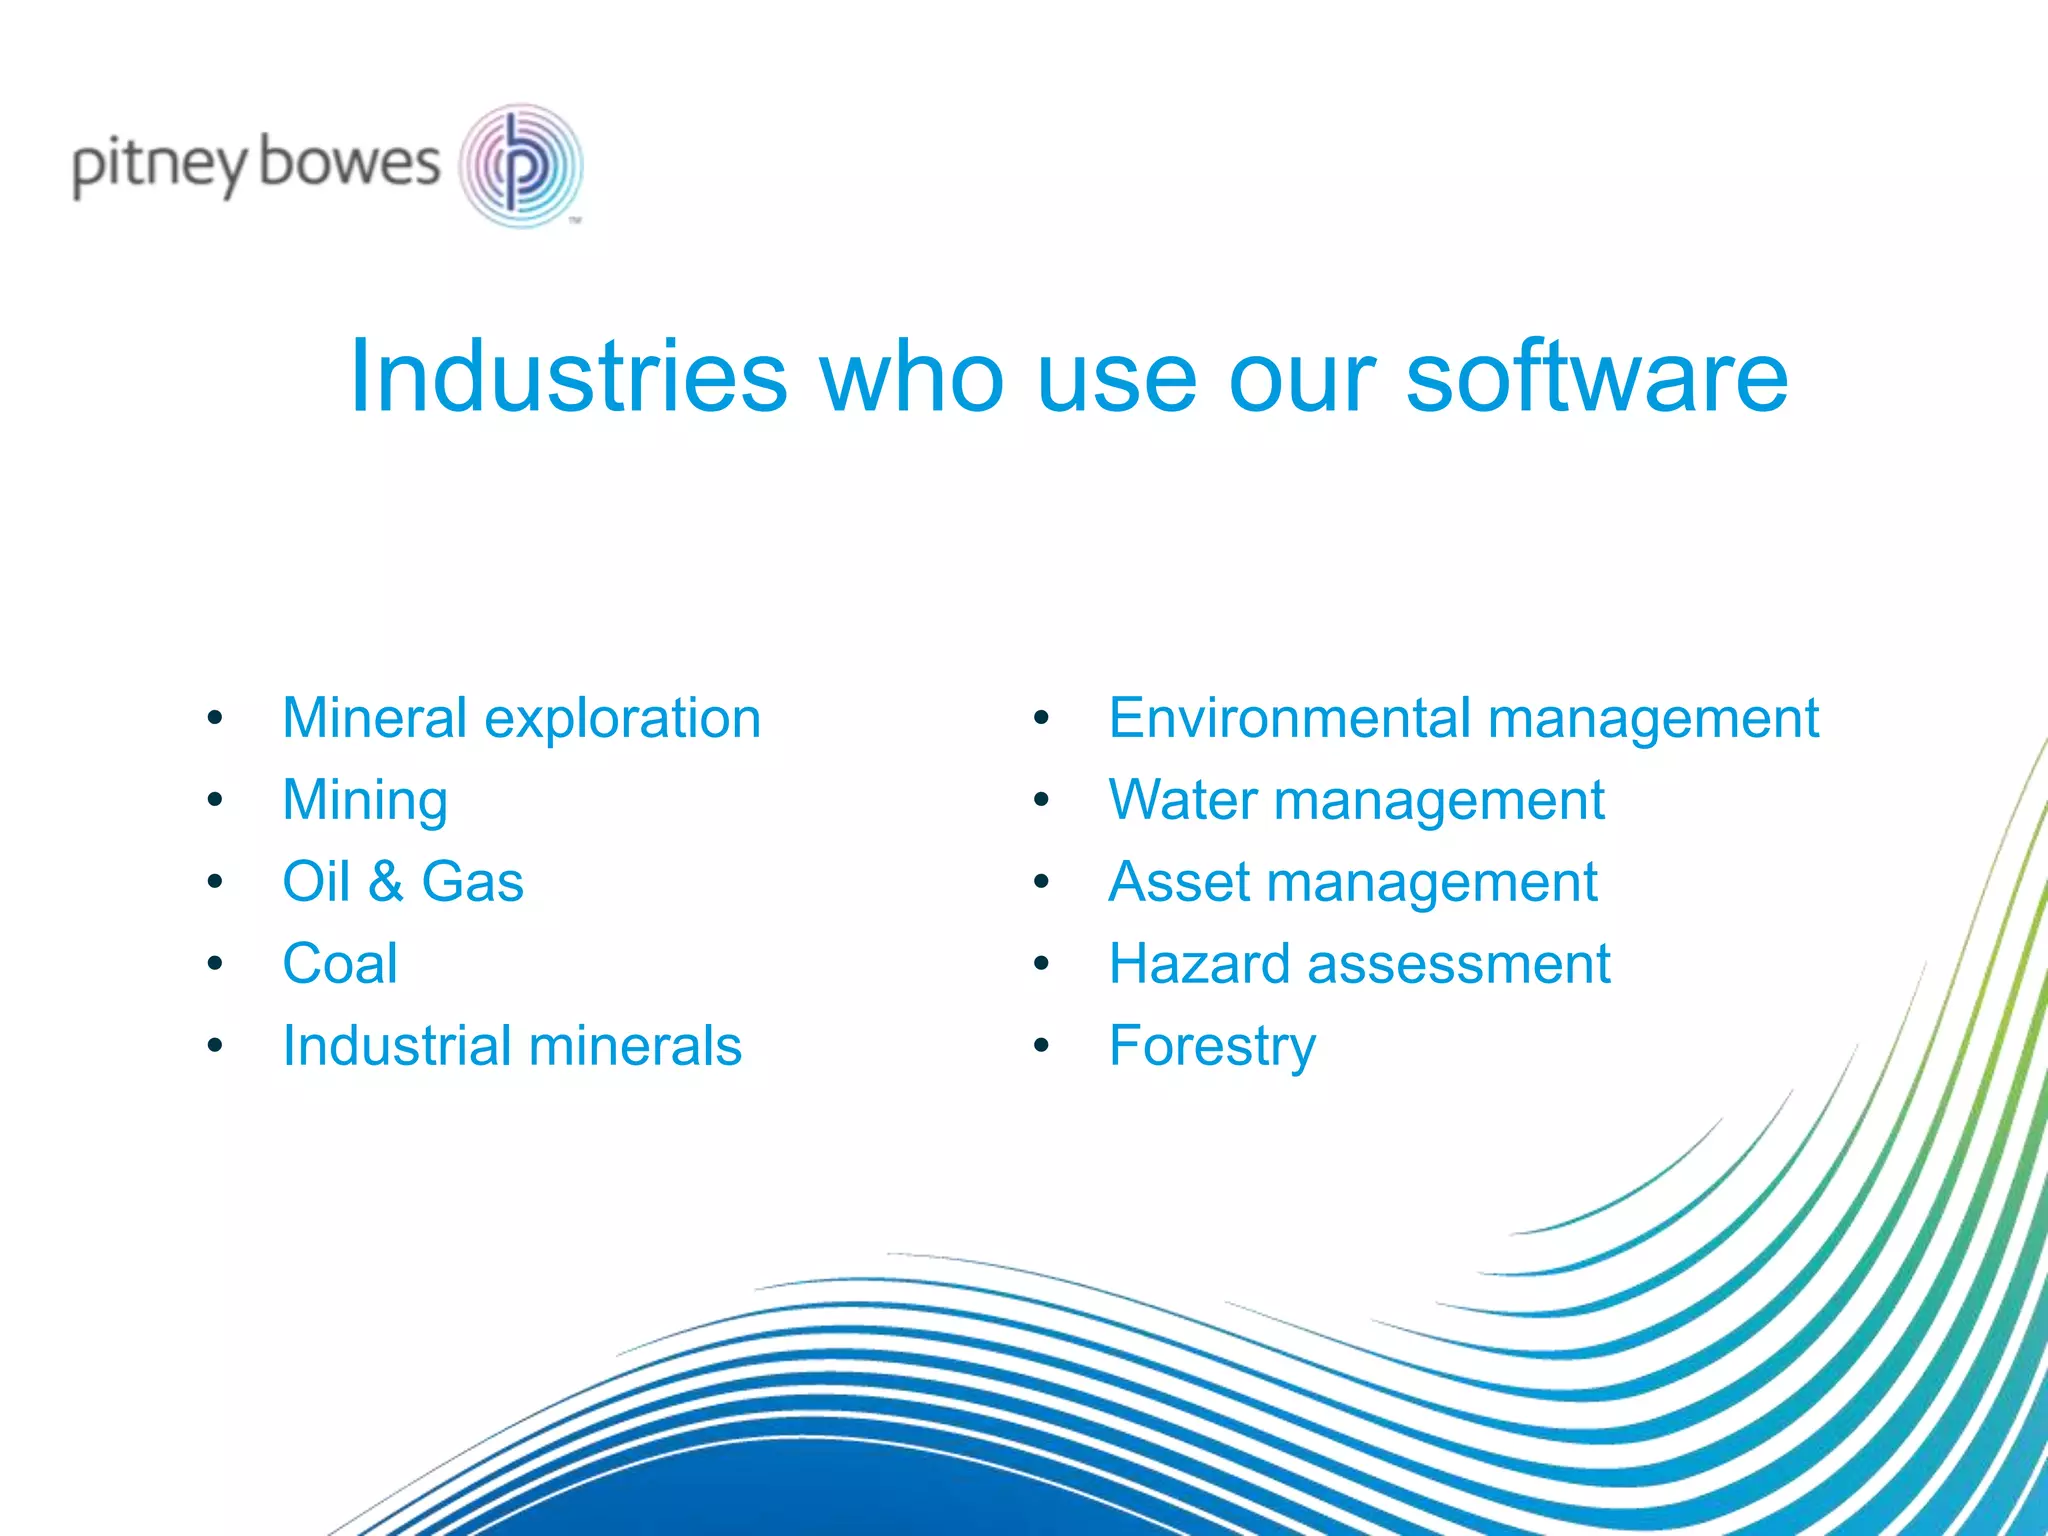
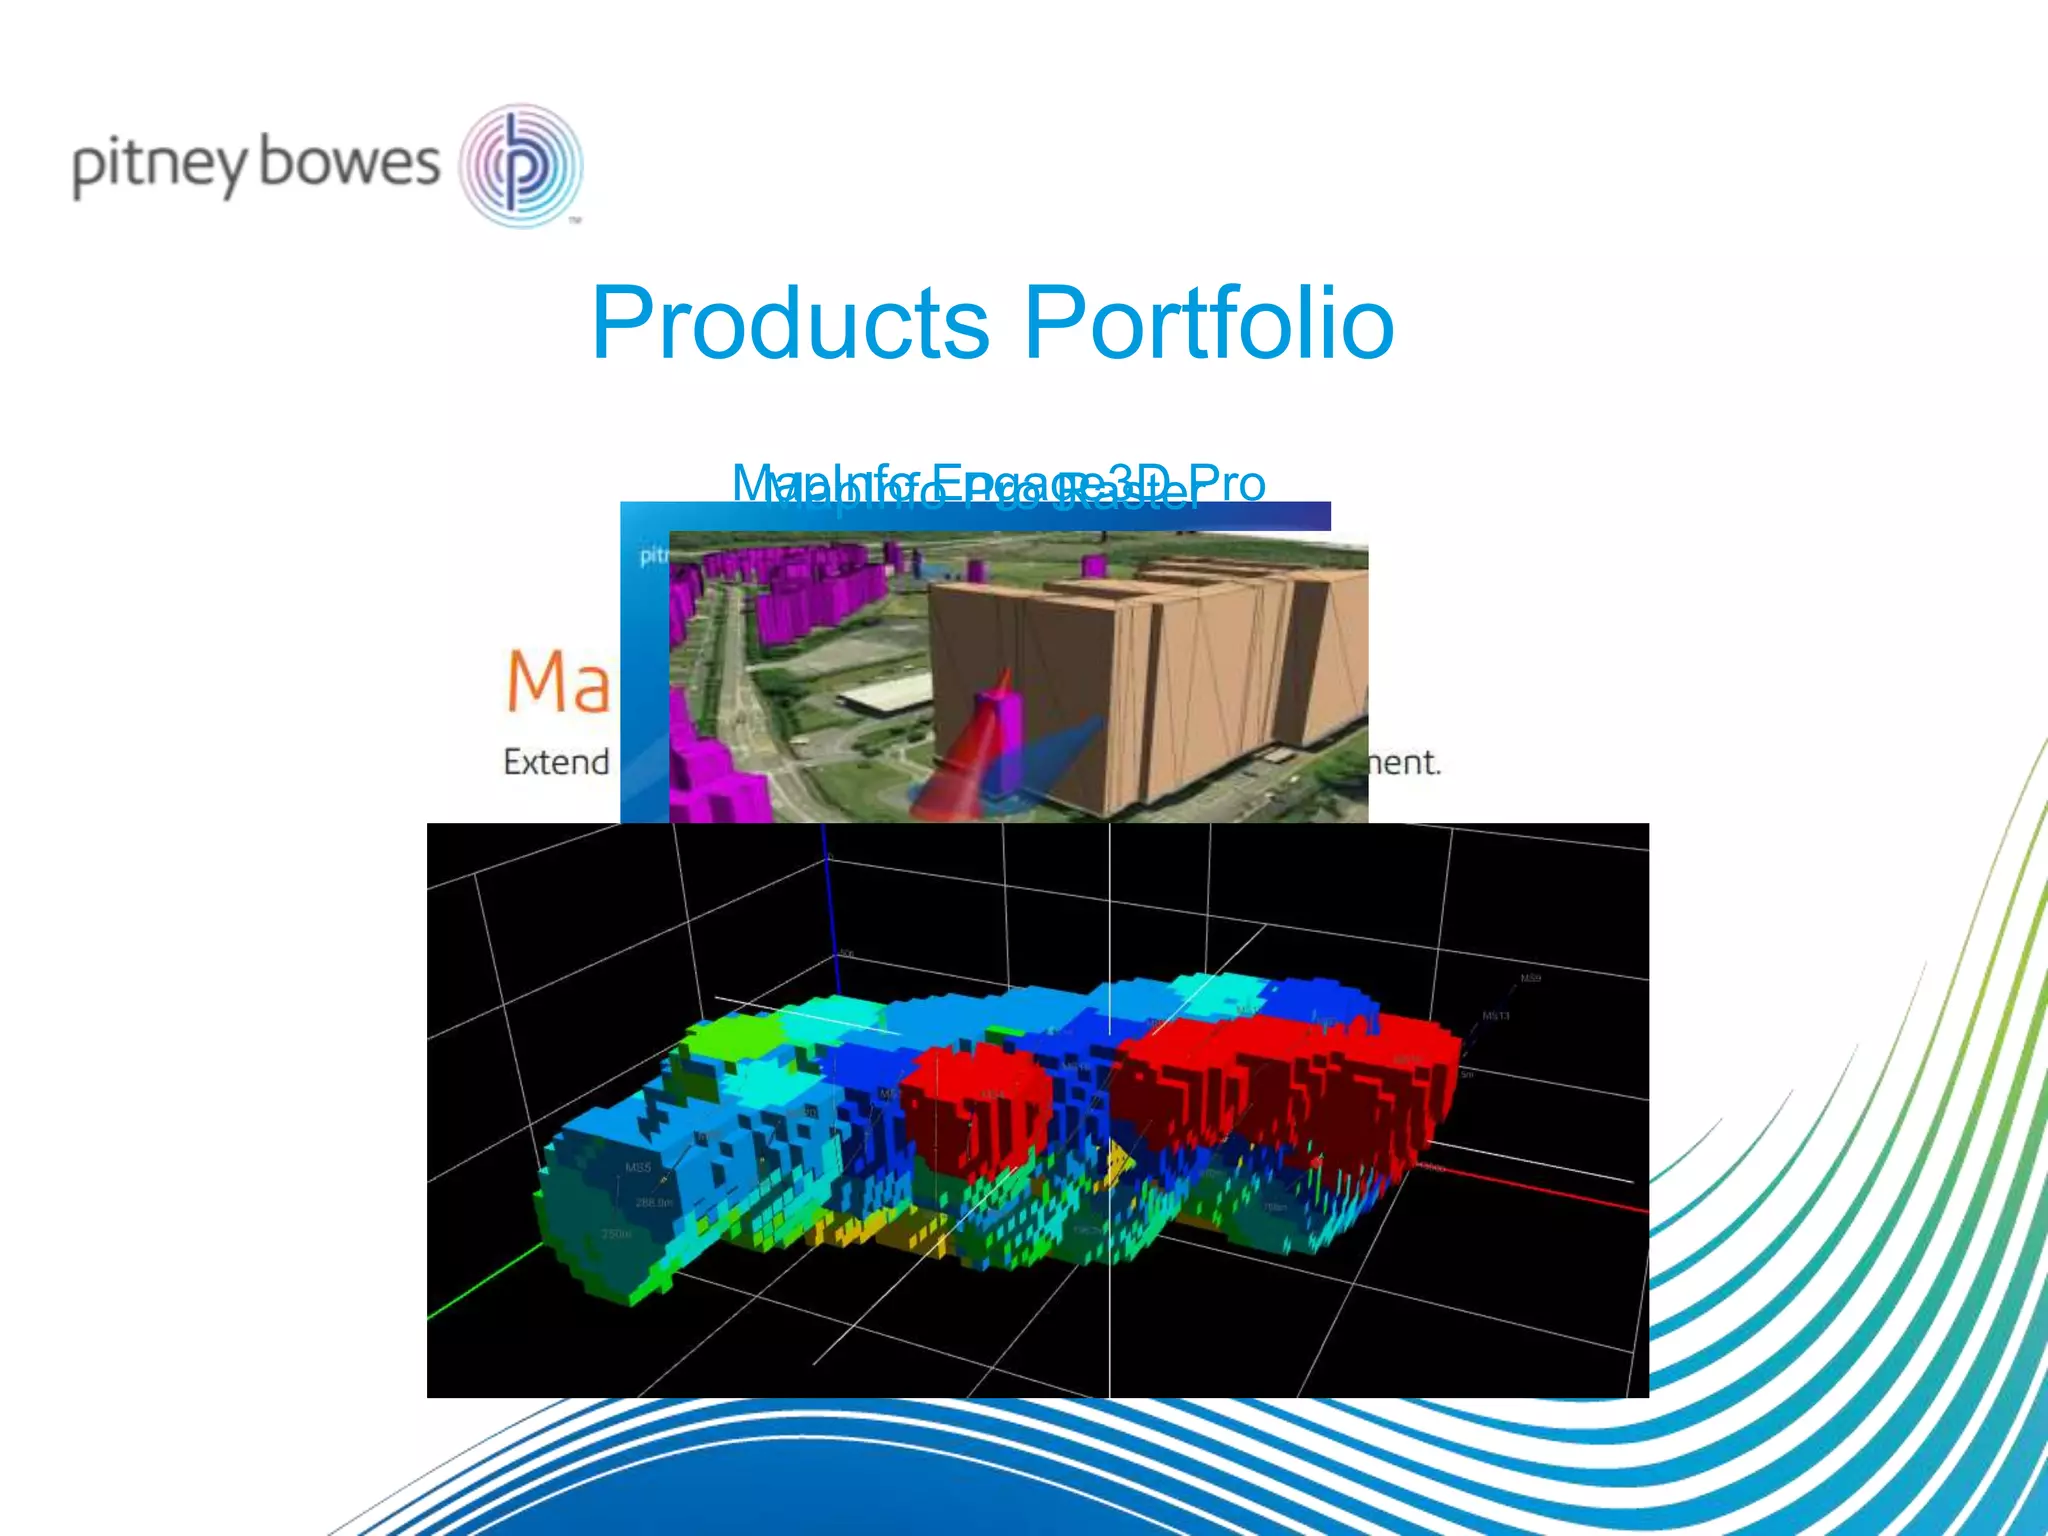
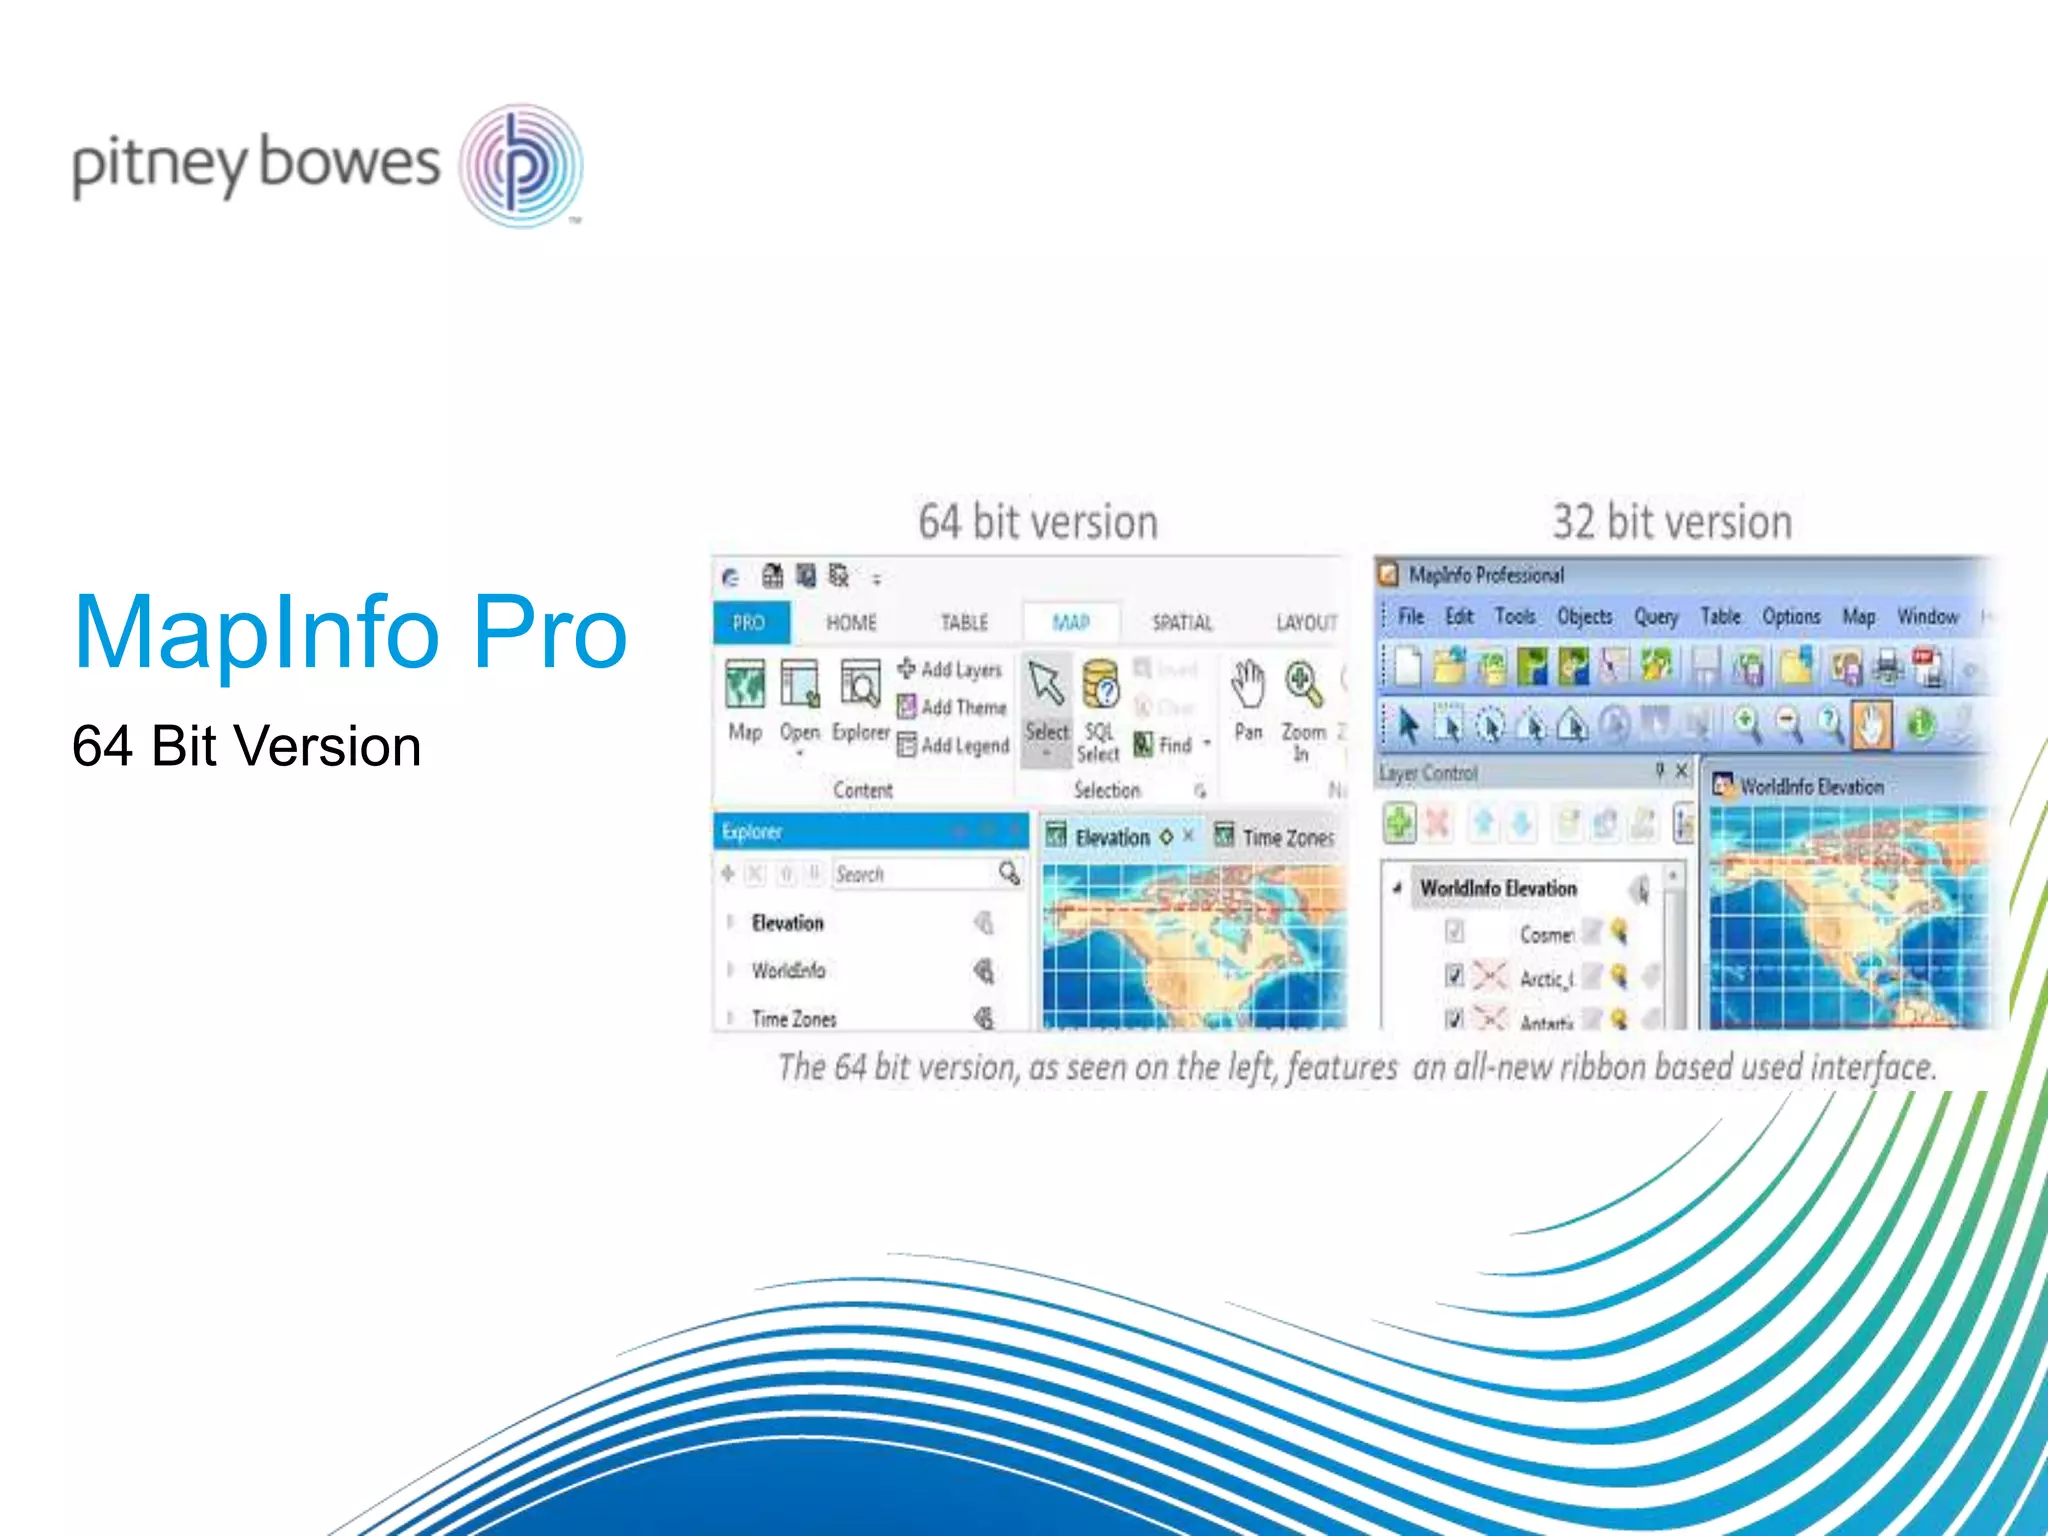
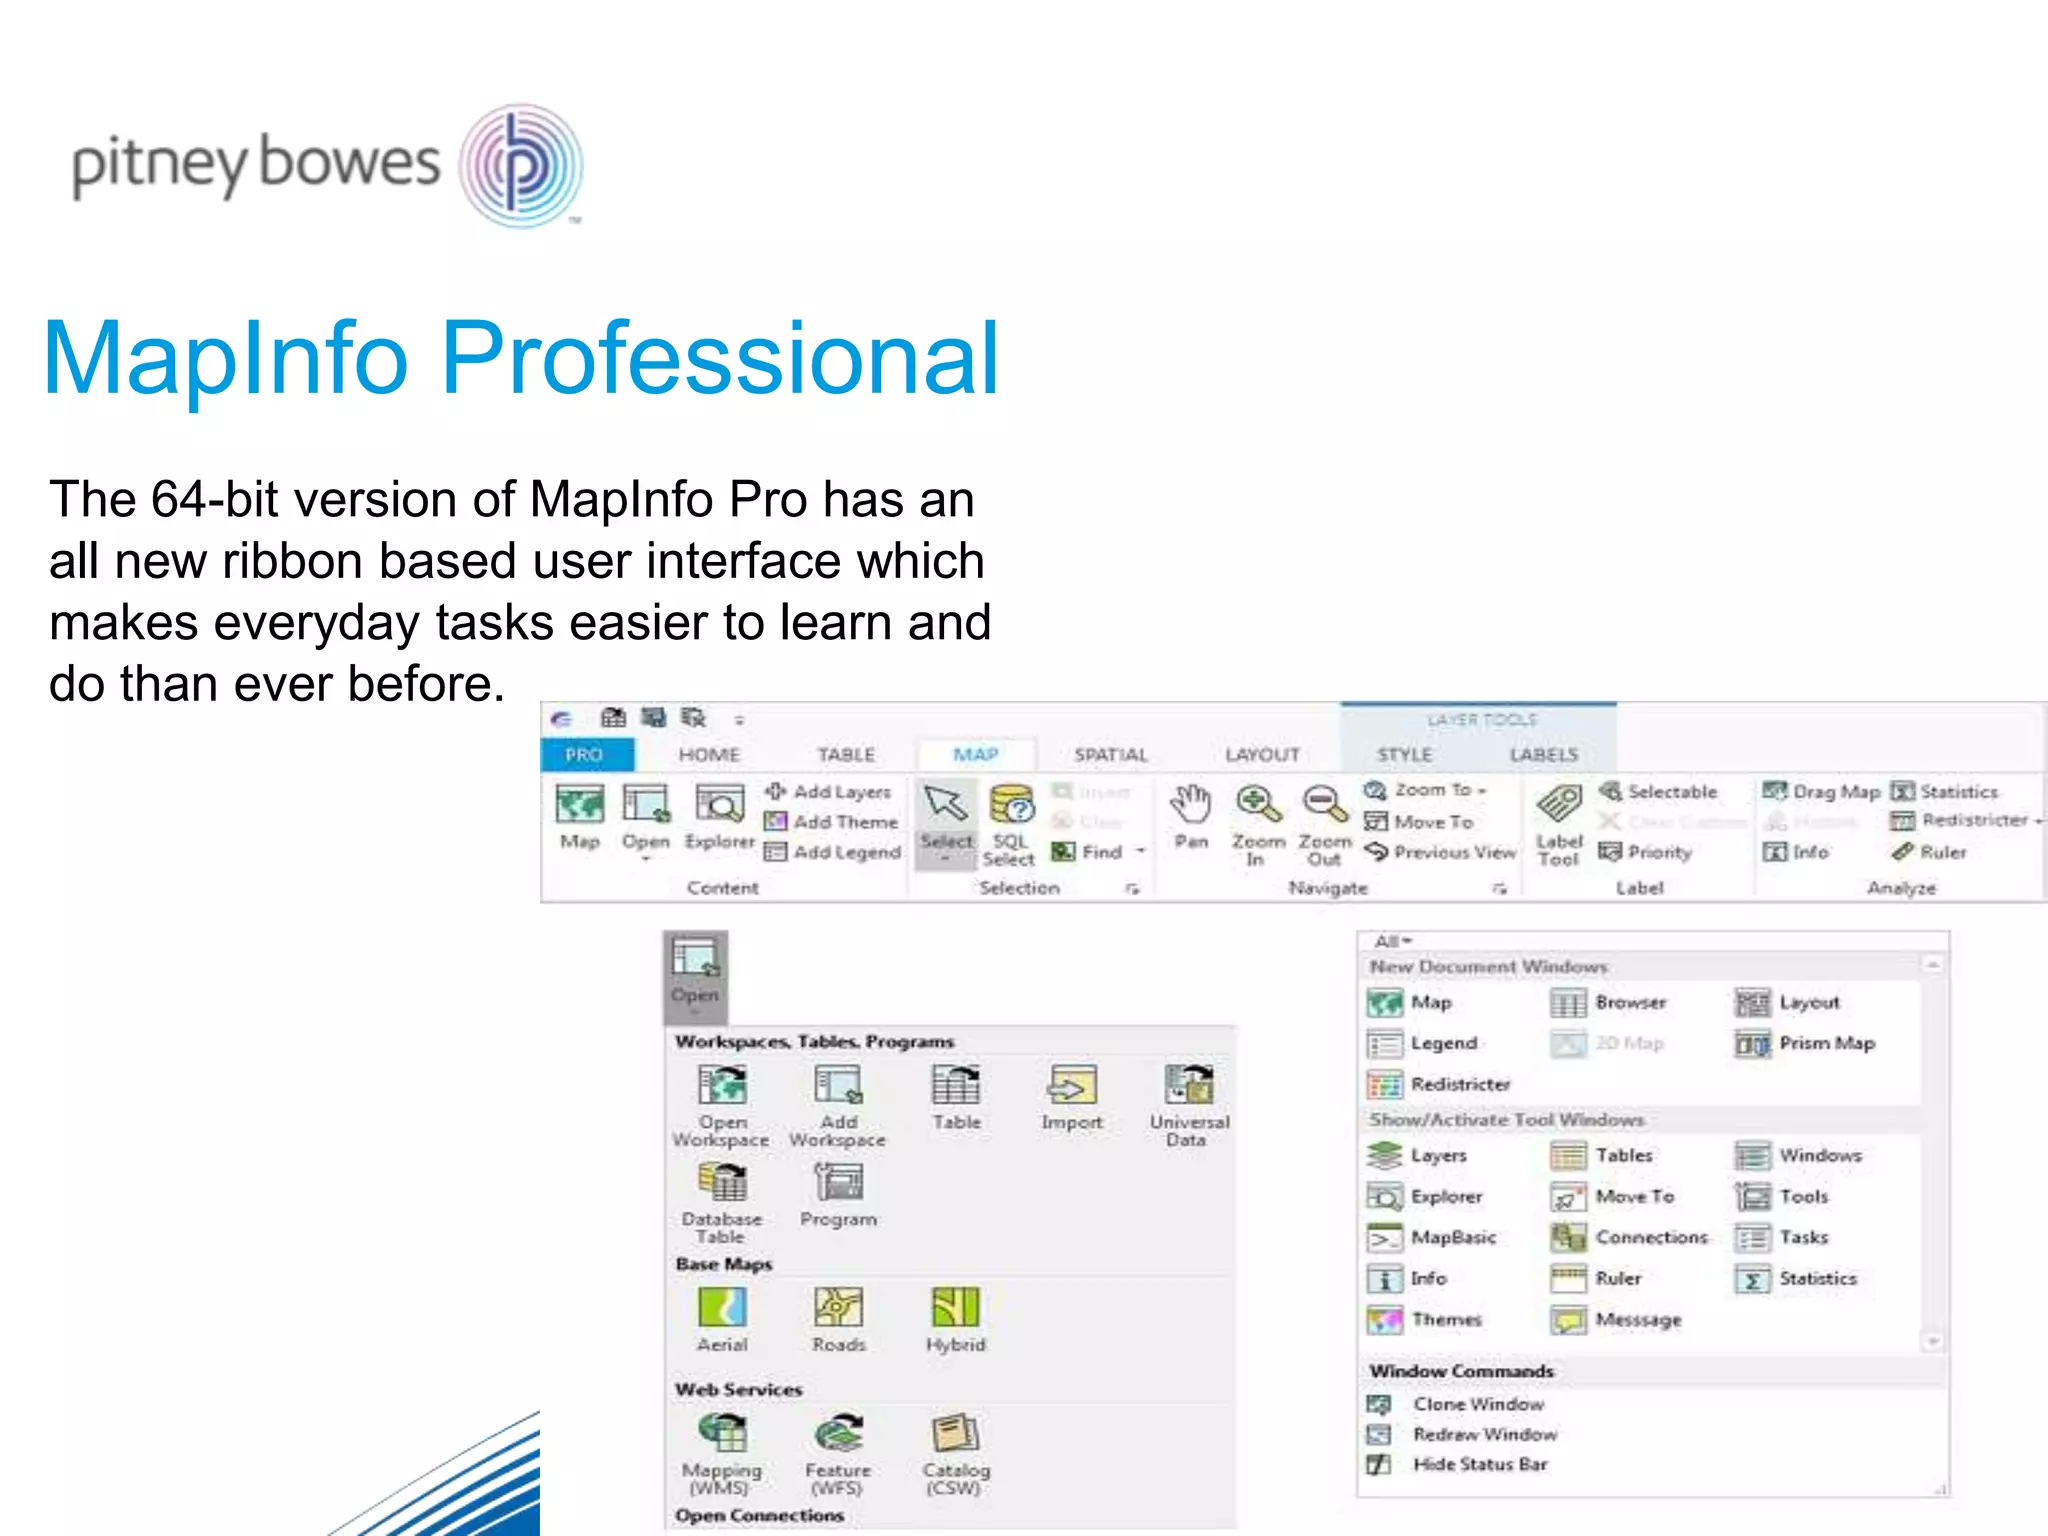
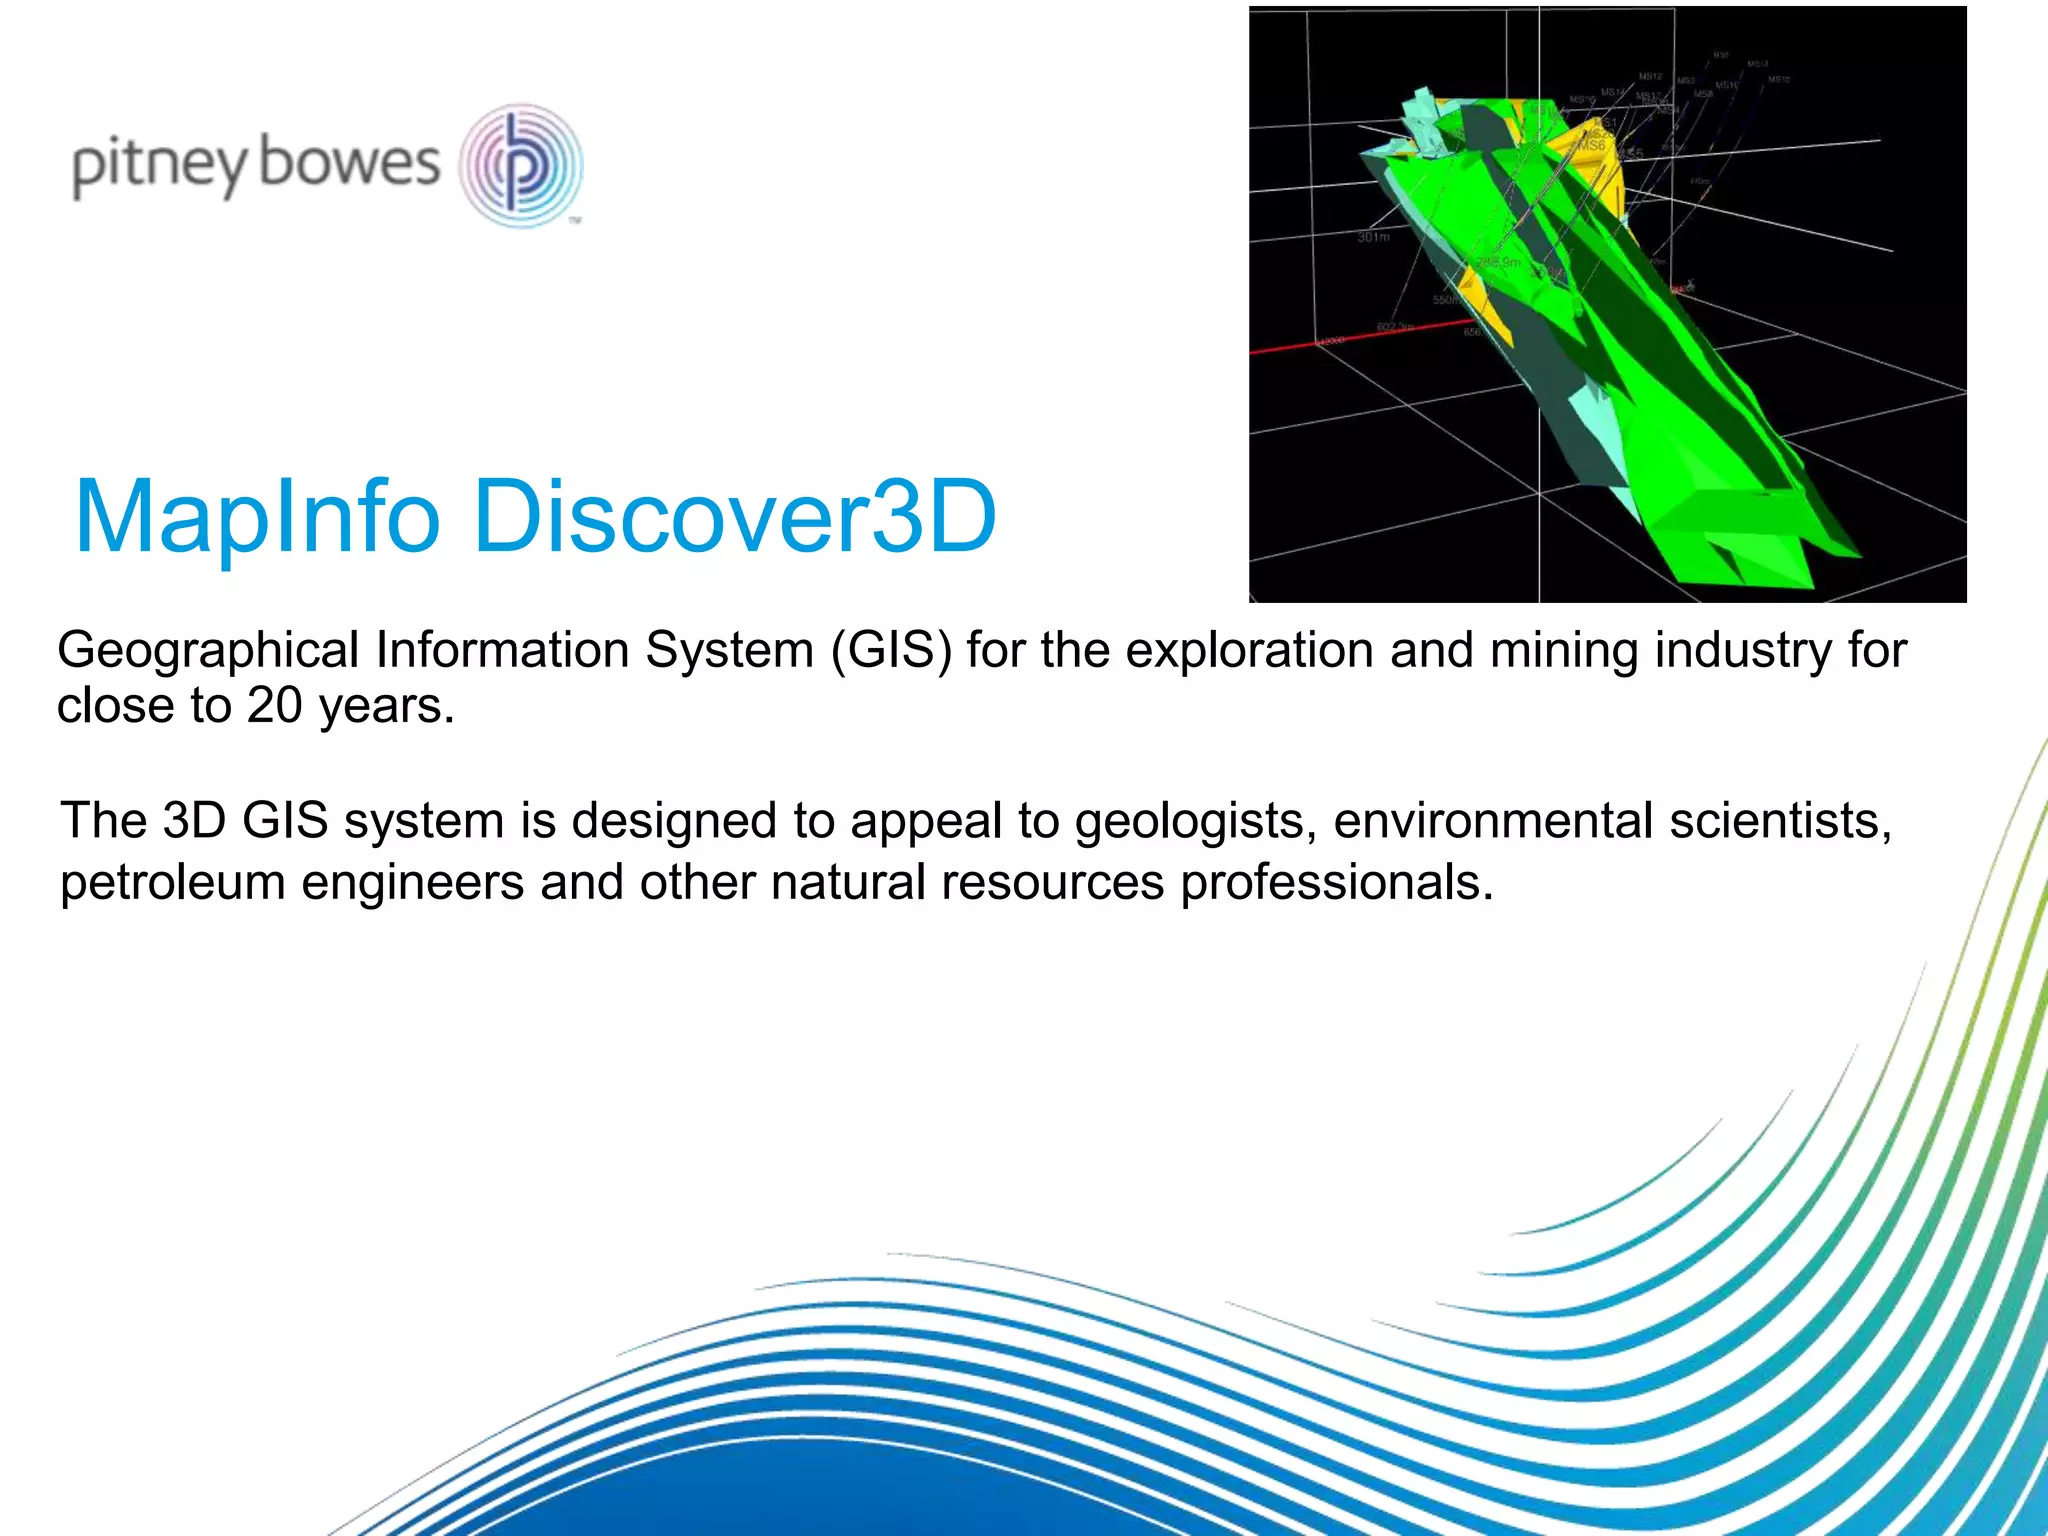
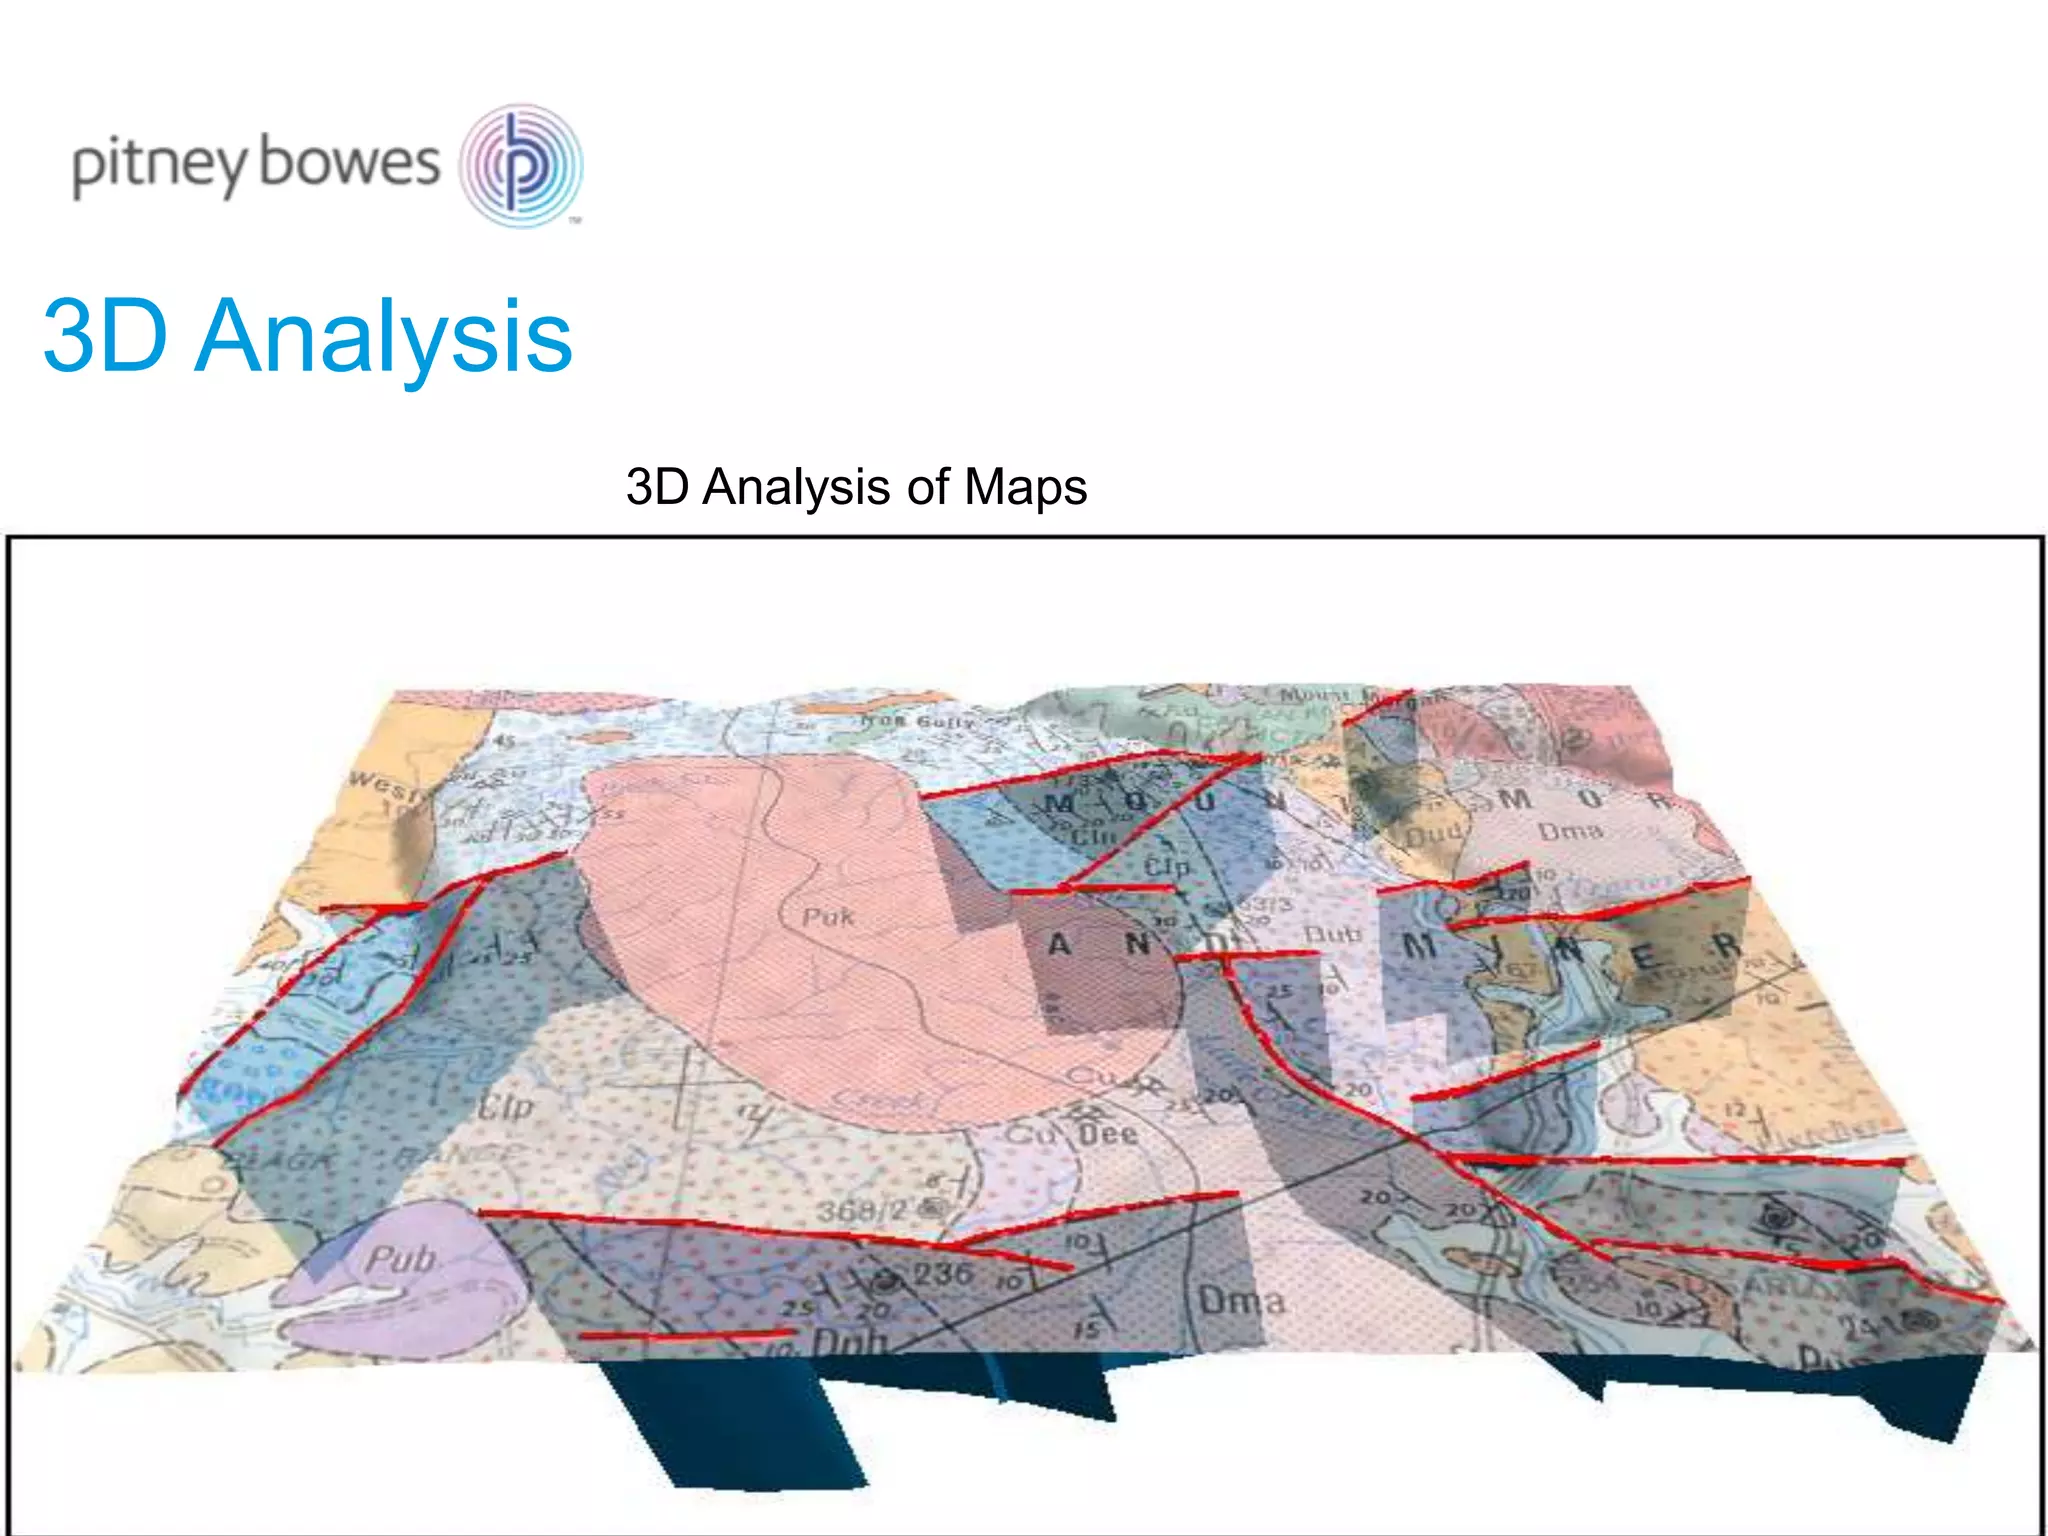
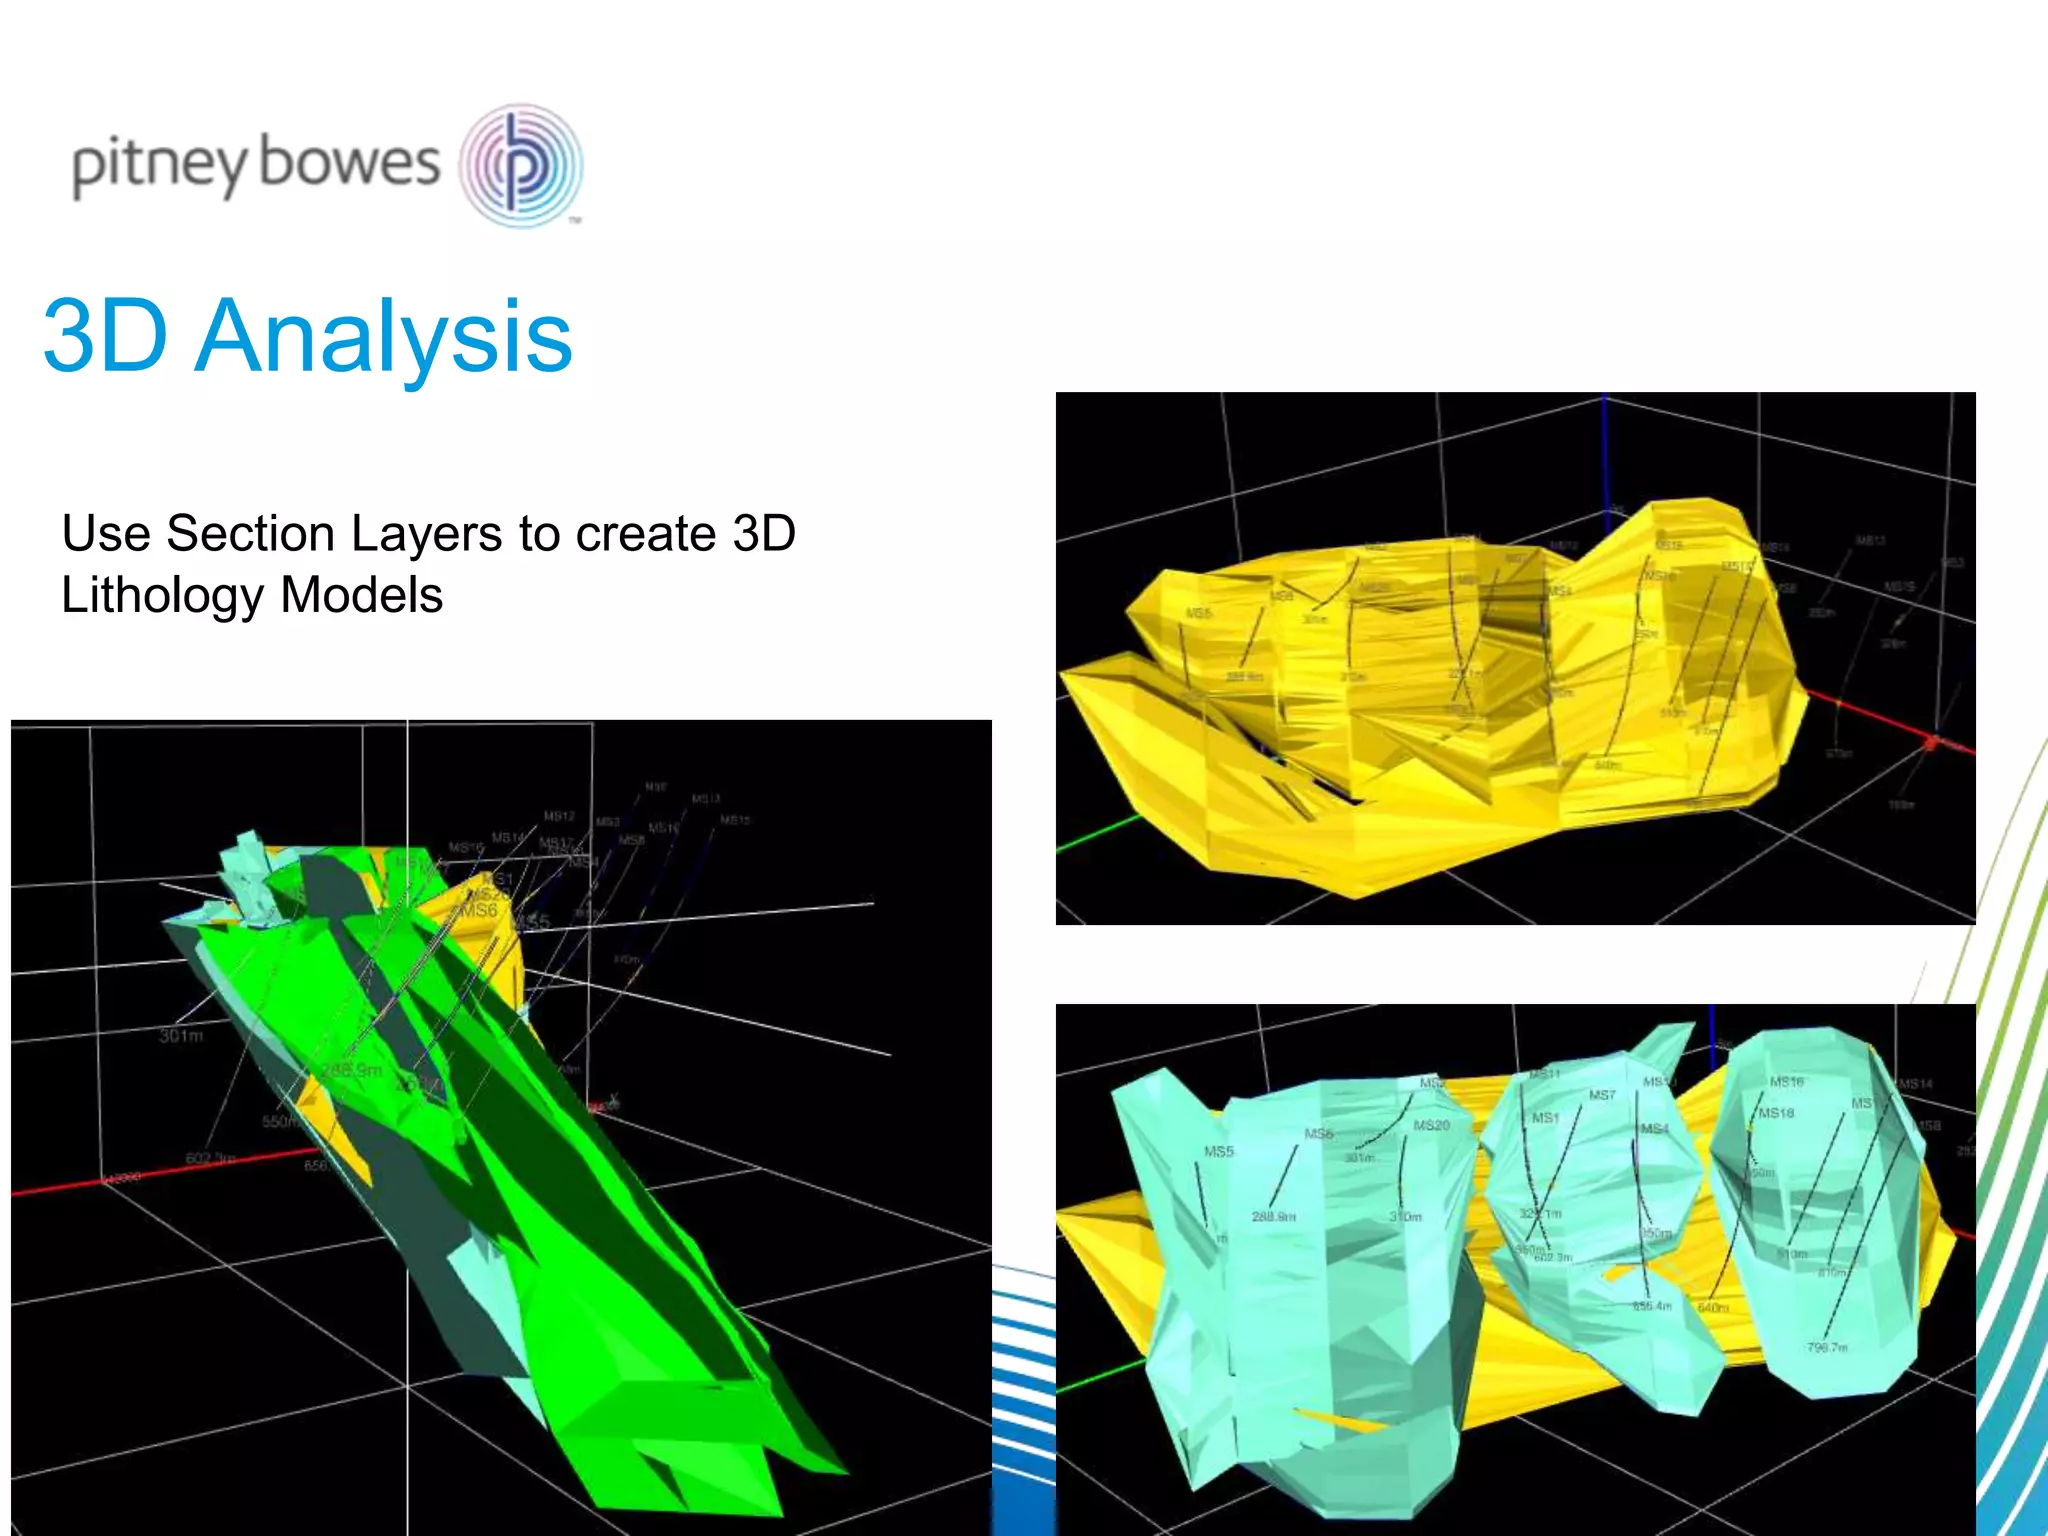
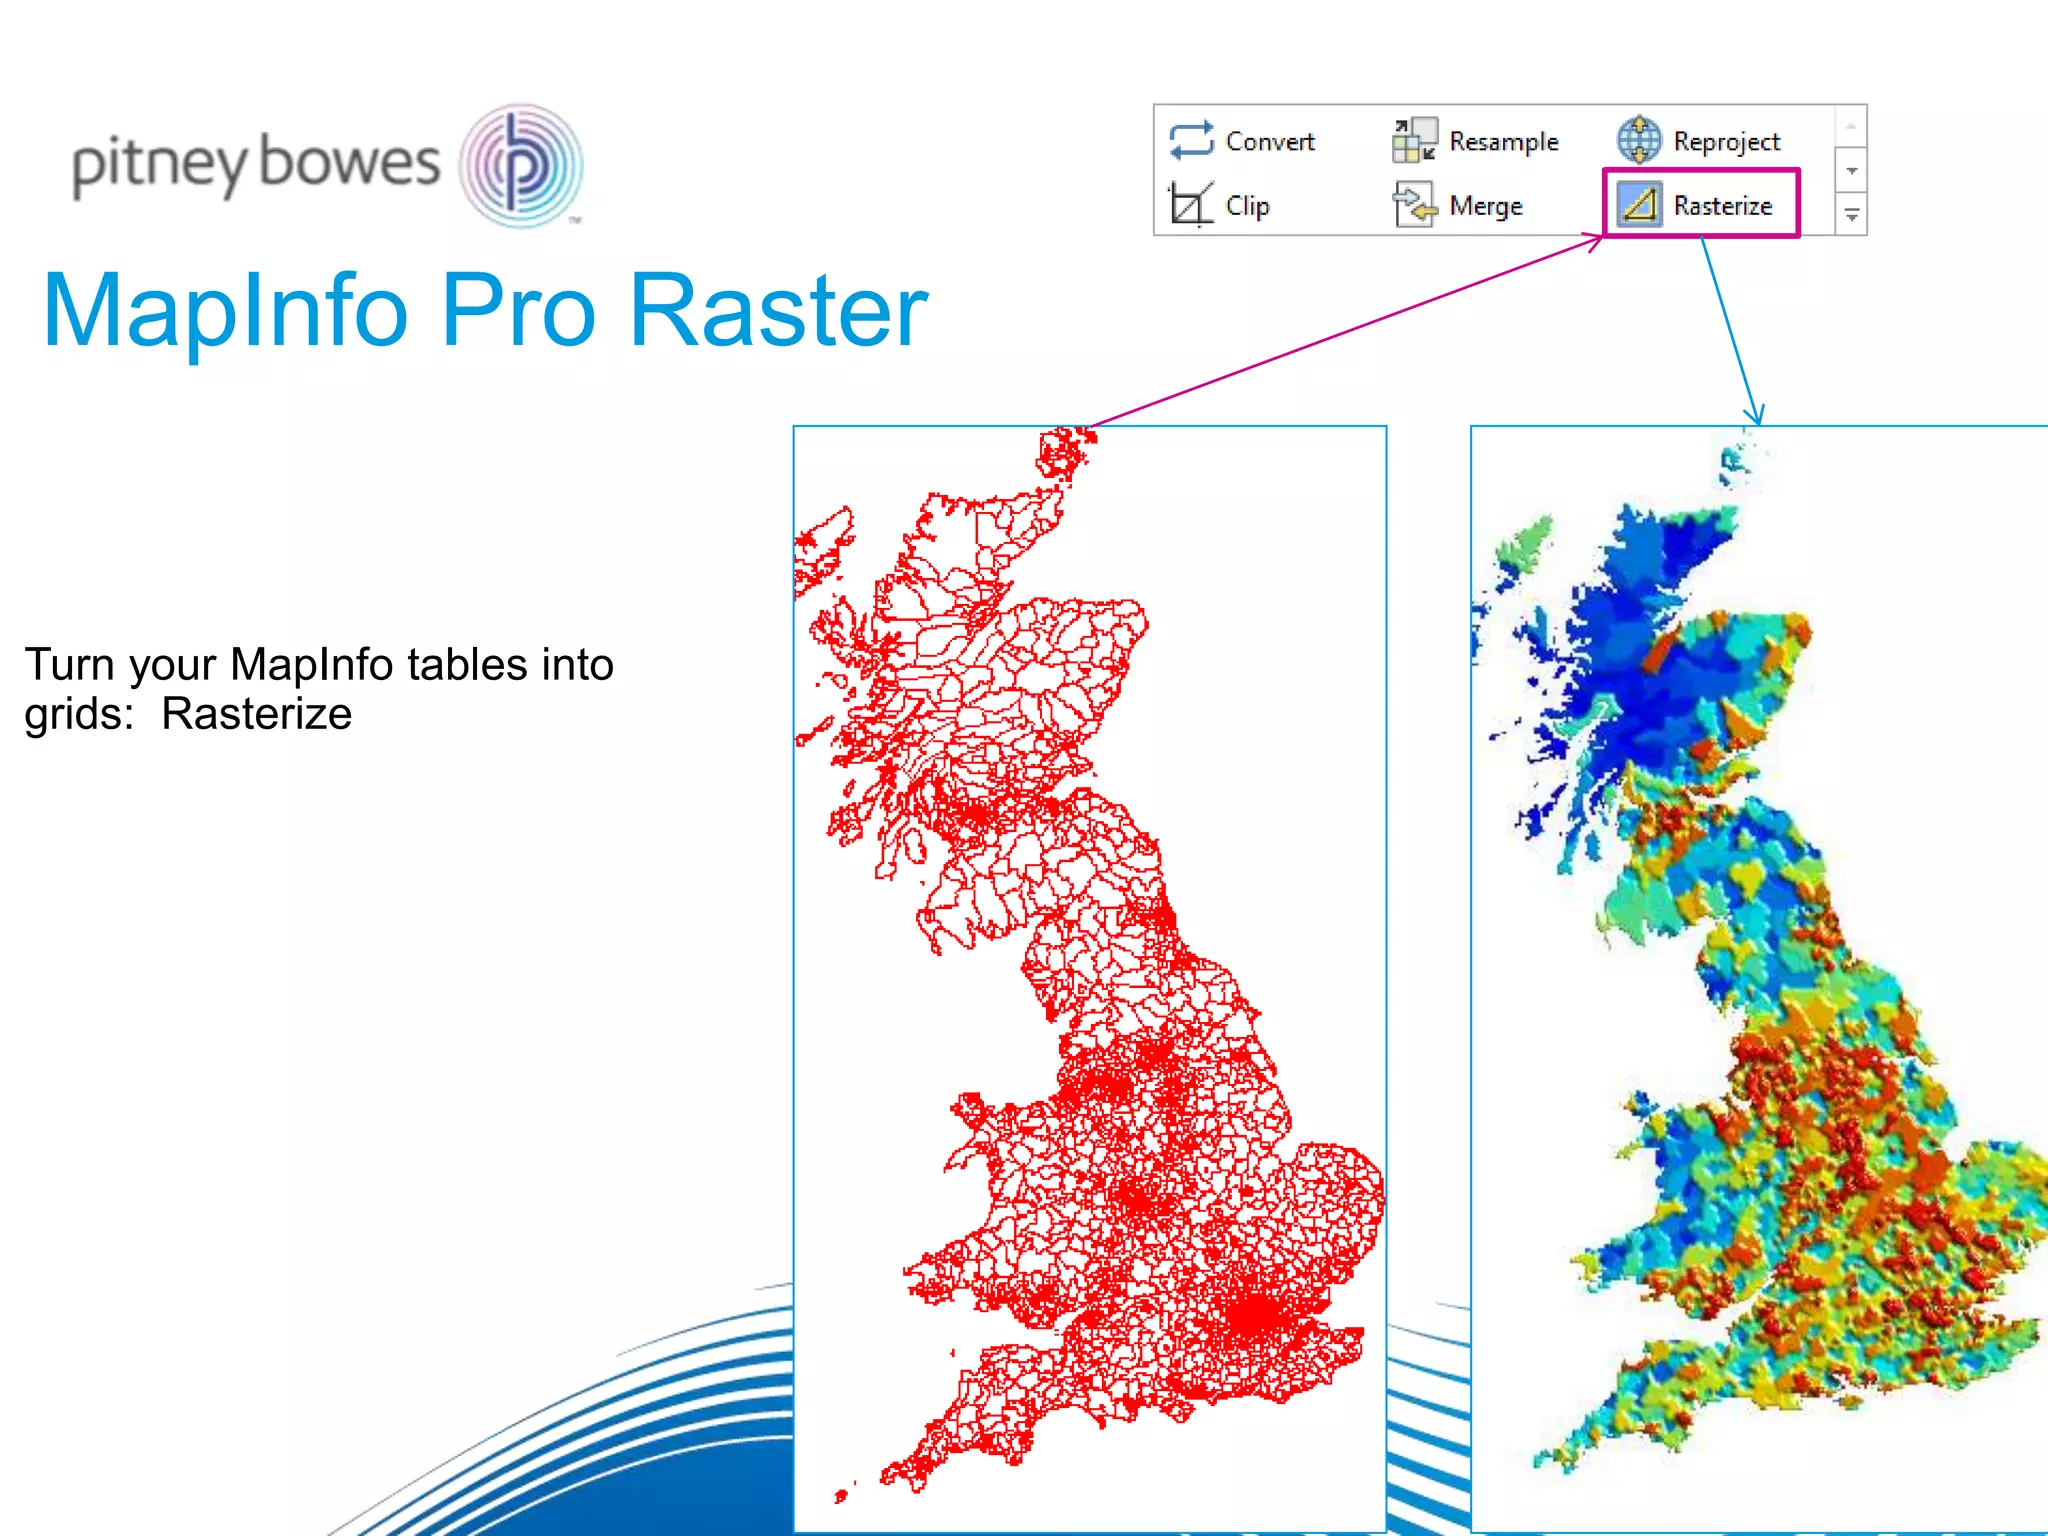
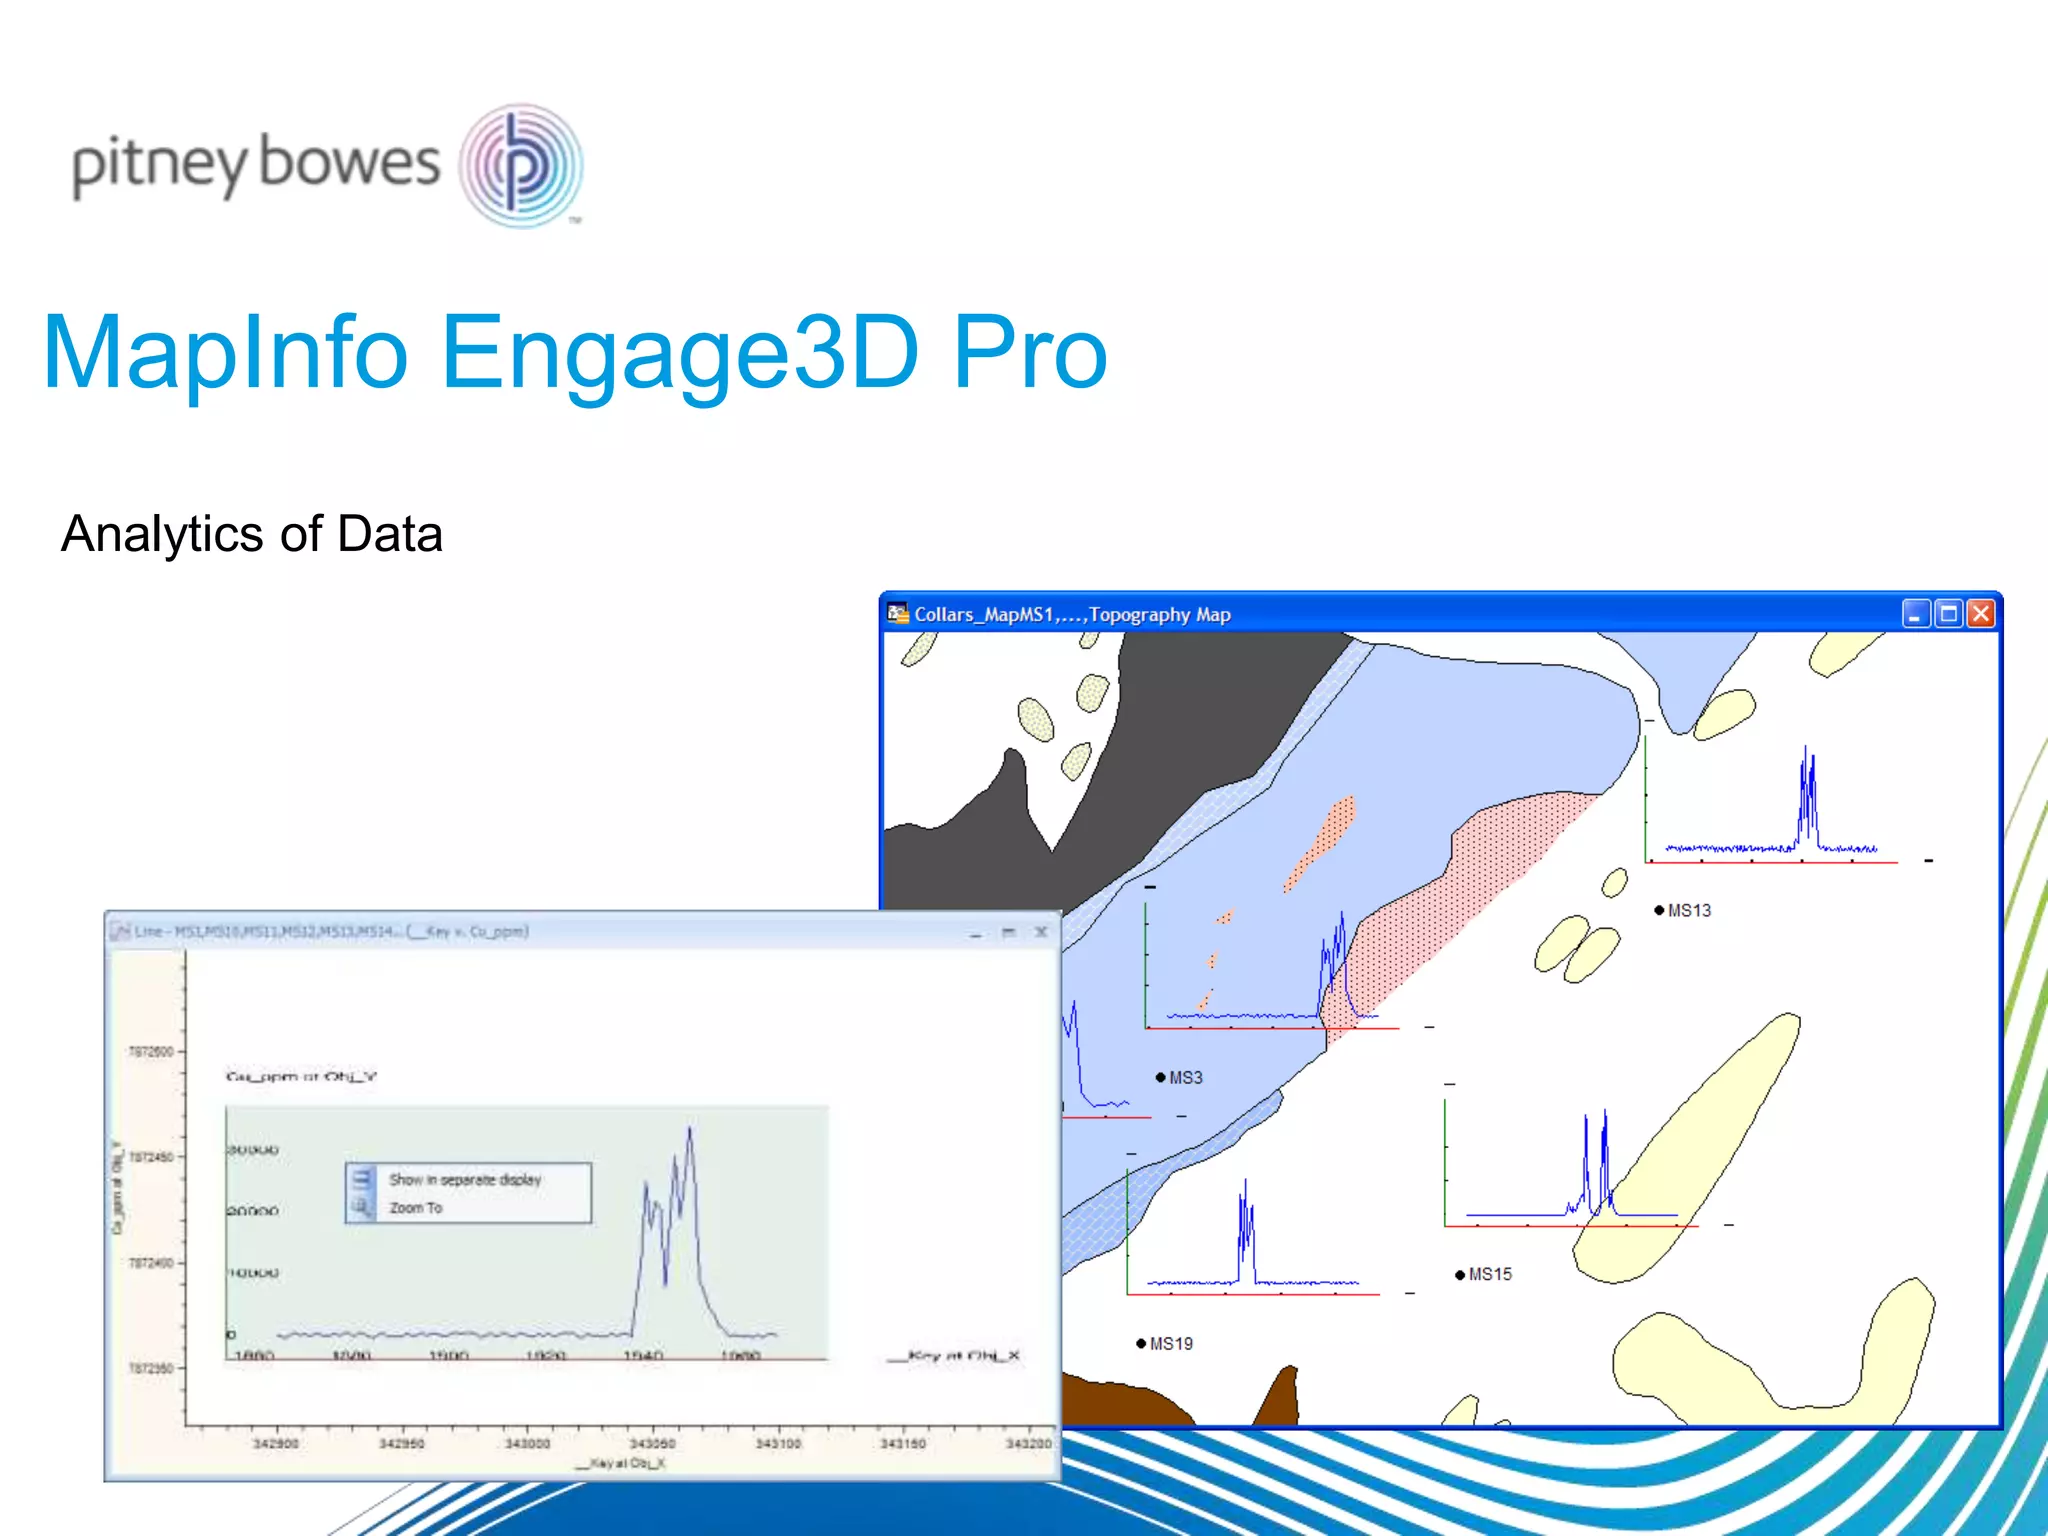
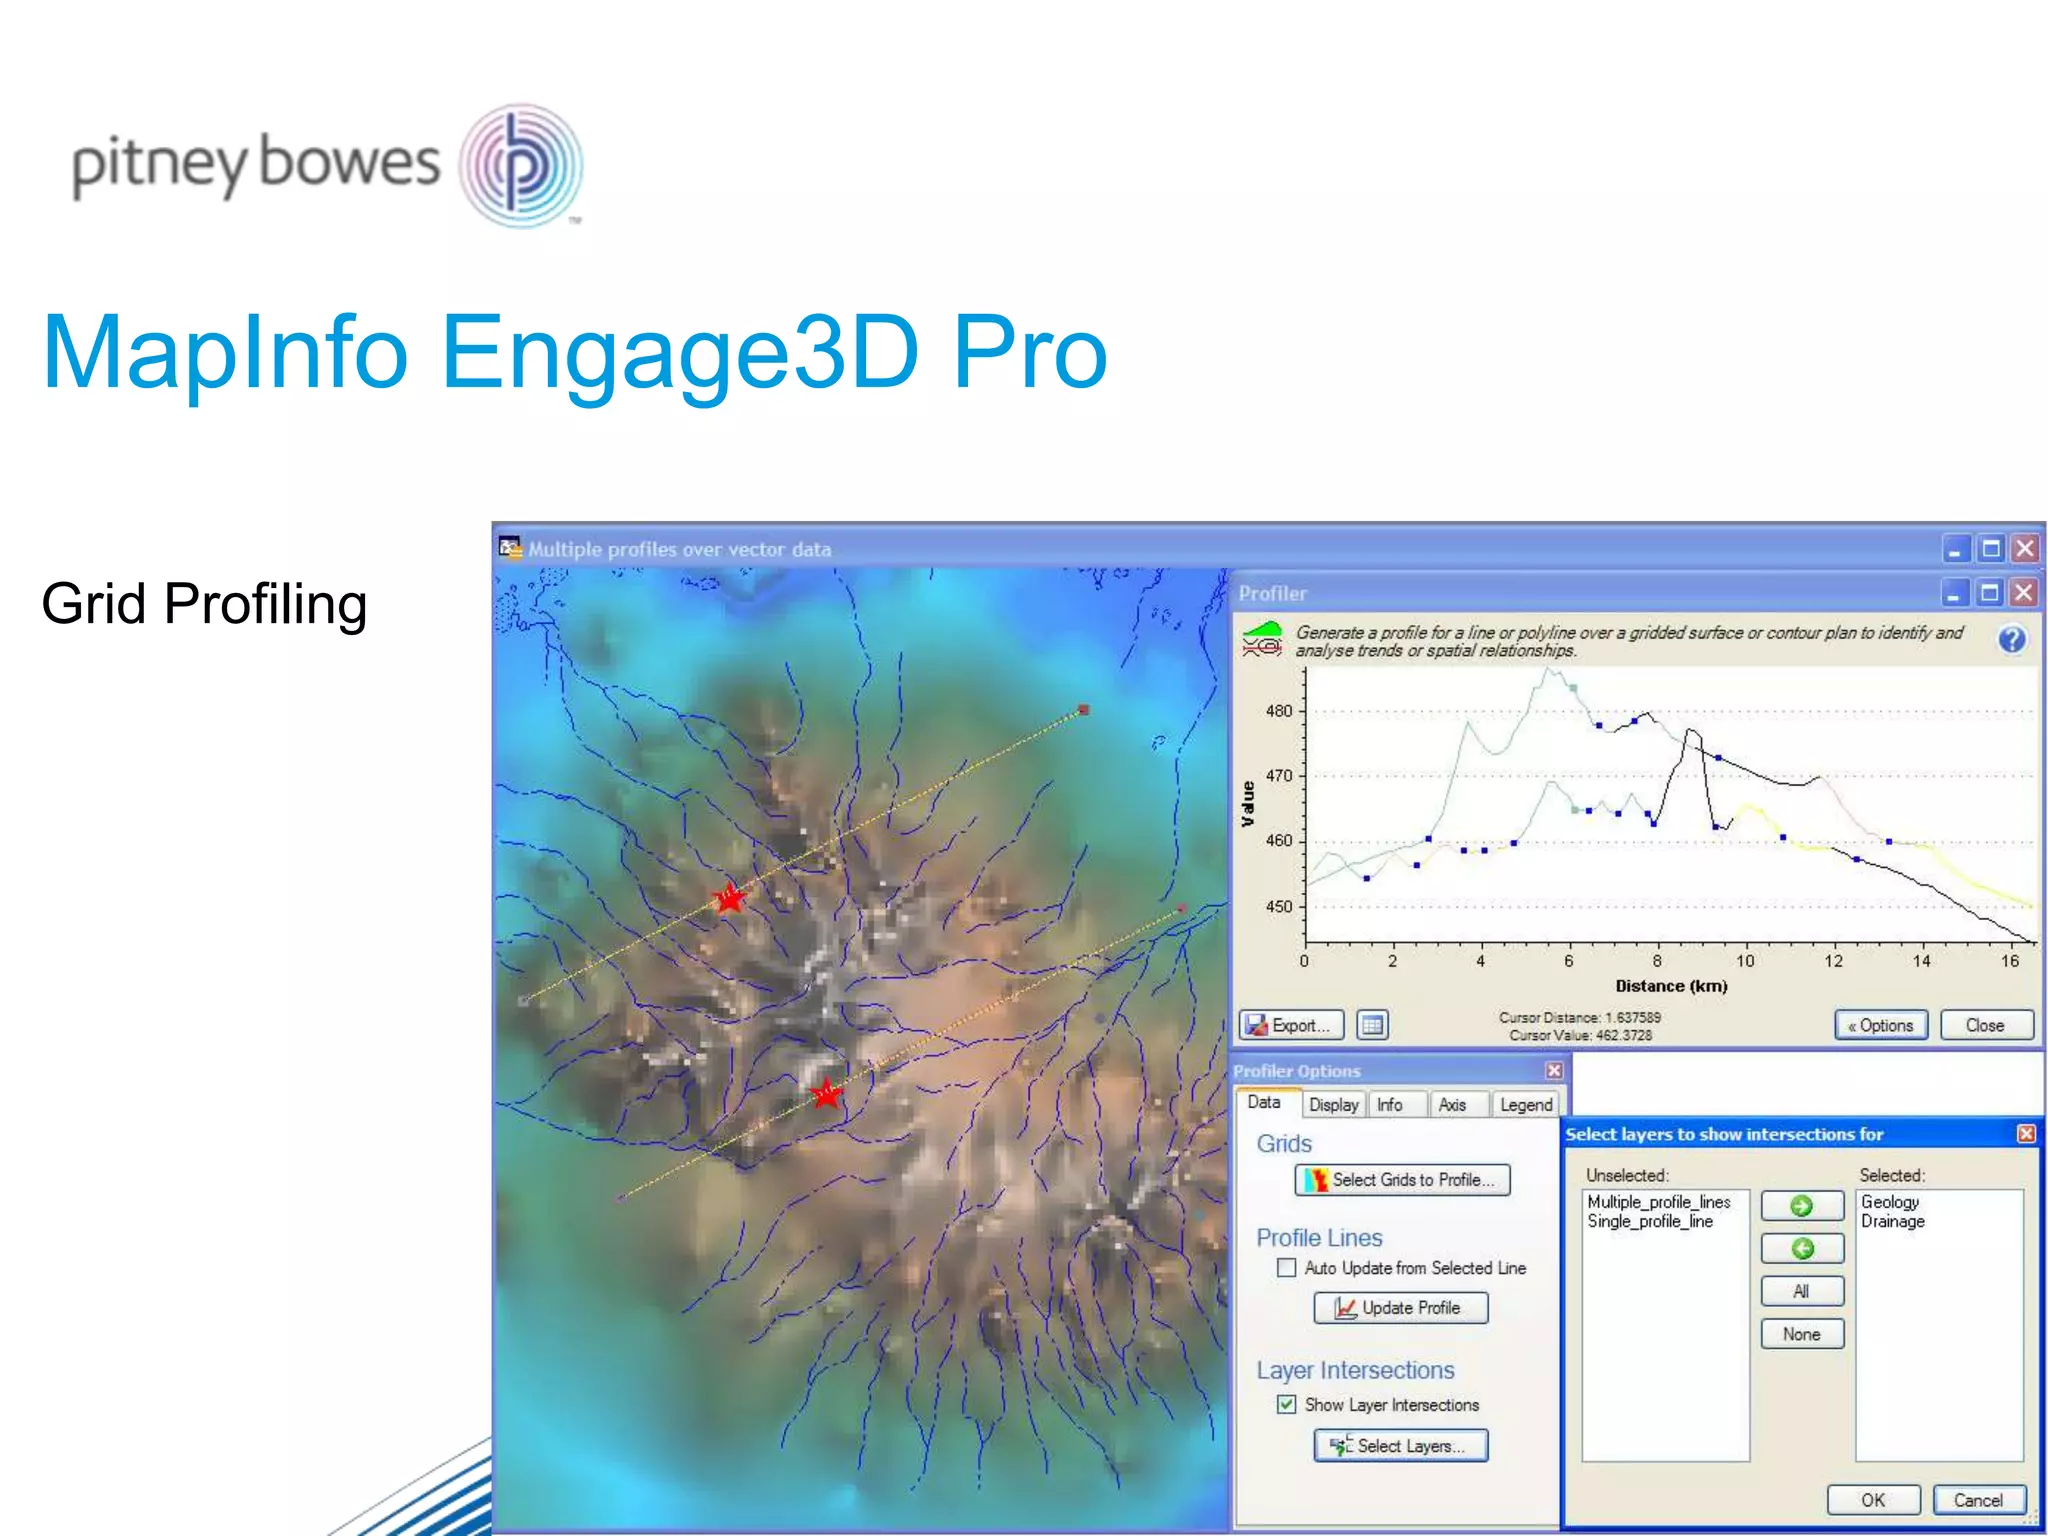
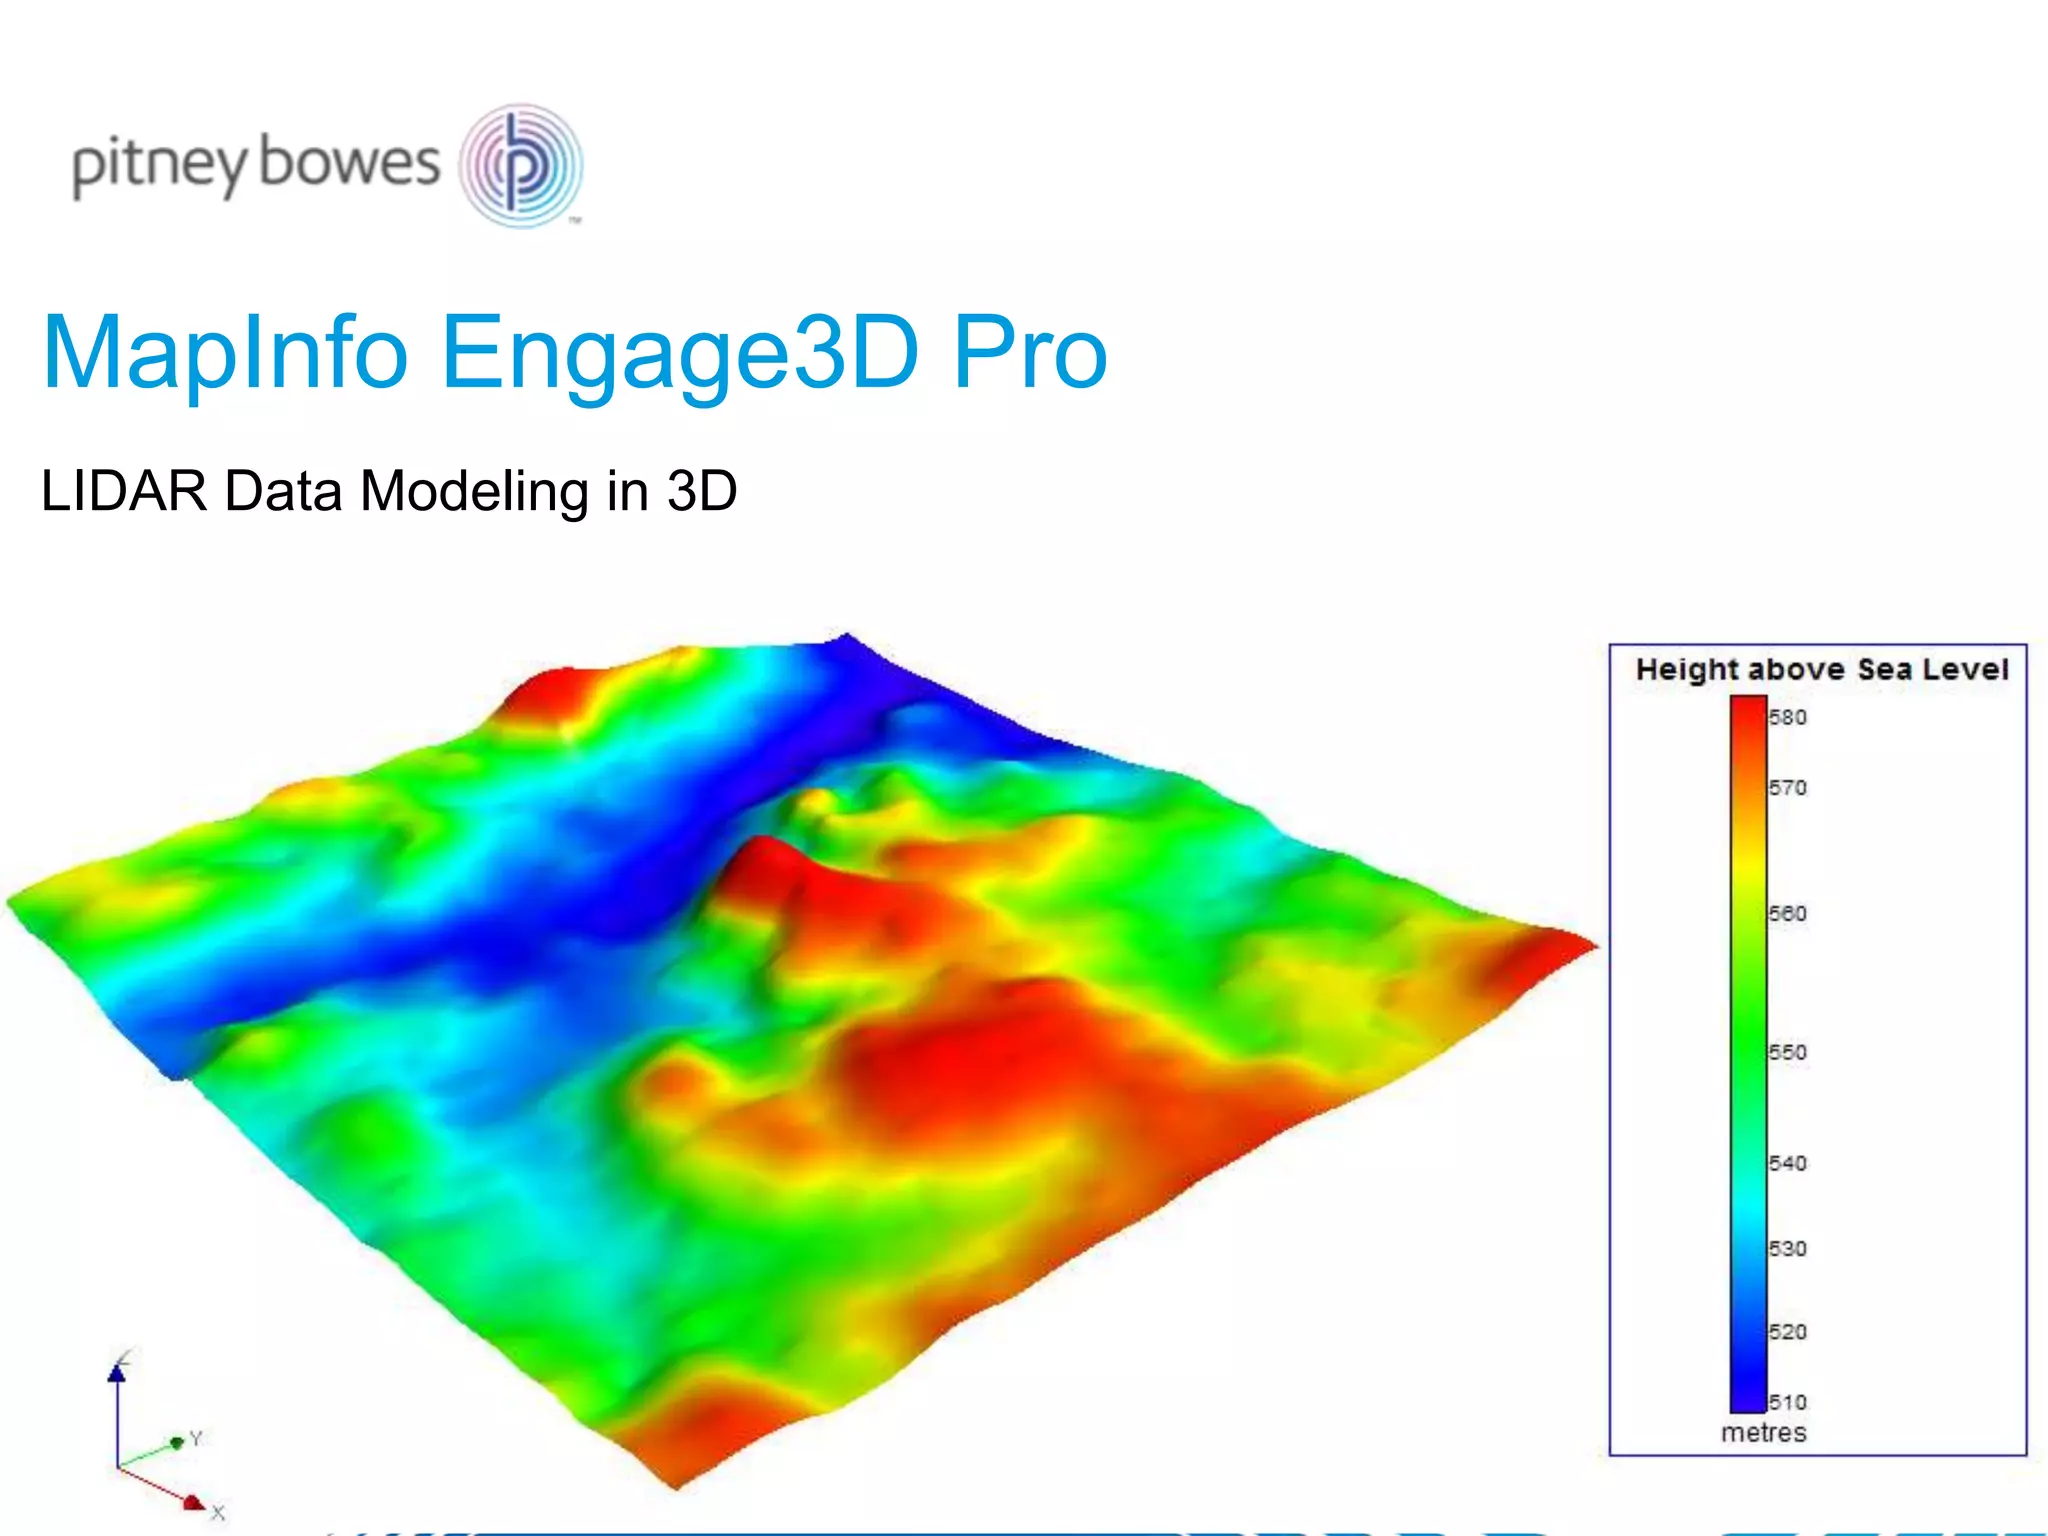
Pitney Bowes Software provides natural resource management solutions including GIS software for mineral exploration, mining, oil and gas, and forestry industries. Their solutions help users discover, evaluate, develop and manage natural assets. Their portfolio includes MapInfo Pro, Discover3D, and Engage3D Pro which provide spatial analysis, 3D modeling, and visualization capabilities for evaluating natural resource assets.
Lidar data is being used widely today for aerial surveys. Drones being the preferred choice for survey, the software Discover3D which is a 3D GIS software, can ingest the .LAS files as point clouds to create surfaces and volume calculations, slope analysis and 3D visualization
MapInfo Professional Discover3D is a complete GIS and geological 3D exploration software package. This is a must have suite to suffice all your exploration needs. The presentation shows a few examples of what the software is about.
MapInfo Professional 12.5 and Discover3D 2014 - A brief overviewPrakher Hajela Saxena
MapInfo Professional and Discover3D is a complete suite of software specifically designed for geoscientists, environmentalists, and geochemists.
The software is being used in various industries today like, environment, mining, exploration, hydrology, etc.
Prepared as part of the IT for Business Intelligence course of MBA @VGSOM, IIT Kharagpur. The tutorial describes how to represent vector data on a map using the open source software QGIS.
In this presentation I'll show how you can take data from the 3D world of MapInfo Pro and show it in the 3D environment of MapInfo Discover 3D.
I'll show this using polygons as well as point data
Concepts and Methods of Embedding Statistical Data into Maps IJSRP Journal
The main focus of this study is to find appropriate and stable solutions for representing the statistical data into map with some special features. This research also includes the comparison between different solutions for specific features. In this research I have found three solutions using three different technologies namely Oracle MapViewer, QGIS and AnyMap which are different solutions with different specialties. Each solution has its own specialty so we can choose any solution for representing the statistical data into maps depending on our criteria’s.
Prepared as part of the IT for Business Intelligence course of MBA @VGSOM, IIT Kharagpur. The tutorial describes how to create an interactive map using the open source software QGIS.
TeleCAD-GIS is a scalable, Autodesk-based, CAD/GIS solution for both national and regional telecommunications infrastructure networks planning, design, documenting and maintenance. It provides valuable tools targeting customer-owned outside plant design; OSP right-of-way and route design; OSP space design; underground, direct-buried, and aerial plant design; OSP cabling hardware and OSP grounding, bonding and electrical protection systems; automated switching and support systems design, etc.
Introduction to mago3D, an Open Source Based Digital Twin PlatformSANGHEE SHIN
This talk was given at the Busan Eco Delta City(Korea National Pilot Smart City) technical workshop held on 18th July. I talked about introduction and history of mago3D, some core technologies, real cases, and lessons learnt in this workshop.
MapInfo Pro v2023: The Next Dimension in Spatial AnalyticsPrecisely
Unlock the next dimension in spatial analytics with MapInfo Pro v2023. Watch this presentation from the MapInfo Pro experts as they discuss and demonstrate the new functionality including:
· 3D visualisation (both 3D map creation and 3D map viewing)
· Integration with Spectrum Spatial via a feature service
· User-requested usability improvements
· New tools in the MapInfo Marketplace
Plus, learn about the useful resources that are available to help you with your day to day work.
The Gorbals in Relief: Experiments in OpenStreetMap and Architectural Practic...duncanbain
Slides from my presentation to the State of the Maps Scotland conference a the Inspace Gallery in Edinburgh on Saturday 12th October. The presentation covers 3D building tags in OpenStreetMap, creating 3D models from open data, and how architects might incorporate OpenStreetMap in their practices and how they can give back to the open data movement in return. A video of the presentation can be found at http://www.youtube.com/watch?v=CklS1QkNT48
Scaling Spatial Analytics with Google Cloud & CARTOCARTO
In this webinar, we focus on how Google Cloud and CARTO can be used to tackle even the most challenging Location Intelligence use cases at scale. You can watch the recorded webinar at: https://go.carto.com/webinars/google-cloud-spatial-analytics-at-scale
Top 10 Features Landscape Design SoftwareLands-Design
Landscape Design Software main features to look for by Landscape Architects, Urban Planners, Gardeners...
Principales características que los arquitectos paisajistas, urbanistas y jardineros deben buscar en los programas de paisajismo
In questa presentazione, tutte le novità e una carrellata completa degli strumenti software del Power Portfolio 2016 di Hexagon Geospatial™.
La release 2016 dei software ERDAS IMAGINE, ERDAS APOLLO, Geomedia e di tutti gli altri strumenti software del Power Portfolio di Hexagon Geospatial è stata presentata ufficialmente il 14 giugno 2016, durante l’evento Hexagon Live di Anaheim (California).
Il Portfolio si compone di tre suite: Producer, Provider e Platform, costituite da prodotti software allo stato dell’arte ed utilizzati in tutto il mondo, che combinano le migliori tecnologie attualmente disponibili nel settore del telerilevamento, della fotogrammetria, del GIS ed in generale per la gestione di dati geospaziali.
Guarda il video e scarica il documento in italiano sulle novità della release 2016 su:
http://www.planetek.it/news_eventi/archivio_news/2016/06/presentato_il_nuovo_power_portfolio_2016_di_hexagon_geospatial
Leios 2 provides the easiest, fastest, most powerful and aordable route from your 3d scanner to your CAD, making elaboration of 3D scans, editing of triangle meshes and tting as easy as ever.
With Leios it's possible to acquire datasets from any kind of 3D scanner, to transform the point cloud into a NURBS mathematical model easy and quickly with complete control of each step and to analyze the results with powerful inspection tools.
Lessons learned building a big data analytics engine, from proprietary to ope...J On The Beach
Lessons learned building a big data analytics engine, from proprietary to open source by Álvaro Santamaria & Joel Brunger
After spending four years building a proprietary all-in-one streaming analytics engine for financial services, it became clear that open-source was starting to pull ahead. Alvaro will talk about the challenges of creating an IT operations solution for financial services; what to build, what not to build, and how to use open source tools to get past the infrastructure and focus on the business problems that matter.
GIS 5103 – Fundamentals of GISLecture 83D GIS.docxshericehewat
GIS 5103 – Fundamentals of GIS
Lecture 8
3D GIS
Dimensionality
A dimension is the minimum amount of coordinates needed to define the mathematical space of an object.
Lecture 8 – 3D GIS
2DA figure that has only length & height as its dimensions. 2D shapes lie on a flat surface; known as plane figures or plane shapes. While they have areas, 2D shapes have no volume.2D figures are plotted on two axes, the x- and y-axes.
Lecture 8 – 3D GIS
3DLength + Height + WidthX + Y + Z Volume + Surface AreaExamples include: 3D multi-patch building, roof, interior floors, and foundation would all contain different z-values for the same 2D coordinate. Aircraft's 3D position or a walking trail up a mountain, would only have a single z-value for each X,Y location.
Lecture 8 – 3D GIS
2.5DHighly used in GIS to represent Z data that is not continuous = 3DZ data does not need to be elevation. Pollution, # of cases, etc.
Lecture 8 – 3D GIS
3D file types .3dd.sxdWhen you import an ArcGlobe or ArcScene document:First the .3dd file opens by default in global mode Secondly the .sxd file opens in local mode. Any new blank scene view defaults to global mode.
Lecture 8 – 3D GIS
Data TypesVector FeaturesPoint / Line / Polygon Surface typesTIN (Triangular Irregular Networks)DEM’s (Digital Elevation Models)Raster SurfaceLAS Dataset
Lecture 8 – 3D GIS
3D StylesPointsGeometric ShapesModelsMarkersImportedLinesTextured SymbolsGeometric ShapesPolygonsTexture FillBasic Colors
Lecture 8 – 3D GIS
Lecture 8 – 3D GIS
Perspective ViewPerspective drawing is the most common drawing mode in 3D, where features in the foreground are shown larger than those off in the distance. This matches the way we see the world in our day-to-day lives, and the result is a realistic representation of 3D content. All scenes open in perspective viewing mode. You can switch between Perspective Perspective View and Parallel Isometric View viewing modes using the Drawing Mode drop-down menu in the Scene group on the View tab.
Lecture 8 – 3D GIS
Parallel / Isometric ViewParallel drawing renders the 3D view using a parallel projection, where features of the same physical size are rendered on-screen identically, regardless of their distance from the viewing camera. Parallel drawing is useful for architectural drawings, as well as for representing statistical data in a 3D view, such as extruded shapes symbolizing numeric values.
Lecture 8 – 3D GIS
3D Analyst ToolsData Conversion/PreparationTxt / Binary / Feature class / Raster / TINSurface CreationInterpolation / LASD CreationSurface AnalysisAspect / Slope / Contour / Feature Interpolation3D Operator & VisibilitySkyline / Inter-visibility / Sun Shadow Analysis
Lecture 8 – 3D GIS
There are five exploratory analysis tools:The Line of Sight tool creates sight lines to determine if one or more targets are visible from a given observer location.The View Dome tool determines the parts of a sphere that are visible from an observer locate ...
In this presentation, I'll take you through most of the improvements to MapInfo Pro v2019 focussing on the enhanced SQL capabilities. I will also give you a glance at what's coming in MapInfo Pro v2021.
Tackling "BIG Data": Mobile LiDAR Transportation Project Use CaseMerrick & Company
2015 International LiDAR Mapping Forum (ILMF) conference presentation by Josh Beck, Senior Software Consultant for Merrick & Company's Geomatics team. Presentation occurred on Tuesday, February 24, 2015 at the Hyatt Regency Denver at Colorado Convention Center in Denver, Colorado.
Similar to Exploration and 3D GIS Software - MapInfo Professional Discover3D 2015 (20)
Final project report on grocery store management system..pdfKamal Acharya
In today’s fast-changing business environment, it’s extremely important to be able to respond to client needs in the most effective and timely manner. If your customers wish to see your business online and have instant access to your products or services.
Online Grocery Store is an e-commerce website, which retails various grocery products. This project allows viewing various products available enables registered users to purchase desired products instantly using Paytm, UPI payment processor (Instant Pay) and also can place order by using Cash on Delivery (Pay Later) option. This project provides an easy access to Administrators and Managers to view orders placed using Pay Later and Instant Pay options.
In order to develop an e-commerce website, a number of Technologies must be studied and understood. These include multi-tiered architecture, server and client-side scripting techniques, implementation technologies, programming language (such as PHP, HTML, CSS, JavaScript) and MySQL relational databases. This is a project with the objective to develop a basic website where a consumer is provided with a shopping cart website and also to know about the technologies used to develop such a website.
This document will discuss each of the underlying technologies to create and implement an e- commerce website.
6th International Conference on Machine Learning & Applications (CMLA 2024)ClaraZara1
6th International Conference on Machine Learning & Applications (CMLA 2024) will provide an excellent international forum for sharing knowledge and results in theory, methodology and applications of on Machine Learning & Applications.
KuberTENes Birthday Bash Guadalajara - K8sGPT first impressionsVictor Morales
K8sGPT is a tool that analyzes and diagnoses Kubernetes clusters. This presentation was used to share the requirements and dependencies to deploy K8sGPT in a local environment.
Using recycled concrete aggregates (RCA) for pavements is crucial to achieving sustainability. Implementing RCA for new pavement can minimize carbon footprint, conserve natural resources, reduce harmful emissions, and lower life cycle costs. Compared to natural aggregate (NA), RCA pavement has fewer comprehensive studies and sustainability assessments.
Welcome to WIPAC Monthly the magazine brought to you by the LinkedIn Group Water Industry Process Automation & Control.
In this month's edition, along with this month's industry news to celebrate the 13 years since the group was created we have articles including
A case study of the used of Advanced Process Control at the Wastewater Treatment works at Lleida in Spain
A look back on an article on smart wastewater networks in order to see how the industry has measured up in the interim around the adoption of Digital Transformation in the Water Industry.
Sachpazis:Terzaghi Bearing Capacity Estimation in simple terms with Calculati...Dr.Costas Sachpazis
Terzaghi's soil bearing capacity theory, developed by Karl Terzaghi, is a fundamental principle in geotechnical engineering used to determine the bearing capacity of shallow foundations. This theory provides a method to calculate the ultimate bearing capacity of soil, which is the maximum load per unit area that the soil can support without undergoing shear failure. The Calculation HTML Code included.
Understanding Inductive Bias in Machine LearningSUTEJAS
This presentation explores the concept of inductive bias in machine learning. It explains how algorithms come with built-in assumptions and preferences that guide the learning process. You'll learn about the different types of inductive bias and how they can impact the performance and generalizability of machine learning models.
The presentation also covers the positive and negative aspects of inductive bias, along with strategies for mitigating potential drawbacks. We'll explore examples of how bias manifests in algorithms like neural networks and decision trees.
By understanding inductive bias, you can gain valuable insights into how machine learning models work and make informed decisions when building and deploying them.
Cosmetic shop management system project report.pdfKamal Acharya
Buying new cosmetic products is difficult. It can even be scary for those who have sensitive skin and are prone to skin trouble. The information needed to alleviate this problem is on the back of each product, but it's thought to interpret those ingredient lists unless you have a background in chemistry.
Instead of buying and hoping for the best, we can use data science to help us predict which products may be good fits for us. It includes various function programs to do the above mentioned tasks.
Data file handling has been effectively used in the program.
The automated cosmetic shop management system should deal with the automation of general workflow and administration process of the shop. The main processes of the system focus on customer's request where the system is able to search the most appropriate products and deliver it to the customers. It should help the employees to quickly identify the list of cosmetic product that have reached the minimum quantity and also keep a track of expired date for each cosmetic product. It should help the employees to find the rack number in which the product is placed.It is also Faster and more efficient way.
HEAP SORT ILLUSTRATED WITH HEAPIFY, BUILD HEAP FOR DYNAMIC ARRAYS.
Heap sort is a comparison-based sorting technique based on Binary Heap data structure. It is similar to the selection sort where we first find the minimum element and place the minimum element at the beginning. Repeat the same process for the remaining elements.
Harnessing WebAssembly for Real-time Stateless Streaming PipelinesChristina Lin
Traditionally, dealing with real-time data pipelines has involved significant overhead, even for straightforward tasks like data transformation or masking. However, in this talk, we’ll venture into the dynamic realm of WebAssembly (WASM) and discover how it can revolutionize the creation of stateless streaming pipelines within a Kafka (Redpanda) broker. These pipelines are adept at managing low-latency, high-data-volume scenarios.
2. Pitney Bowes Software provides solutions and services for the...
• Discovery
• Evaluation
• Development
• Management
...of Natural Resources
3. Pitney Bowes Software ensures your organization
can secure investment for growth.
Our solutions help investors better understand and
appreciate your assets.
4. Industries who use our software
• Mineral exploration
• Mining
• Oil & Gas
• Coal
• Industrial minerals
• Environmental management
• Water management
• Asset management
• Hazard assessment
• Forestry
8. MapInfo Professional
The 64-bit version of MapInfo Pro has an
all new ribbon based user interface which
makes everyday tasks easier to learn and
do than ever before.
9. MapInfo Discover3D
Geographical Information System (GIS) for the exploration and mining industry for
close to 20 years.
The 3D GIS system is designed to appeal to geologists, environmental scientists,
petroleum engineers and other natural resources professionals.
39. Layout Designer and cartographic output–
more capabilities in version 15.2
• Support for "Empty" frames. As was possible with the legacy Layout
window, we are adding the ability to specify empty frames and then fill
them with content.
• Graticule - A dynamic graticule capability is being added to the Layout
Designer. This will allow for grid lines to represent coordinates to be added
to your Layouts.
40. And finally… COMING IN VERSION 15.2
Once again, version 15.2 is scheduled to be available in October. This is our
next 64 bit release.
These include:
• A new extended TAB file format. This new format will eliminate the 2 GB file
size limit.
• Support for the GeoPackage data format. GeoPackage is an open standard
for sharing one or more sets of data in a single file.
• Additional performance enhancements.
41. What’s New in Discover3D 2015?
General improvements:
• Now clip rotated voxel (block) models with vector volumes.
• Now includes the ability to show a topology report for selected solid feature
objects.
This assists with the identification of holes in solids, allowing the user to
resolve any such issues with the various advanced feature editing tools, prior
to export.
• AcQuire Database support has been updated to version 4.5.0.1.
44. Discover Web3D
Discover Web 3D (DW3D) provides a powerful way to view MapInfo
Professional Discover drillhole projects using any modern browser that
supports HTML5 and WebGL.
45. Discover Web3D
Applications:
• Progressive and transparent investor relations.
• Data led decision making for all.
• Live access to corporate data ensures the latest information is always used.
• Extends location based data to all levels of an organisation.
46. Discover Web3D - Example
http://www.pbencommaps.com/app3d/pbencom/copperhill_pub
47.
48. MapInfo Pro Raster
MapInfo Pro Raster is an add-on for MapInfo Pro that provides
raster grid based visualisation and analysis capabilities.
49.
50. Raster GIS and Vector GIS
Raster GIS
Vector GIS
Objects/entities with
associated data
Images – grid cells
with associated data
51. MapInfo Pro Raster
•MapInfo Pro add-on (for 64 bit version only)
•Grid support in Spectrum Spatial (enterprise applications)
•An independent SDK (later in 2015) (OEM applications, partners and SIs)
•Innovative new grid format and high performance engine
•Great performance with very large grid files.
•Efficiently displays data at all zoom levels ("pyramiding")
•Support for numeric, classified (categorical) or imagery data
in the same file format.
•To be supported across our product line, including
Spectrum Spatial and MapXtreme.
•SDK
Multi-resolution raster format allows variable
size grid cells for improved efficiency.
Multiple variables in a single grid.
Temporal analysis
52. MapInfo Pro Raster
Core capabilities are accessed through
easy to use panels.
These appear as you access the
capabilities on the ribbon
Look in the Color
stretch gallery for
more advanced
coloring options
Look in these galleries for
grid processing and analysis
capabilities!
Information and
statistics about
your grid data at
the click of a
button.
53. Convert and merge hundreds
of grids into one, in a single
operation.
Easy to use grid importing and merging
You can choose the files to merge
directly from your system here.
They do not have to be open in MI
Pro.
MapInfo Pro Raster
59. Solutions for analysis and modeling of the earth’s physical properties
A key science in various industries
Primarily, three solutions: ModelVision, Encom PA and EM Flow
Geophysical Solutions
60. Pitney Bowes Geophysical Solutions
Used Across Industries
Mineral Exploration
Petroleum
Coal mining
Groundwater
Agriculture
Civil engineering
Hazard Detection - unexploded ordinance (UXO)
Industrial site investigation/rehabilitation
Archaeology / Forensics
61. Geophysical Solutions
Groundwater Studies
Use of gravity to map locations
of buried channels
Use of magnetics to detect
depth of cover where channels
are sitting on a magnetic
basement
Build 3D models of buried river
channels and groundwater
basins