Michal Gallay, Christopher D. Lloyd, Jennifer McKinley: Exploring DEM error with geographically weighted regression (poster), 9th International Symposium GIS Ostrava, VŠB – Technical Univerzity of Ostrava, from 23rd to 25th January 2012
A knowledge-based model for identifying and mapping tropical wetlands and pea...ExternalEvents
This presentation was presented during the 2 Parallel session on Theme 3.1, Managing SOC in: Soils with high SOC – peatlands, permafrost, and black soils, of the Global Symposium on Soil Organic Carbon that took place in Rome 21-23 March 2017. The presentation was made by Mr. Thomas Gumbricht, from Center for International Forestry Research – Indonesia, in FAO Hq, Rome
Urban Land Cover Change Detection Analysis and Modelling Spatio-Temporal Grow...Bayes Ahmed
This is my final Mater thesis presentation. The thesis defense was held on March' 07, 2011 at 15:30 in the seminar room of Universitat Jaume I (UJI), Castellón, Spain.
Comparison of Geodatabase Terrain Pyramiding Methods for Airborne Laser Scann...GeoCommunity
Radek Fiala, Karel Jedlička, Lucie Potřebová: Comparison of Geodatabase Terrain Pyramiding Methods for Airborne Laser Scanning Data (poster), 9th International Symposium GIS Ostrava, VŠB – Technical Univerzity of Ostrava, from 23rd to 25th January 2012
Bridging Services, Information and Data for EuropeGeoCommunity
Karel Janecka, Otakar Cerba, Radek Fiala, Karel Jedlicka, Jan Jezek: BRISEIDE - BRIdging SErvices, Information and Data for Europe (poster), 9th International Symposium GIS Ostrava, VŠB – Technical Univerzity of Ostrava, from 23rd to 25th January 2012
CONGEO 2015 – Natural Hazards and Social Consequences: First announcementGeoCommunity
First announcement of the conference CONGEO 2015 – Natural Hazards and Social Consequences, August 24 – 27, 2015, New Hall of VSB – Technical University of Ostrava, 17. listopadu 15, Ostrava – Poruba, Czech Republic
Vector algebra for Steep Slope Models analysisGeoCommunity
Natalia Kolecka: Vector algebra for Steep Slope Models analysis (poster), 9th International Symposium GIS Ostrava, VŠB – Technical Univerzity of Ostrava, from 23rd to 25th January 2012
Application of GIS in Mine Contamination and Associated Environmental ImpactsArsalan Syed, PMP
• The purpose of this project was to apply GIS and remote sensing methods to determine the spatial extent and level of pollution at mining sites in order to develop or implement the best approach and technique in prevention and reclamation.
• Two case studies were analyzed to understand the importance of remediation and the human, ecological, and socio-cultural impacts of acid mine drainage.
Development of Methodology for Determining Earth Work Volume Using Combined S...IJMER
International Journal of Modern Engineering Research (IJMER) is Peer reviewed, online Journal. It serves as an international archival forum of scholarly research related to engineering and science education.
International Journal of Modern Engineering Research (IJMER) covers all the fields of engineering and science: Electrical Engineering, Mechanical Engineering, Civil Engineering, Chemical Engineering, Computer Engineering, Agricultural Engineering, Aerospace Engineering, Thermodynamics, Structural Engineering, Control Engineering, Robotics, Mechatronics, Fluid Mechanics, Nanotechnology, Simulators, Web-based Learning, Remote Laboratories, Engineering Design Methods, Education Research, Students' Satisfaction and Motivation, Global Projects, and Assessment…. And many more.
Titan’s Topography and Shape at the Endof the Cassini MissionSérgio Sacani
With the conclusion of the Cassini mission, we present an updated topographic map of Titan,including all the available altimetry, SARtopo, and stereophotogrammetry topographic data sets availablefrom the mission. We use radial basis func tions to interpolate the sparse data set, which covers only ∼9%of Titan’s global area. The most notable updates to the topography include higher coverage of the polesof Titan, improved fits to the global shape, and a finer resolution of the global interpolation. We alsopresent a statistical analysis of the error in the derived products and perform a global minimization on aprofile-by-profile basis to account for observed biases in the input data set. We find a greater flattening ofTitan than measured, additional topographic rises in Titan’s southern hemisphere and better constrain thepossible locations of past and present liquids on Titan’s surface.
Robust 3D Geological Models: Hard Data is KeyFF Explore 3D
Understanding and incorporating 2D data, whether from surface field work or underground mine mapping, should always be the starting point of an integrated and coherent 3D geologic model, especially for areas with great geometric contrasts. Without this valuable data, 3D modelling is essentially performed with blinders on, and its absence results in a model that is too theory-driven, and lacks input from geologists and “real” field data.
Three-dimensional geologic models require complete, homogeneous and valid databases. The resulting 3D models are directly based on and rely on high-quality data. The data comprises both surface and underground observations. “Raw” or “hard” data should always be assigned more weight and act as rigid control points in 3D models. Hard data should always be distinguishable from interpreted data in 3D models. Investing the necessary time to learn how to homogenize and structure raw data in a rigorous way will be paid back during the 3D interpretation process.
Once 3D models are completed, they should be used as an exploration tool, populating their cells with user-chosen properties. Both quantitative and qualitative properties can be interpolated throughout the cells of the 3D model for further querying and questioning. Thus, the extra benefit of 3D map models is their use as dynamic interactive tools to help define new mineral exploration targets at depth.
A 3D map model is not a goal but a tool that should be dynamic, modified, questioned, shared and updated. Its future usefulness is determined by how well it can be utilized by a multi-disciplinary team of geologists, geophysicists, geochemists, engineers, metallurgists and environmental experts.
Matthew Cahalan Georgia Water Resources Conference PresentationMatthew Cahalan
This is the poster I presented at the 2015 Georgia Water Resources Conference. It focuses on my M.S. thesis research that seeks to answer this fundamental question: "why do sinkholes form where they do?". This question was answered using an improved remote sensing sinkhole mapping procedure, integration of many datasets (i.e., hydrologic, anthropogenic, geologic, geomorphologic, and hydrogeologic), and spatial statistics (i.e., ordinary least squares and geographically weighted regression). This poster / my presentation was voted as one of the top 3 posters at the conference.
This slide is all about proximal sensing of soil properties including lab techniques and proximal remote sensing. Hope it will help soil science scholars and acade
Summary of current radiometric calibration coefficients for Landsat MSS, TM, ETM+,
and EO-1 ALI sensors
Gyanesh Chander a,⁎, Brian L. Markham b, Dennis L. Helder c
a SGT, Inc. 1 contractor to the U.S. Geological Survey (USGS) Earth Resources Observation and Science (EROS) Center, Sioux Falls, SD 57198-0001, USA
b National Aeronautics and Space Administration (NASA) Goddard Space Flight Center (GSFC), Greenbelt, MD 20771, USA
c South Dakota State University (SDSU), Brookings, SD 57007, USA
Similar to Exploring DEM error with geographically weighted regression (20)
Jumping cockroaches (Blattaria, Skokidae fam. n.) from the Late Jurassic of K...GeoCommunity
Peter Vršanský (2007): Jumping cockroaches (Blattaria, Skokidae fam. n.) from the Late Jurassic of Karatau in Kazakhstan. Biológia 62, 5: 588-592, (published with permission of editorial board of Biológia journal, Institute of Zoology, Slovak Academy of Sciences)
Social Remittances: an alternative approach to development cooperationGeoCommunity
Jana Hasalová: Social Remittances:an alternative approach to development cooperation (paper), Študentská vedecká konferencia Prírodovedeckej fakulty Univerzity Komenského v Bratislave,
27th April 2011
Social Remittances: an alternative approach to development cooperationGeoCommunity
Jana Hasalová: Social Remittances:an alternative approach to development cooperation (presentation), Študentská vedecká konferencia Prírodovedeckej fakulty Univerzity Komenského v Bratislave,
27th April 2011
Builder.ai Founder Sachin Dev Duggal's Strategic Approach to Create an Innova...Ramesh Iyer
In today's fast-changing business world, Companies that adapt and embrace new ideas often need help to keep up with the competition. However, fostering a culture of innovation takes much work. It takes vision, leadership and willingness to take risks in the right proportion. Sachin Dev Duggal, co-founder of Builder.ai, has perfected the art of this balance, creating a company culture where creativity and growth are nurtured at each stage.
Software Delivery At the Speed of AI: Inflectra Invests In AI-Powered QualityInflectra
In this insightful webinar, Inflectra explores how artificial intelligence (AI) is transforming software development and testing. Discover how AI-powered tools are revolutionizing every stage of the software development lifecycle (SDLC), from design and prototyping to testing, deployment, and monitoring.
Learn about:
• The Future of Testing: How AI is shifting testing towards verification, analysis, and higher-level skills, while reducing repetitive tasks.
• Test Automation: How AI-powered test case generation, optimization, and self-healing tests are making testing more efficient and effective.
• Visual Testing: Explore the emerging capabilities of AI in visual testing and how it's set to revolutionize UI verification.
• Inflectra's AI Solutions: See demonstrations of Inflectra's cutting-edge AI tools like the ChatGPT plugin and Azure Open AI platform, designed to streamline your testing process.
Whether you're a developer, tester, or QA professional, this webinar will give you valuable insights into how AI is shaping the future of software delivery.
Transcript: Selling digital books in 2024: Insights from industry leaders - T...BookNet Canada
The publishing industry has been selling digital audiobooks and ebooks for over a decade and has found its groove. What’s changed? What has stayed the same? Where do we go from here? Join a group of leading sales peers from across the industry for a conversation about the lessons learned since the popularization of digital books, best practices, digital book supply chain management, and more.
Link to video recording: https://bnctechforum.ca/sessions/selling-digital-books-in-2024-insights-from-industry-leaders/
Presented by BookNet Canada on May 28, 2024, with support from the Department of Canadian Heritage.
GDG Cloud Southlake #33: Boule & Rebala: Effective AppSec in SDLC using Deplo...James Anderson
Effective Application Security in Software Delivery lifecycle using Deployment Firewall and DBOM
The modern software delivery process (or the CI/CD process) includes many tools, distributed teams, open-source code, and cloud platforms. Constant focus on speed to release software to market, along with the traditional slow and manual security checks has caused gaps in continuous security as an important piece in the software supply chain. Today organizations feel more susceptible to external and internal cyber threats due to the vast attack surface in their applications supply chain and the lack of end-to-end governance and risk management.
The software team must secure its software delivery process to avoid vulnerability and security breaches. This needs to be achieved with existing tool chains and without extensive rework of the delivery processes. This talk will present strategies and techniques for providing visibility into the true risk of the existing vulnerabilities, preventing the introduction of security issues in the software, resolving vulnerabilities in production environments quickly, and capturing the deployment bill of materials (DBOM).
Speakers:
Bob Boule
Robert Boule is a technology enthusiast with PASSION for technology and making things work along with a knack for helping others understand how things work. He comes with around 20 years of solution engineering experience in application security, software continuous delivery, and SaaS platforms. He is known for his dynamic presentations in CI/CD and application security integrated in software delivery lifecycle.
Gopinath Rebala
Gopinath Rebala is the CTO of OpsMx, where he has overall responsibility for the machine learning and data processing architectures for Secure Software Delivery. Gopi also has a strong connection with our customers, leading design and architecture for strategic implementations. Gopi is a frequent speaker and well-known leader in continuous delivery and integrating security into software delivery.
UiPath Test Automation using UiPath Test Suite series, part 4DianaGray10
Welcome to UiPath Test Automation using UiPath Test Suite series part 4. In this session, we will cover Test Manager overview along with SAP heatmap.
The UiPath Test Manager overview with SAP heatmap webinar offers a concise yet comprehensive exploration of the role of a Test Manager within SAP environments, coupled with the utilization of heatmaps for effective testing strategies.
Participants will gain insights into the responsibilities, challenges, and best practices associated with test management in SAP projects. Additionally, the webinar delves into the significance of heatmaps as a visual aid for identifying testing priorities, areas of risk, and resource allocation within SAP landscapes. Through this session, attendees can expect to enhance their understanding of test management principles while learning practical approaches to optimize testing processes in SAP environments using heatmap visualization techniques
What will you get from this session?
1. Insights into SAP testing best practices
2. Heatmap utilization for testing
3. Optimization of testing processes
4. Demo
Topics covered:
Execution from the test manager
Orchestrator execution result
Defect reporting
SAP heatmap example with demo
Speaker:
Deepak Rai, Automation Practice Lead, Boundaryless Group and UiPath MVP
Connector Corner: Automate dynamic content and events by pushing a buttonDianaGray10
Here is something new! In our next Connector Corner webinar, we will demonstrate how you can use a single workflow to:
Create a campaign using Mailchimp with merge tags/fields
Send an interactive Slack channel message (using buttons)
Have the message received by managers and peers along with a test email for review
But there’s more:
In a second workflow supporting the same use case, you’ll see:
Your campaign sent to target colleagues for approval
If the “Approve” button is clicked, a Jira/Zendesk ticket is created for the marketing design team
But—if the “Reject” button is pushed, colleagues will be alerted via Slack message
Join us to learn more about this new, human-in-the-loop capability, brought to you by Integration Service connectors.
And...
Speakers:
Akshay Agnihotri, Product Manager
Charlie Greenberg, Host
Smart TV Buyer Insights Survey 2024 by 91mobiles.pdf91mobiles
91mobiles recently conducted a Smart TV Buyer Insights Survey in which we asked over 3,000 respondents about the TV they own, aspects they look at on a new TV, and their TV buying preferences.
DevOps and Testing slides at DASA ConnectKari Kakkonen
My and Rik Marselis slides at 30.5.2024 DASA Connect conference. We discuss about what is testing, then what is agile testing and finally what is Testing in DevOps. Finally we had lovely workshop with the participants trying to find out different ways to think about quality and testing in different parts of the DevOps infinity loop.
UiPath Test Automation using UiPath Test Suite series, part 3DianaGray10
Welcome to UiPath Test Automation using UiPath Test Suite series part 3. In this session, we will cover desktop automation along with UI automation.
Topics covered:
UI automation Introduction,
UI automation Sample
Desktop automation flow
Pradeep Chinnala, Senior Consultant Automation Developer @WonderBotz and UiPath MVP
Deepak Rai, Automation Practice Lead, Boundaryless Group and UiPath MVP
Generating a custom Ruby SDK for your web service or Rails API using Smithyg2nightmarescribd
Have you ever wanted a Ruby client API to communicate with your web service? Smithy is a protocol-agnostic language for defining services and SDKs. Smithy Ruby is an implementation of Smithy that generates a Ruby SDK using a Smithy model. In this talk, we will explore Smithy and Smithy Ruby to learn how to generate custom feature-rich SDKs that can communicate with any web service, such as a Rails JSON API.
Dev Dives: Train smarter, not harder – active learning and UiPath LLMs for do...UiPathCommunity
💥 Speed, accuracy, and scaling – discover the superpowers of GenAI in action with UiPath Document Understanding and Communications Mining™:
See how to accelerate model training and optimize model performance with active learning
Learn about the latest enhancements to out-of-the-box document processing – with little to no training required
Get an exclusive demo of the new family of UiPath LLMs – GenAI models specialized for processing different types of documents and messages
This is a hands-on session specifically designed for automation developers and AI enthusiasts seeking to enhance their knowledge in leveraging the latest intelligent document processing capabilities offered by UiPath.
Speakers:
👨🏫 Andras Palfi, Senior Product Manager, UiPath
👩🏫 Lenka Dulovicova, Product Program Manager, UiPath
Elevating Tactical DDD Patterns Through Object CalisthenicsDorra BARTAGUIZ
After immersing yourself in the blue book and its red counterpart, attending DDD-focused conferences, and applying tactical patterns, you're left with a crucial question: How do I ensure my design is effective? Tactical patterns within Domain-Driven Design (DDD) serve as guiding principles for creating clear and manageable domain models. However, achieving success with these patterns requires additional guidance. Interestingly, we've observed that a set of constraints initially designed for training purposes remarkably aligns with effective pattern implementation, offering a more ‘mechanical’ approach. Let's explore together how Object Calisthenics can elevate the design of your tactical DDD patterns, offering concrete help for those venturing into DDD for the first time!
Elevating Tactical DDD Patterns Through Object Calisthenics
Exploring DEM error with geographically weighted regression
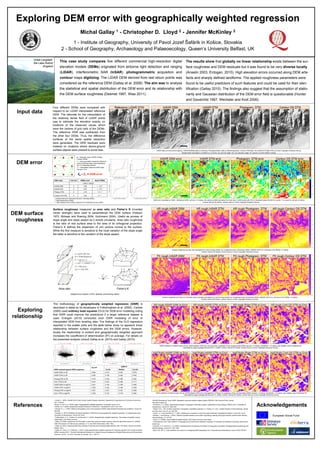
1. Exploring DEM error with geographically weighted regression
Michal Gallay 1 - Christopher D. Lloyd 2 - Jennifer McKinley 2
1 - Institute of Geography, University of Pavol Jozef Šafárik in Košice, Slovakia
2 - School of Geography, Archaeology and Palaeoecology, Queen’s University Belfast, UK
Area ratio Fisher’s K
Adapted from Hobson (1972), McKean and Roering (2004)
Input data
DEM error
DEM surface
roughness
Exploring
relationship
0.6680.4560.1840.001InSAR DSM vs log(FK)
0.6380.4050.2020.002InSAR DTM vs log(FK)
0.6650.4270.2010.001Photog.DTM vs log(FK)
0.6830.4190.1870.033Cont. DTM vs log(FK)
0.7110.4660.2340.014Cont. DTM vs AR
0.6920.4660.2350.016Photog.DTM vs AR
0.6420.4020.1850.030InSAR DTM vs AR
0.6760.4970.2730.024InSAR DSM vs AR
3rd QrtMedian1st Qrt
GWR R2
OLS R2
DEM residuals against DEM roughness
* unobstructed and obstructed flat land, Intermap (2002),
** GeoPerspectives (2006),
*** with respect to the contour interval 10 m Ordnance Survey (2001)
5 ***3.045Contour OS DTM
1.5 **2.765Photog. DTM
1 , 2.5 *3.675InSAR DTM
1 , 2.5 *3.665InSAR DSM
Units in metres
Stated RMSERMSE maskCell sizeDEM origin
The methodology of geographically weighted regression (GWR) is
described in detail by its developers in Fotheringham et al. (2002). Carlisle
(2005) used ordinary least squares (OLS) for DEM error modelling noting
that GWR could improve the predictions if a larger reference dataset is
used. Erdogan (2010) conducted such GWR modelling of error of
interpolated DEM from levelling data. The findings of the OLS regression
reported in the scatter plots and the table below show no apparent linear
relationship between surface roughness and the DEM errors. However,
locally the relationship is evident and geographically weighted approach
increases the cooefficient of determination (R2) on average. For details on
the presented analysis consult Gallay et al. (2010) and Gallay (2010).
This case study compares five different commercial high-resolution digital
elevation models (DEMs) originated from airborne light detection and ranging
(LiDAR), interferometric SAR (InSAR), photogrammetric acquisition and
contour maps digitizing. The LiDAR DEM derived from last return points was
considered as the reference DEM (Gallay et al. 2008). The aim was to analyse
the statistical and spatial distribution of the DEM error and its relationship with
the DEM surface roughness (Desmet 1997, Wise 2011).
■ – observed value, InSAR, Photog.,
Contour DEMs
● – more accurately measured reference
value LiDAR last return point elevations
(ca. 2 m sampling interval)
O – interpolated reference DEM value,
cell size = 5 m
Z■ – ZO = DEM error
Surface roughness measured as area ratio and Fisher’s K (inverted
vector strength) were used to parameterise the DEM surface (Hobson
1972, Mckean and Roering 2004, Grohmann 2004). Useful as proxies of
slope angle and slope aspect as it avoids circularity. Area ratio roughness
is the ratio of real surface area to the area of its orthogonal projection.
Fisher’s K defines the dispersion of unit vectors normal to the surface.
While the first measure is sensitive to the local variation of the slope angle
the latter is sensitive to the variation of the slope aspect.
The results show that globally no linear relationship exists between the sur-
face roughness and DEM residuals but it was found to be very diverse locally
(Anselin 2003, Erdogan, 2010). High elevation errors occurred along DEM arte-
facts and sharply defined landforms. The applied roughness parameters were
found to be useful predictors of such features and could be used for their iden-
tification (Gallay 2010). The findings also suggest that the assumption of statio-
narity and Gaussian distribution of the DEM error field is questionable (Hunter
and Goodchild 1997, Wechsler and Kroll 2006).
Great Langdale
the Lake District
England
LiDAR data (c) Environment Agency, InSAR NextMap data (c) Intermap, Photogrammetric data (c) GeoPerspectives, Contour DTM data: OS LandForm Profile DTM (c) Crown Copyright Ordnance Survey.
Shaded relief calculated in LandSerf (c) Jo Wood, sun azimuth angle 134°, sun elevation angle 10°, resoluti on of the DEMs 5 metres.
DEM error calculated as ‘DEM – Reference DEM‘, cell size = 5 metres, the reference DEM calculated from last return LiDAR points with IDW in Geostat.Analyst ArcGIS 9.0, points = 12, power=2, cell size 5 metres.
Contour interval 20 metres, contour lines (c) Crown Copyright Ordnance Survey.
Surface roughness as area ratio calculated for a 5x5 moving window by r.roughness.vector (Grohmann 2004), GRASS GIS 6.2.2, cell sizes of the DEMs = 5 metres
Contour interval 20 metres, contour lines (c) Crown Copyright Ordnance Survey.
Surface roughness as Fisher’s K (inverted vector strength) calculated for a 5x5 moving window by r.roughness.vector (Grohmann 2004), GRASS GIS 6.2.2, cell sizes of the DEMs = 5 metres
Contour interval 20 metres, contour lines (c) Crown Copyright Ordnance Survey.
GWR coefficient of determination (R.sq). GWR between DEM error and area ratio roughness of the corresponding DEMs cell-size = 5 metres, bandwidth = 15 metres, gwr.weights: exp(-0.5(dist/bw)^2).
Calculated by spgwr package (Bivand and Yu, 2008). Contour interval 20 metres, contour lines (c) Crown Copyright Ordnance Survey.
GWR coefficient of determination (R.sq). GWR between DEM error and logarithm of Fisher’s K roughness of the corresponding DEMs cell-size = 5 metres, bandwidth = 15 metres, gwr.weights: exp(-0.5(dist/bw)^2).
Calculated by spgwr package (Bivand and Yu, 2008). Contour interval 20 metres, contour lines (c) Crown Copyright Ordnance Survey.
Four different DEMs were compared with
respect to an LiDAR interpolated reference
DEM. The rationale for the interpolation of
the relatively dense field of LiDAR points
was to estimate the elevation exactly on
locations of the observed values which
were the centres of grid cells of the DEMs.
The reference DEM was subtracted from
the other four DEMs. Thus, the difference
surfaces of the same spatial resolution
were generated. The DEM residuals were
masked on locations where above-ground
surface objects were present to avoid bias.
References Acknowledgements
European Social Fund
• Anselin, L. (2003). GeoDa TM 0.9 User's Guide. Spatial Analysis Laboratory. Department of Agricultural and Consumer Economics.
Univ. of Illinois.
•Bivand, R. and Yu, D. (2008). spgwr: Geographically weighted regression. R package. version 0.5-4.
•Carlisle, B. H. (2005), Modelling the Spatial Distribution of DEM Error. Transactions in GIS, 9: 521–540
• Desmet, P. J. J. (1997). Effects of interpolation errors on the analysis of DEMs. Earth Surface Processes and Landforms. Volume 22,
563-580.
• Erdogan, S. (2010). Modelling the spatial distribution of DEM error with geographically weighted regression: An experimental study.
Computers & Geosciences. Volume 36, 34-43.
• Fotheringham, A. S., Charlton, M. and Brunsdon, C. (2002). Geographically weighted regression: The analysis of spatially varying
relationships. John Wiley and Sons.
• Gallay, M. (2008). Assessment of DTM quality: a case study using fine spatial resolution data from alternative sources In: GISRUK
2008: GIS research UK 16th annual conference : 2.-4. April 2008. Manchester, 2008. 156 p.
• Gallay, M. (2010): Assessing alternative methods of acquiring and processing digital elevation data. PhD thesis. Queen's University
Belfast. 339 p.
• Gallay, M., Lloyd, C. D., McKinley, J. (2010): Using geographically weighted regression for analysing elevation error of high-resolution
DEMs. Accuracy 2010 - The Ninth International Symposium on Spatial Accuracy Assessment in Natural Resources and Environmental
Sciences, July 20 – 23, 2010. University of Leicester, UK, p. 109-112.
•GRASS Development Team (2008). Geographic resources analysis support system (GRASS), GNU General Public License.
http://grass.osgeo.org.
• Grohmann, C. H. (2004). Morphometric analysis in geographic information systems: applications of free software GRASS and R. Computers &
Geosciences. Volume 30, 1055-1067.
• Hobson, R.D., 1972. Surface roughness in topography: quantitative approach. In: Chorley, R.J. (Ed.)., Spatial Analysis in Geomorphology. Harper
and Row, New York, NY, pp. 225–245.
• Hunter, G. J. and Goodchild, M. F. (1997). Modeling the uncertainty of slope and aspect estimates. Geographical Analysis. Volume 29, 35-49.
• McKean, J. and Roering, J. (2004). Objective landslide detection and surface morphology mapping using high-resolution airborne laser altimetry.
Geomorphology,, 57: 331-351.
• Lloyd, C. D. (2006). Local models for spatial analysis. CRC/Taylor & Francis, Boca Raton.
• R Development Core Team (2008).R: A language and environment for statistical computing. R Foundation for Statistical Computing. http://www.R-
project.org.
• Wechsler, S. P. and Kroll, C., N. (2006). Quantifying DEM uncertainty and its effect on topographic parameters. Photogrammetric Engineering and
Remote Sensing, Volume 72, 1081-1090.
• Wise, S.M. (2011). Cross-validation as a means of investigating DEM interpolation error. Computers and Geosciences, Volume 37(8), 978–991.
O O
OOO
O
O O O