Downloaded 18 times


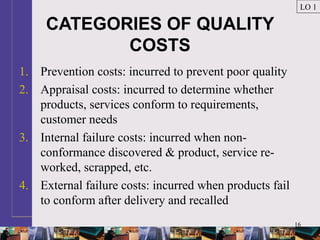
![23
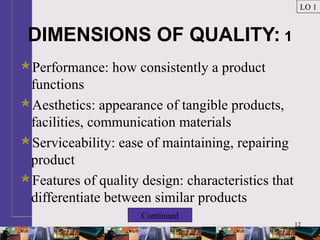
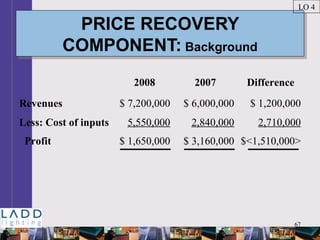
FORMULA: Taguchi Function
Taguchi quality loss function estimates hidden
costs of poor quality.
LO 1
[Quality loss * Actual value of quality
characteristic] L(y)
= a proportional constant multiplier of
external cost failure structure * (difference
between actual and target value squared)
L(y) = k(y-T)2](https://image.slidesharecdn.com/hansenaiseimch15-161008134158/85/Hansen-aise-im-ch15-23-320.jpg)

![66
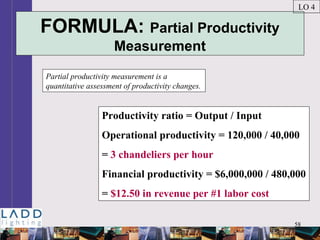
PROFIT-LINKAGE RULE:
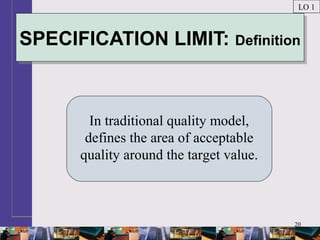
Definition
PROFIT-LINKAGE RULE:
Definition
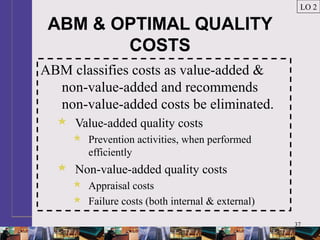
States that productivity change is
the difference between
[Cost of inputs without
productivity change – cost of
inputs actually used].
LO 4](https://image.slidesharecdn.com/hansenaiseimch15-161008134158/85/Hansen-aise-im-ch15-66-320.jpg)


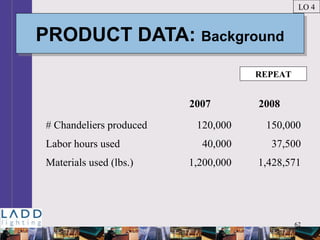
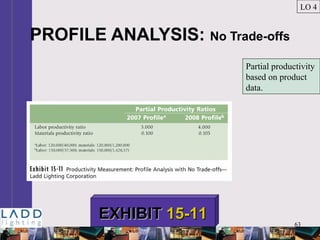
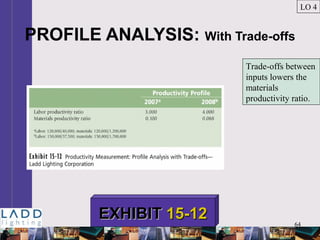
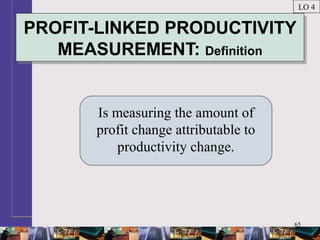
This document discusses quality costs and productivity. It begins by outlining the learning objectives which are to identify the four types of quality costs, prepare quality cost reports, explain why quality cost information is needed and how it is used, and explain productivity and calculate the impact of changes. It then provides examples to meet each learning objective, such as defining the four types of quality costs, showing examples of quality cost reports, and using quality cost information for strategic pricing and new product analysis. It also provides examples of calculating partial productivity measures and their advantages and disadvantages.


