Download to read offline
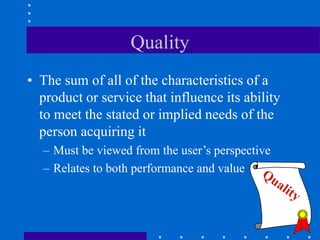

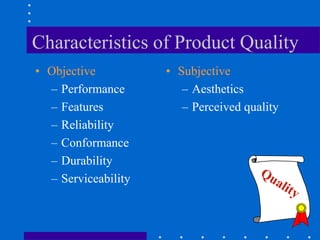
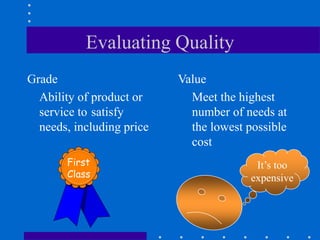
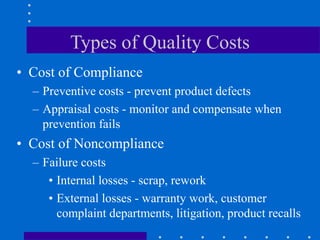

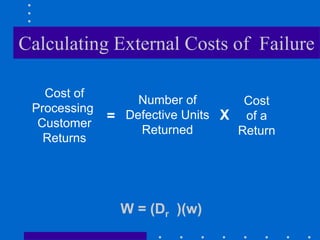
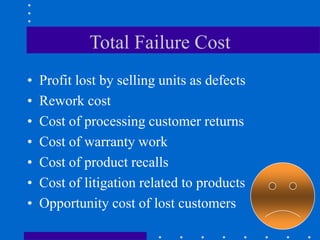
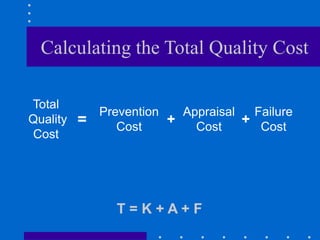
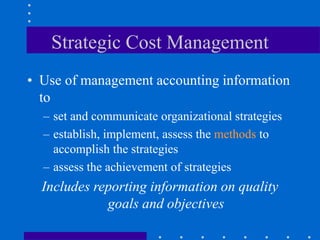
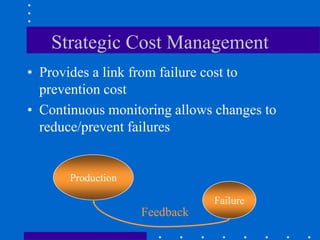
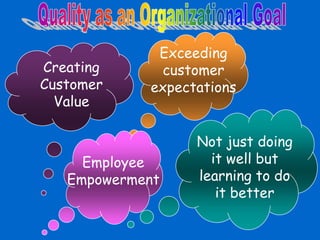
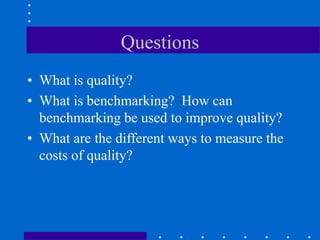

This document discusses concepts of quality management including: 1) Quality is defined as meeting customer needs in terms of performance, features, and value. Benchmarking involves comparing business processes against competitors or best practices to identify areas for improvement. 2) There are three types of quality costs - prevention costs, appraisal costs, and failure costs which can be internal or external. These costs are measured to determine where to invest in quality prevention. 3) Strategic cost management links failure cost information to prevention cost decisions through continuous monitoring to reduce defects and improve quality. This helps quality become part of an organization's culture.