Download as PDF, PPTX


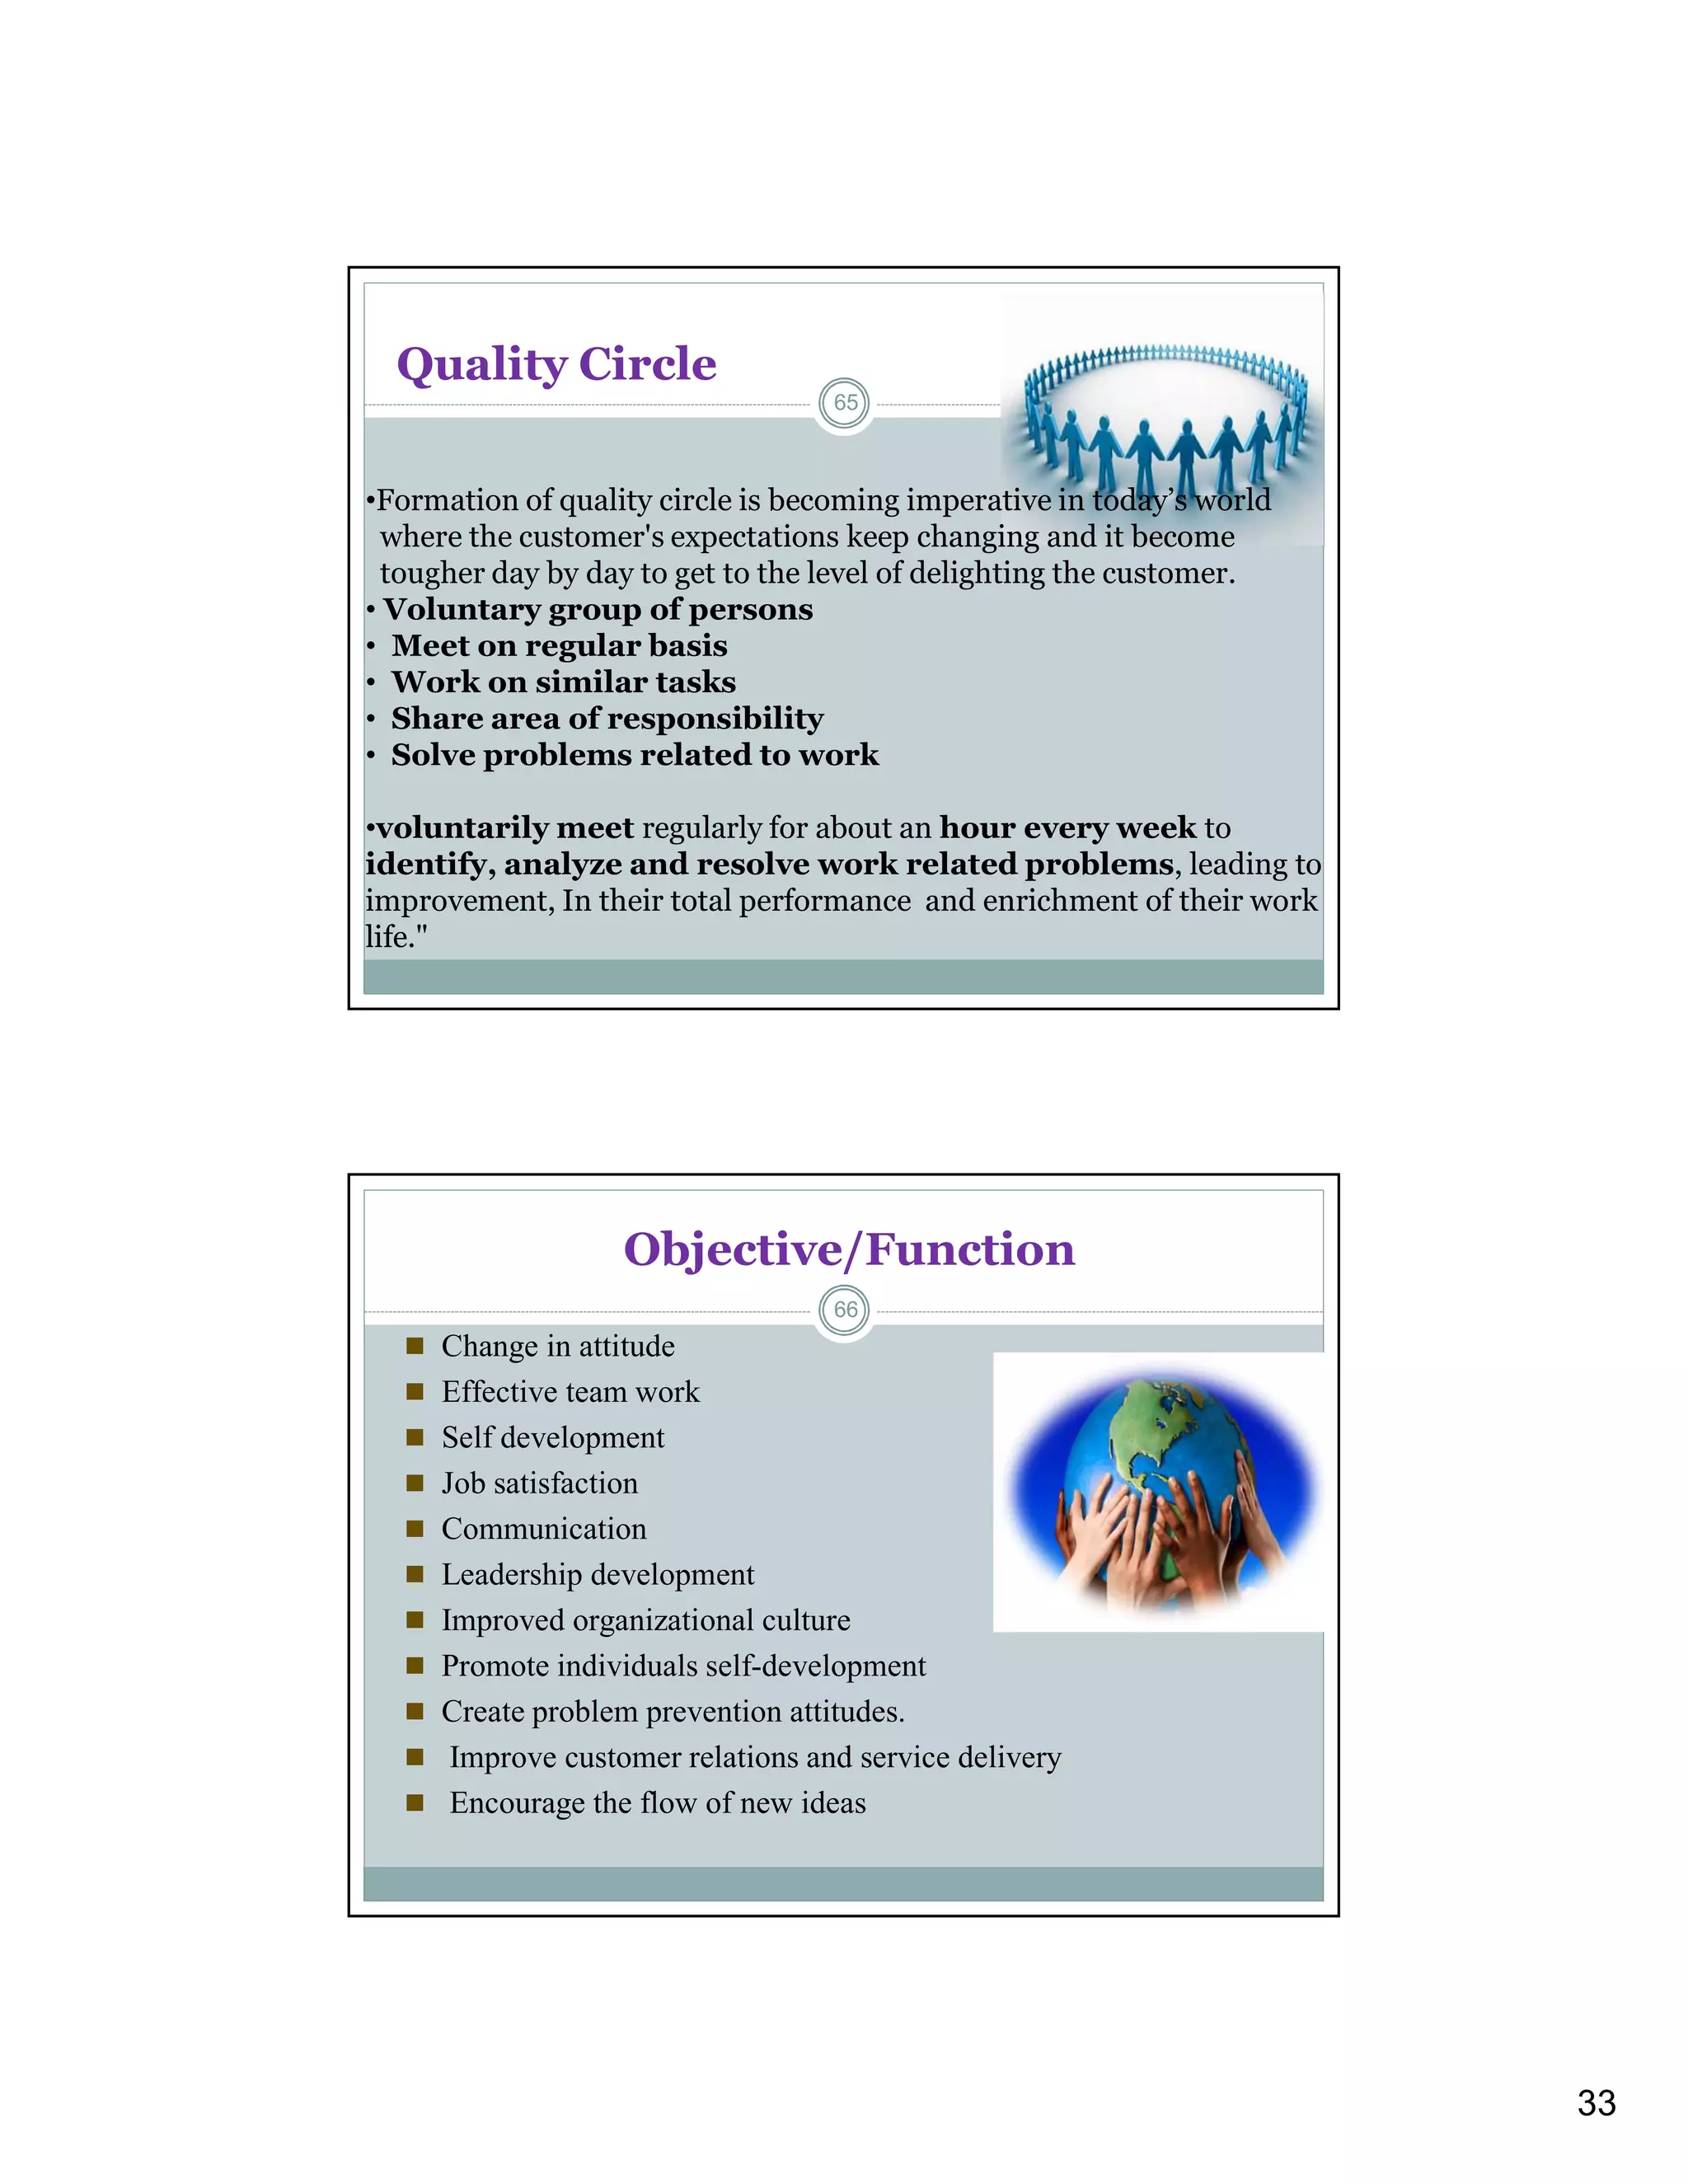


The document discusses the concept of quality in products and services, defining it from various perspectives including consumer expectations and the standards set by quality experts. It details the dimensions and modern importance of quality, various cost categories related to quality, and the roles of different quality improvement processes and tools. Additionally, it highlights quality circles as a means to enhance teamwork and problem-solving while fostering a culture of continuous improvement.


