This document discusses principles of total quality management (TQM) and quality costing. It makes the following key points:
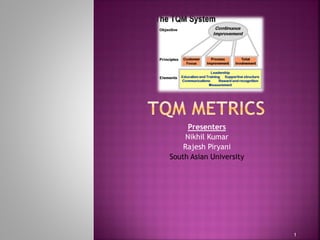
1) TQM focuses on customer satisfaction, continuous process improvement, and participation from all employees. Three basic TQM principles are making improvements, satisfying customers, and advancing the organization.
2) There are different types of quality costs, including prevention costs, appraisal costs, and failure costs both internal and external. Tracking quality costs can help quantify quality improvements.
3) Benchmarking involves measuring an organization's performance against leaders to identify areas for improvement. The plan-do-check-act cycle is used to implement changes based on benchmarks.