Downloaded 14 times
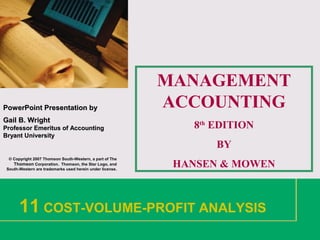


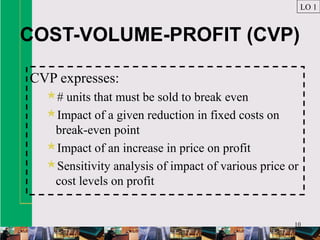
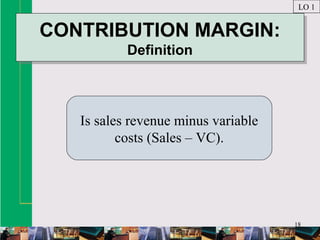

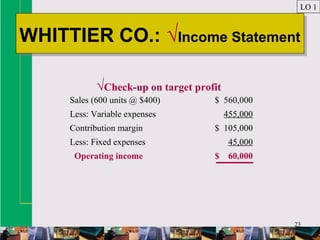
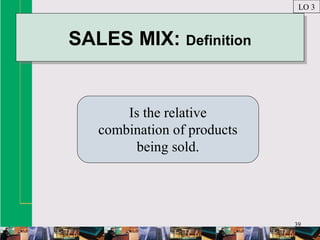
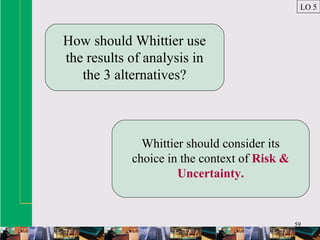


![68
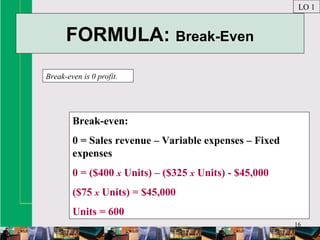
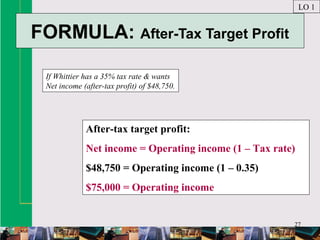
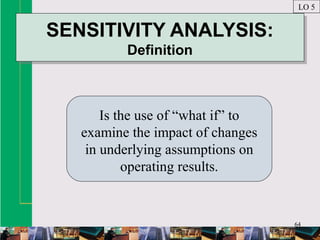
FORMULA: ABC & CVP
ABC breaks CVP up into unit variable
costs & other non-unit level costs.
LO 6
Break-even =
[Fixed cost + (Unit VC x # Units)
+ (Setup cost x # Setups)
+ Engineering cost x # Engineering hours)] ÷
(Price – Unit variable cost)](https://image.slidesharecdn.com/hansenaiseimch11-161008134114/85/Hansen-aise-im-ch11-68-320.jpg)
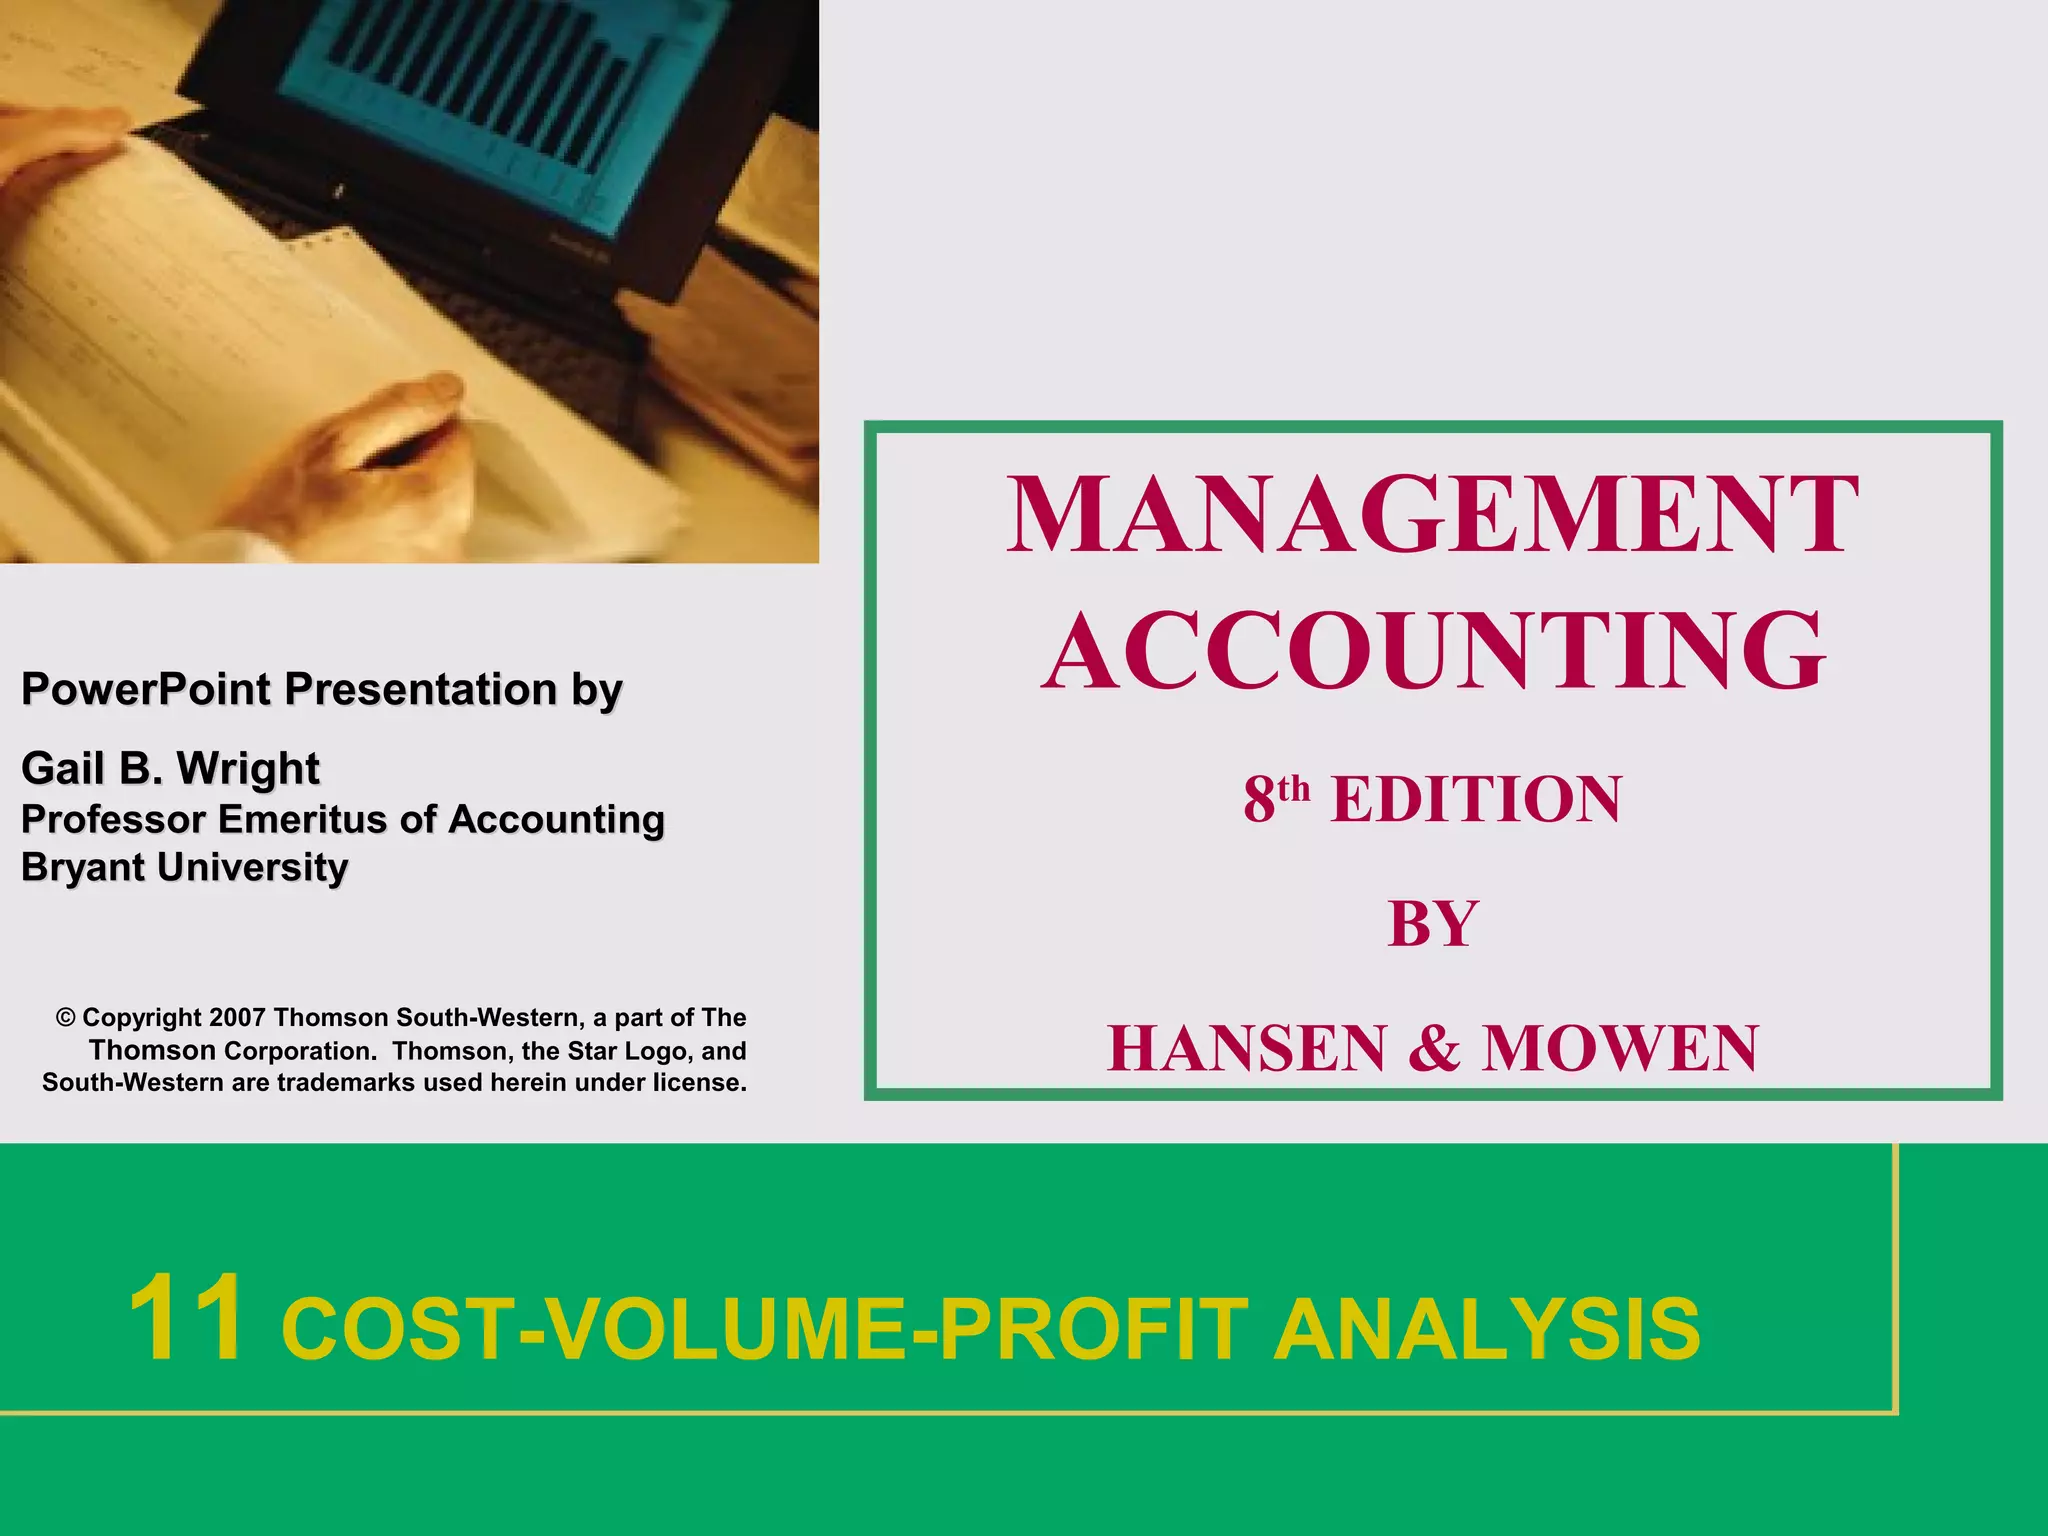
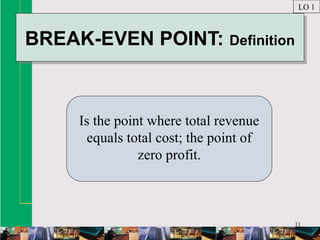
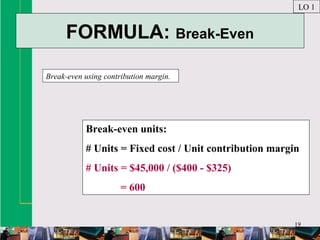
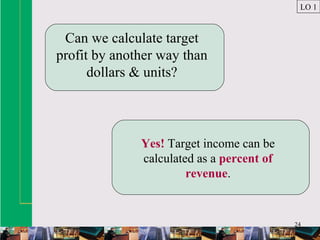
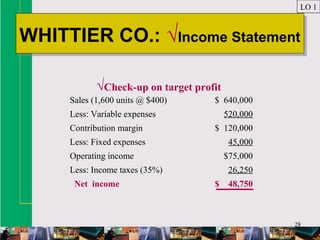
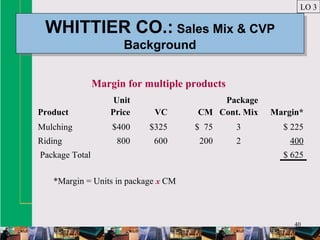
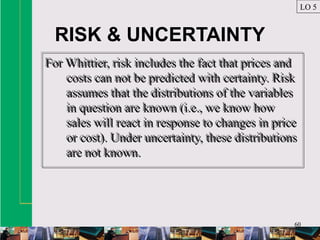
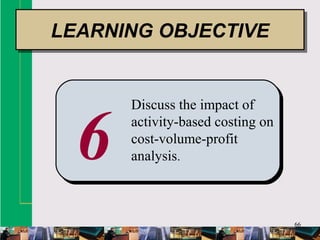
![70
FORMULA: Conventional CVP
LO 6
# Units
= [Targeted income + Conventional fixed cost ] ÷
(Price – Unit variable cost)
= ($20,000 + $100,000) ÷ ($20 - $10)
= 12,000 Units](https://image.slidesharecdn.com/hansenaiseimch11-161008134114/85/Hansen-aise-im-ch11-70-320.jpg)
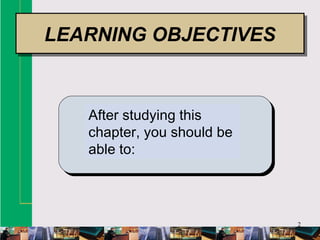
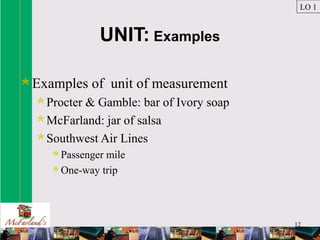
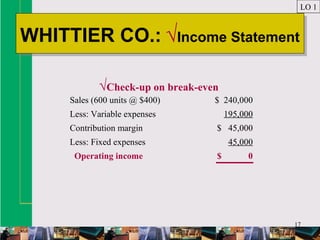
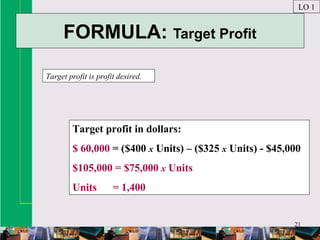
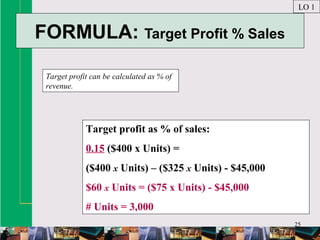
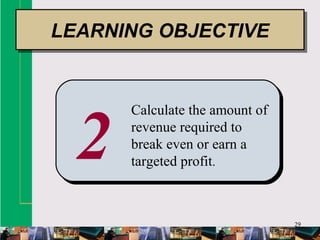
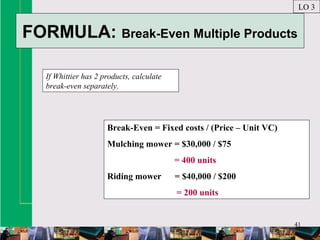
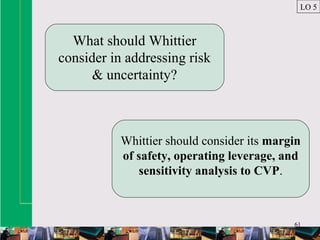
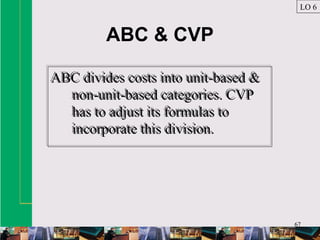
![71
FORMULA: ABC CVP
LO 6
# Units
= [Targeted income + ABC Fixed cost +
(Setup cost x # Setups) +
(Engineering cost x # Engineering hours)] ÷
(Price – Unit variable cost)
= ($20,000 + $50,000 + ($1,000 x 20) + ($30 x 1,000)] ÷ ($20 - $10)
= 12,000 Units](https://image.slidesharecdn.com/hansenaiseimch11-161008134114/85/Hansen-aise-im-ch11-71-320.jpg)


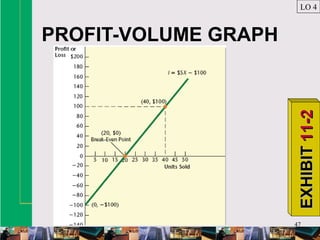
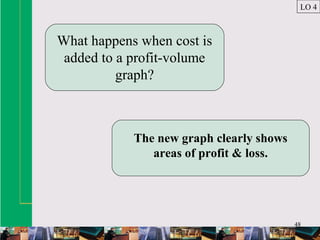
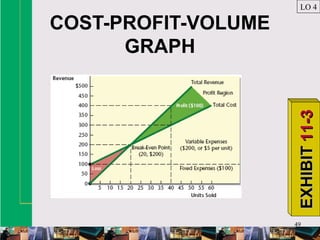
This document discusses cost-volume-profit (CVP) analysis through six learning objectives. It provides examples and formulas to calculate break-even points, target profits, revenue requirements, and the impact of multiple products. Graphs are presented to illustrate profit-volume and cost-volume-profit relationships. The document explains that CVP analysis assumes linear cost and revenue functions and examines how risk, uncertainty, and changing variables affect CVP results. Managers are advised to consider margin of safety, operating leverage, and sensitivity analysis when using CVP analysis under uncertainty.


