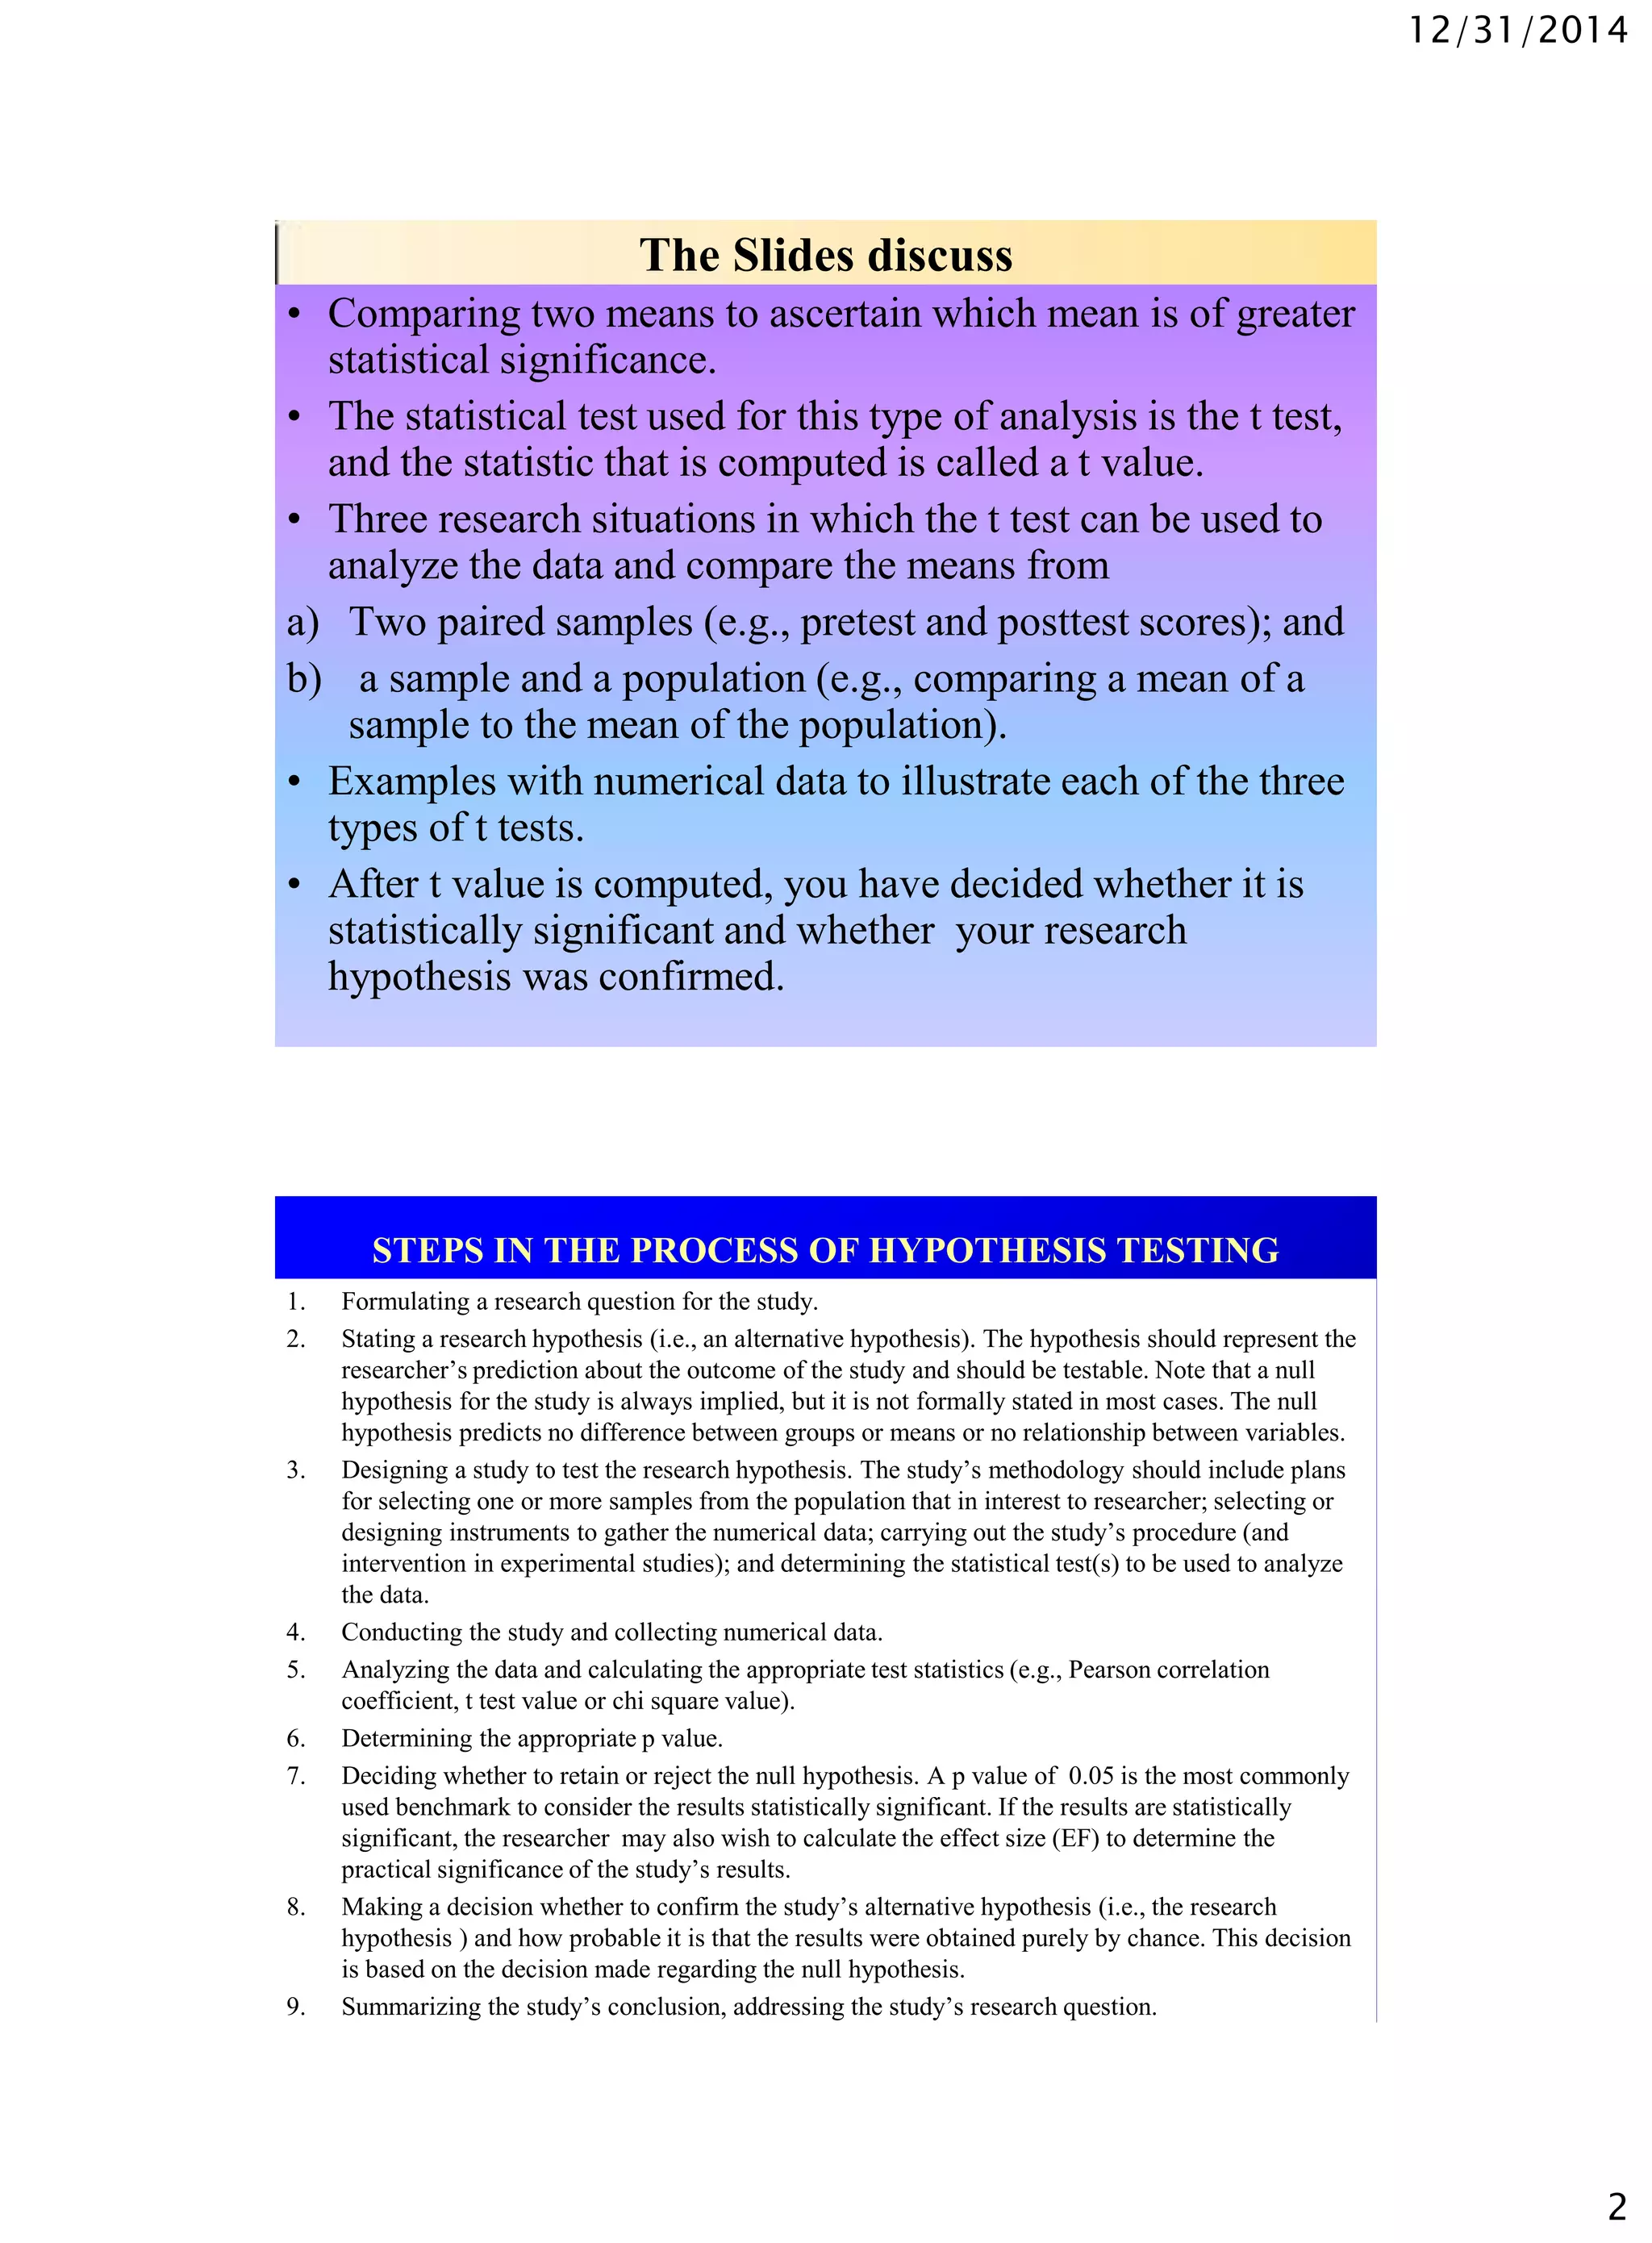
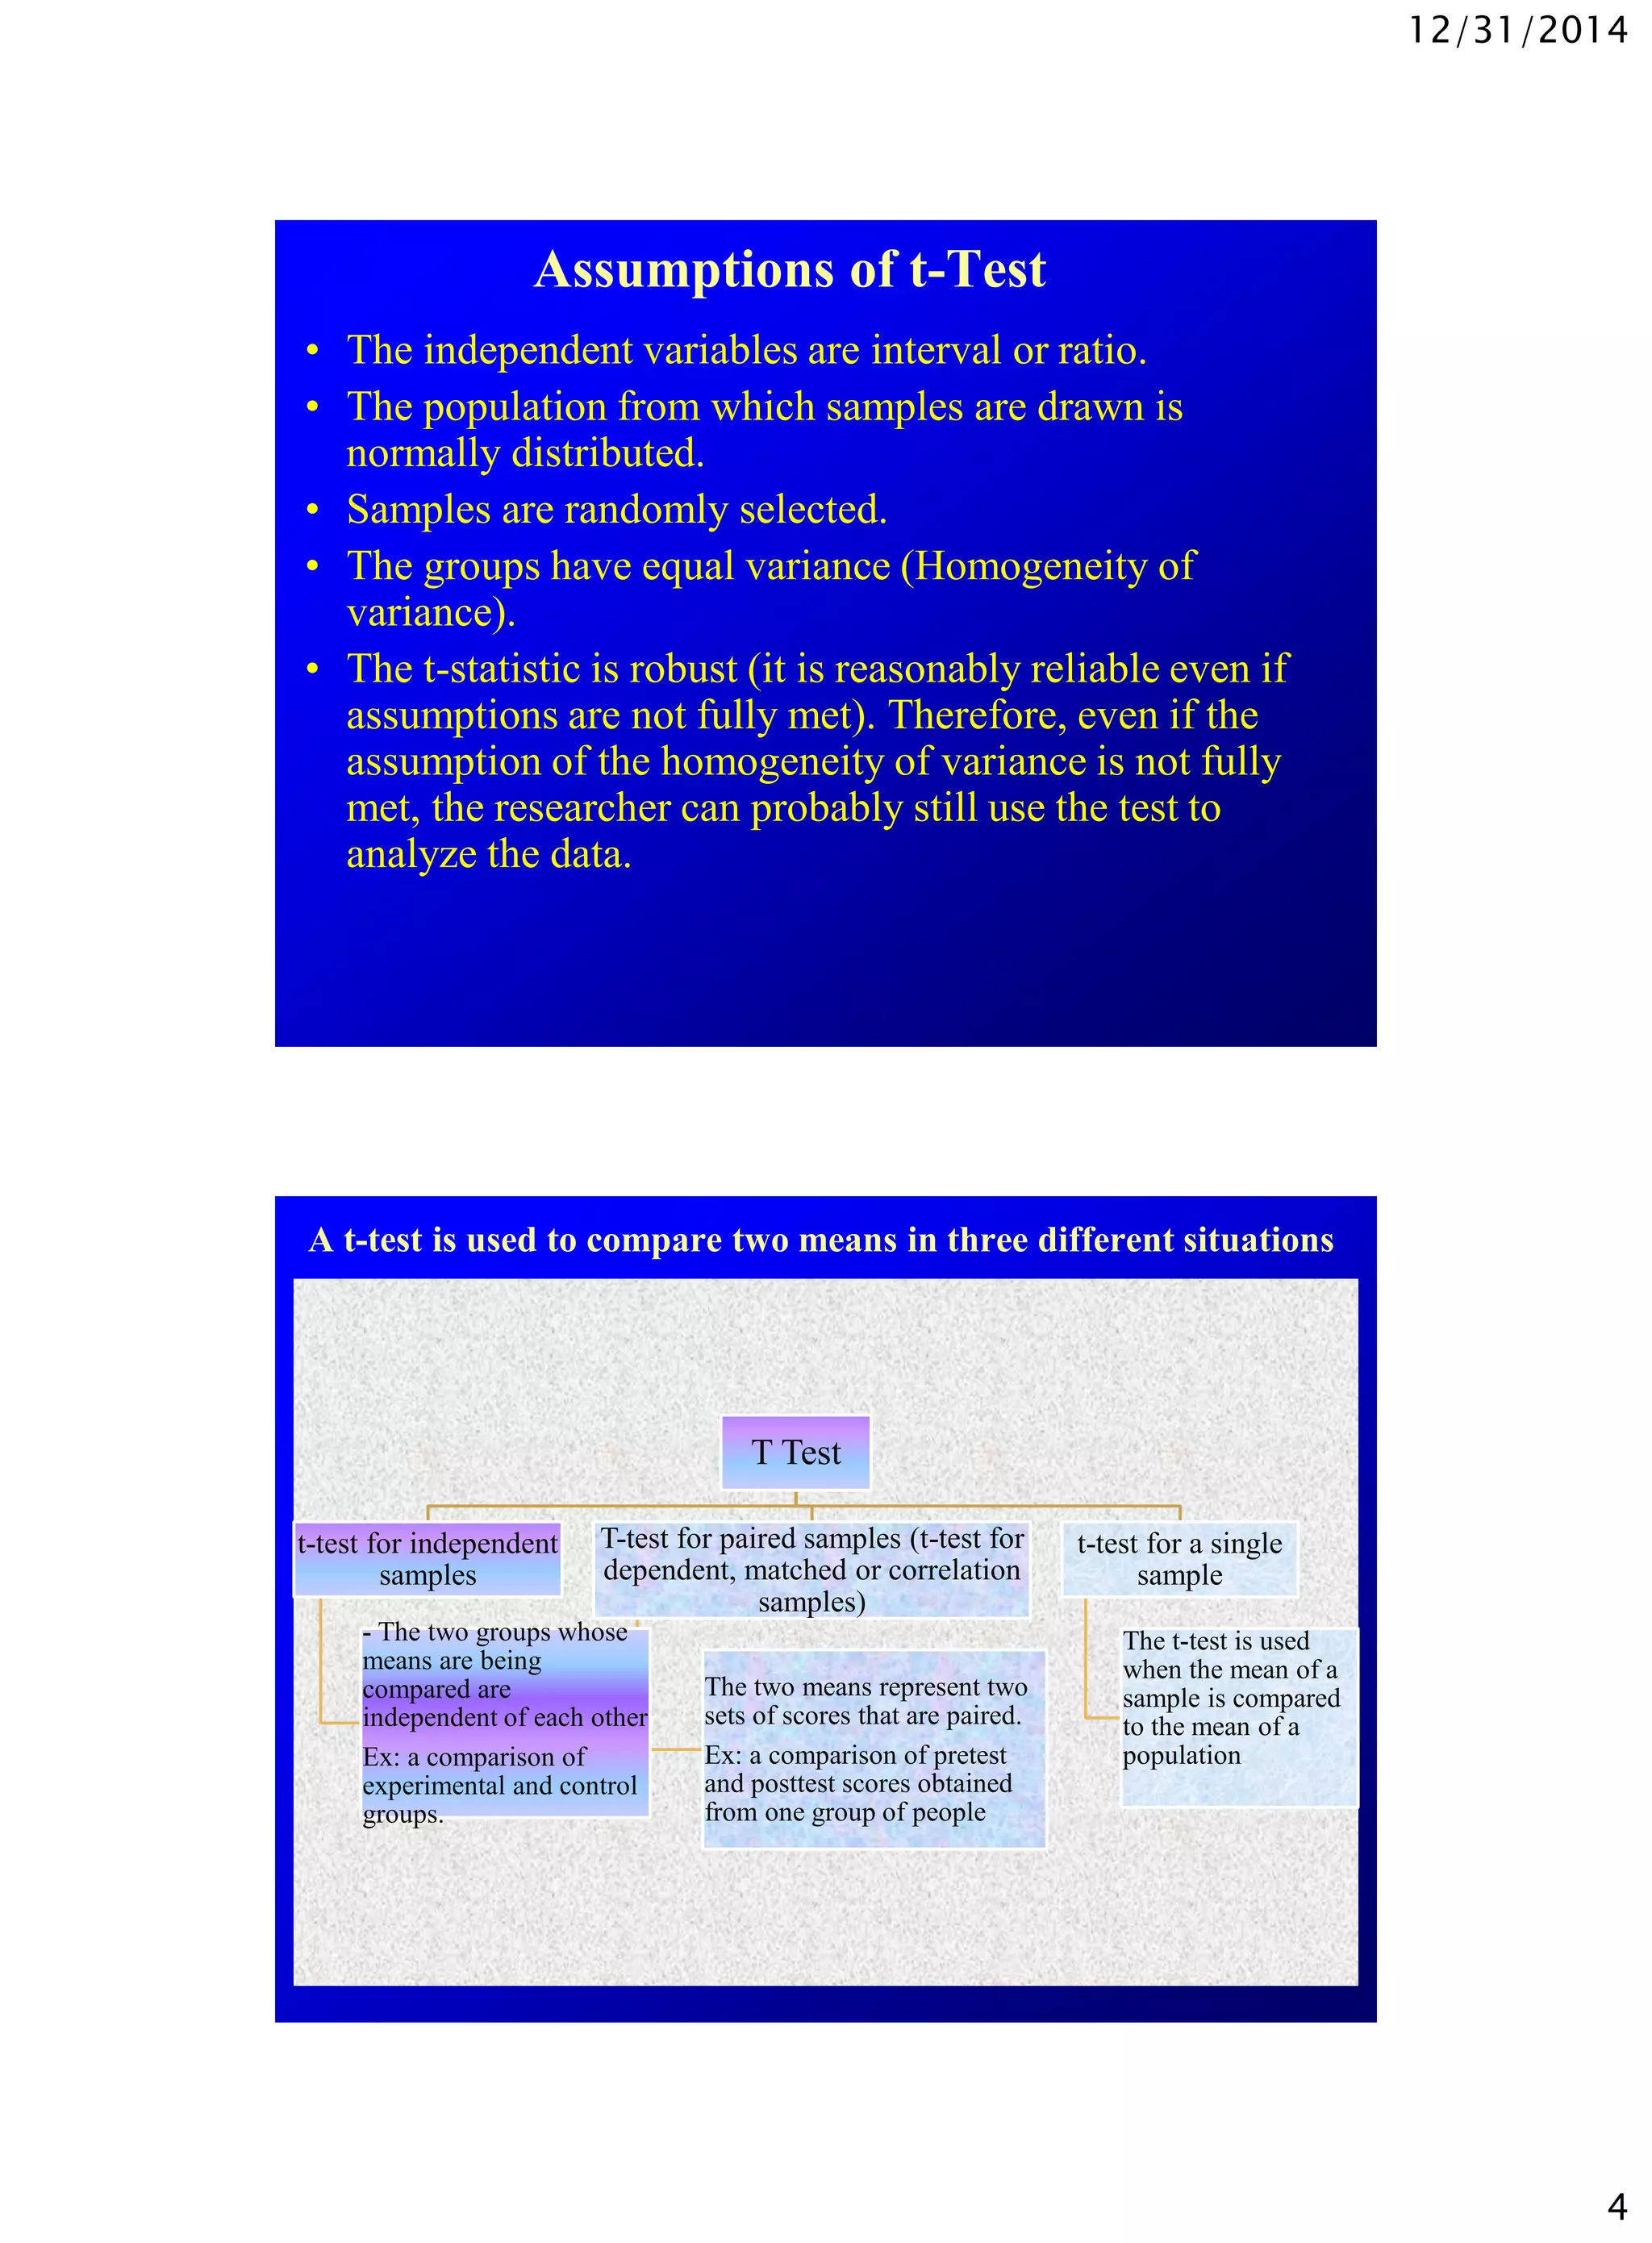
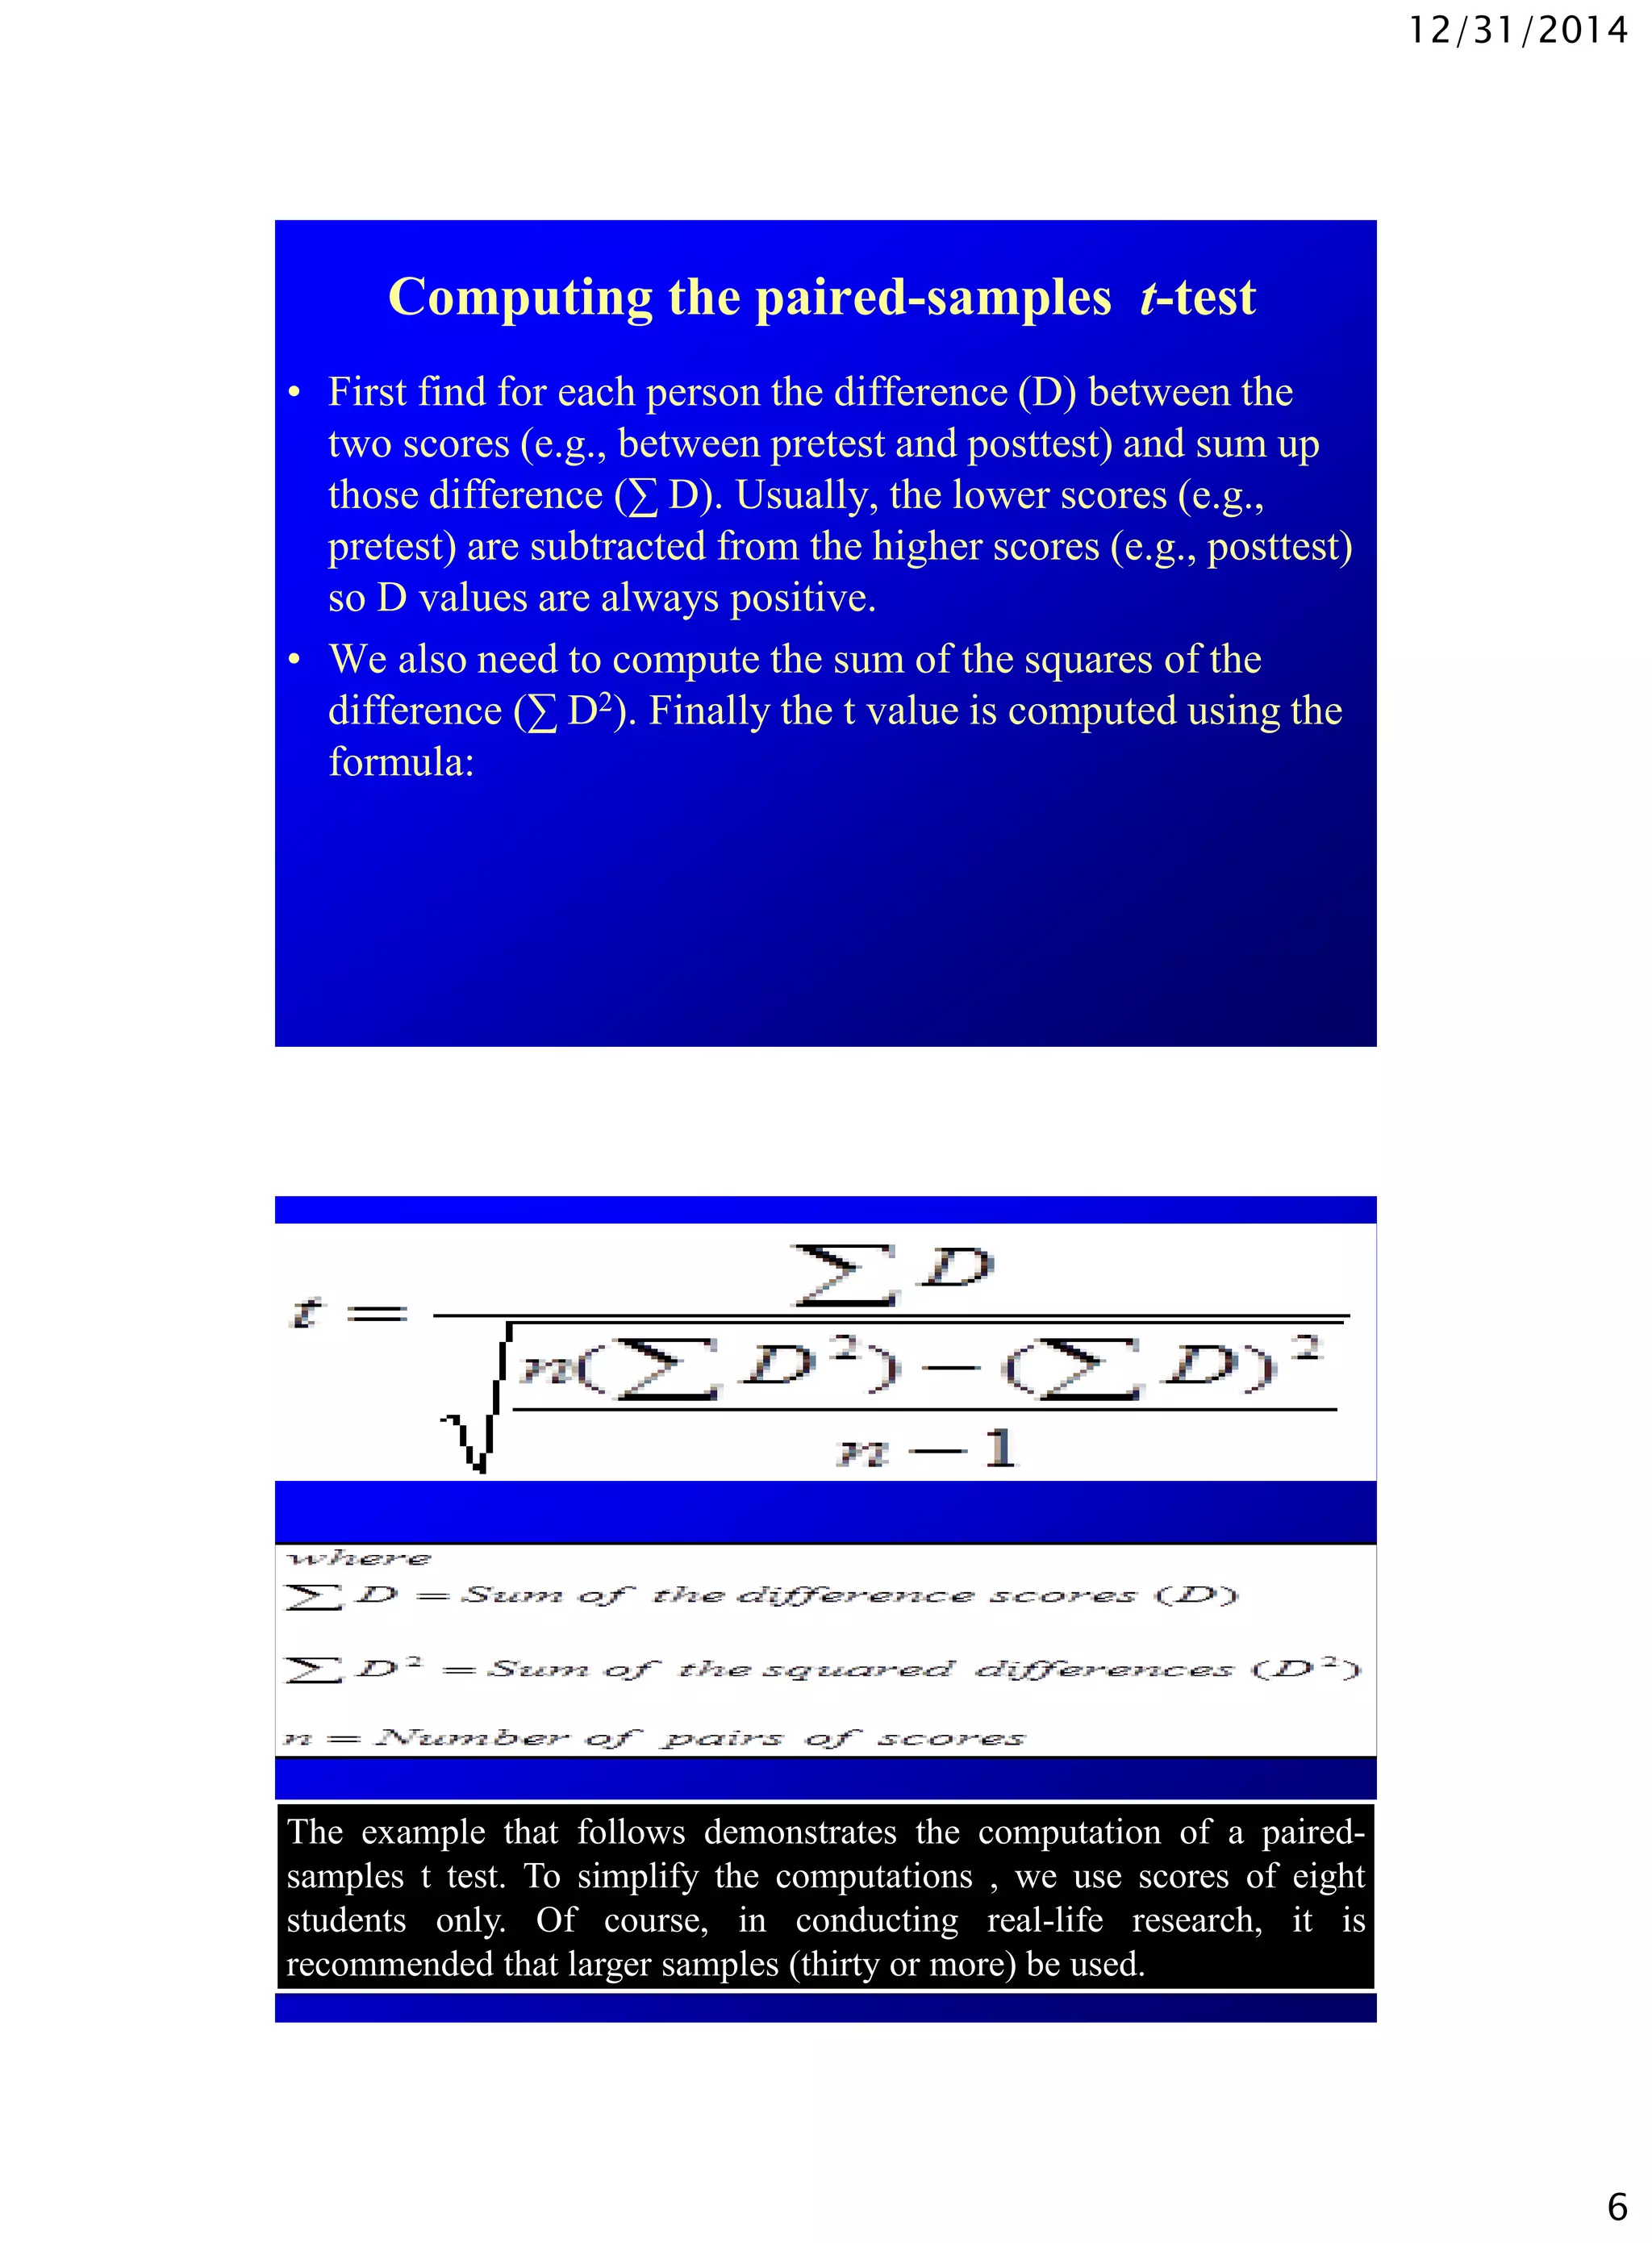
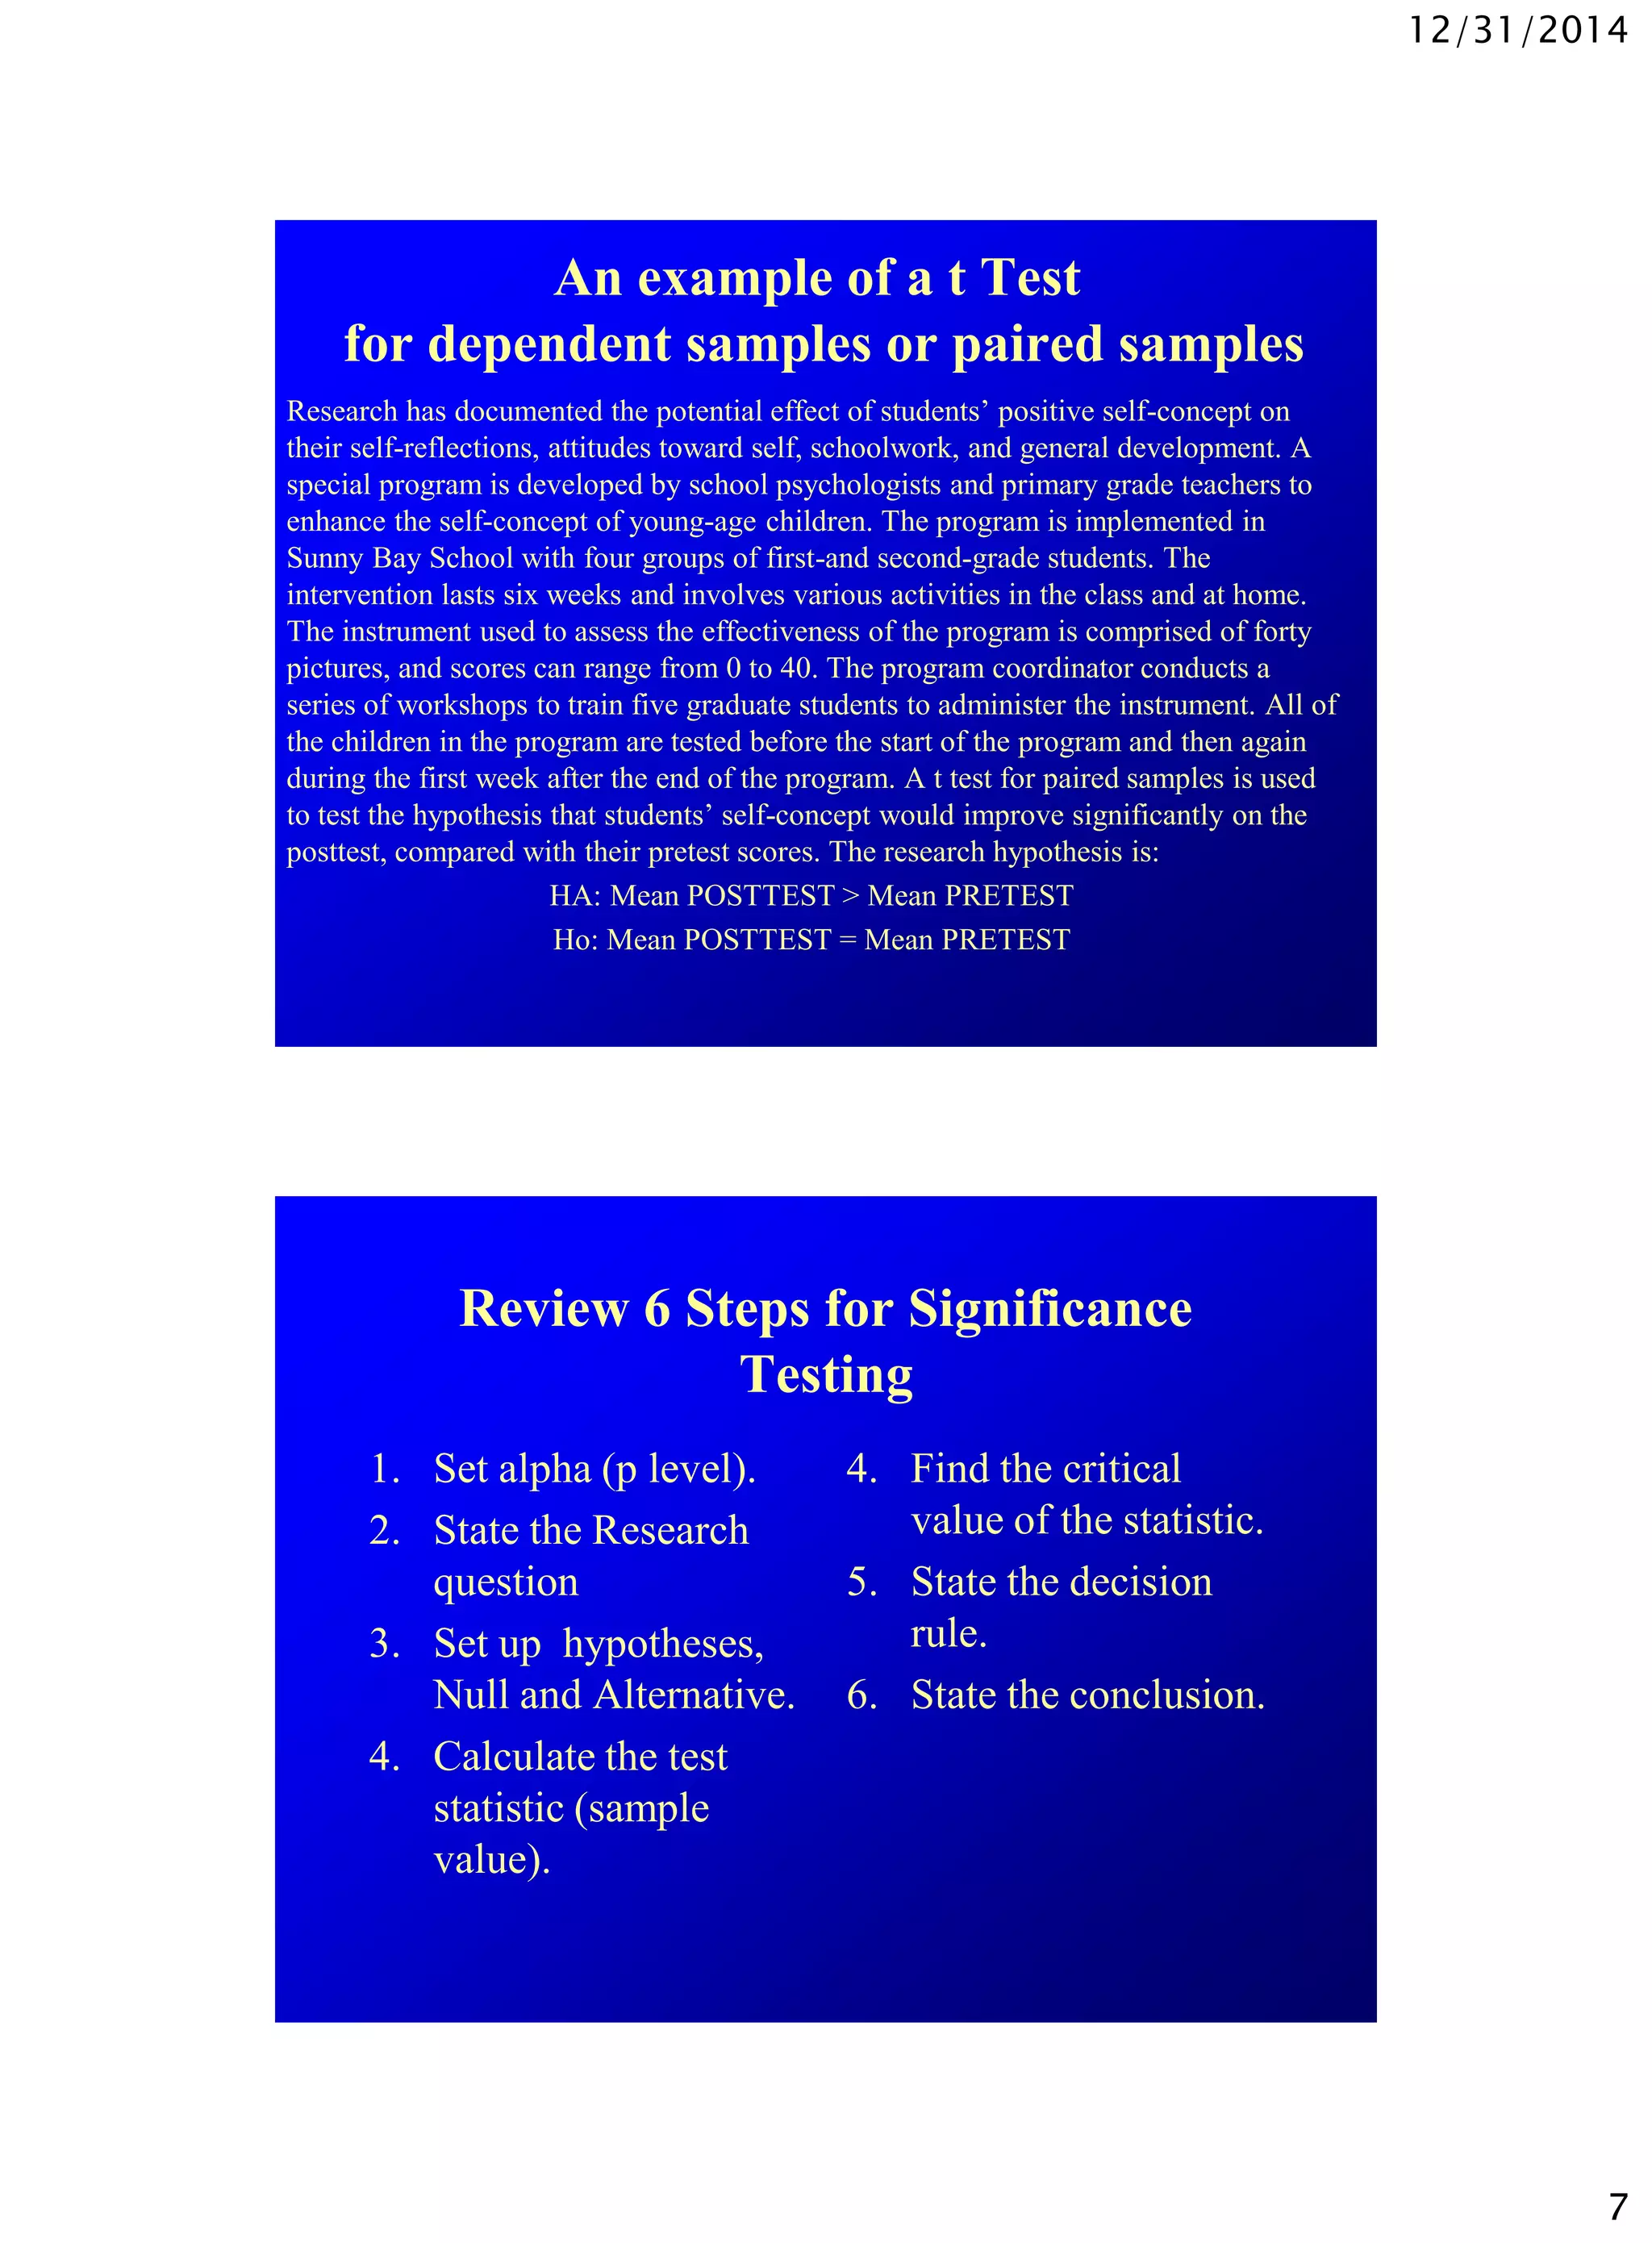
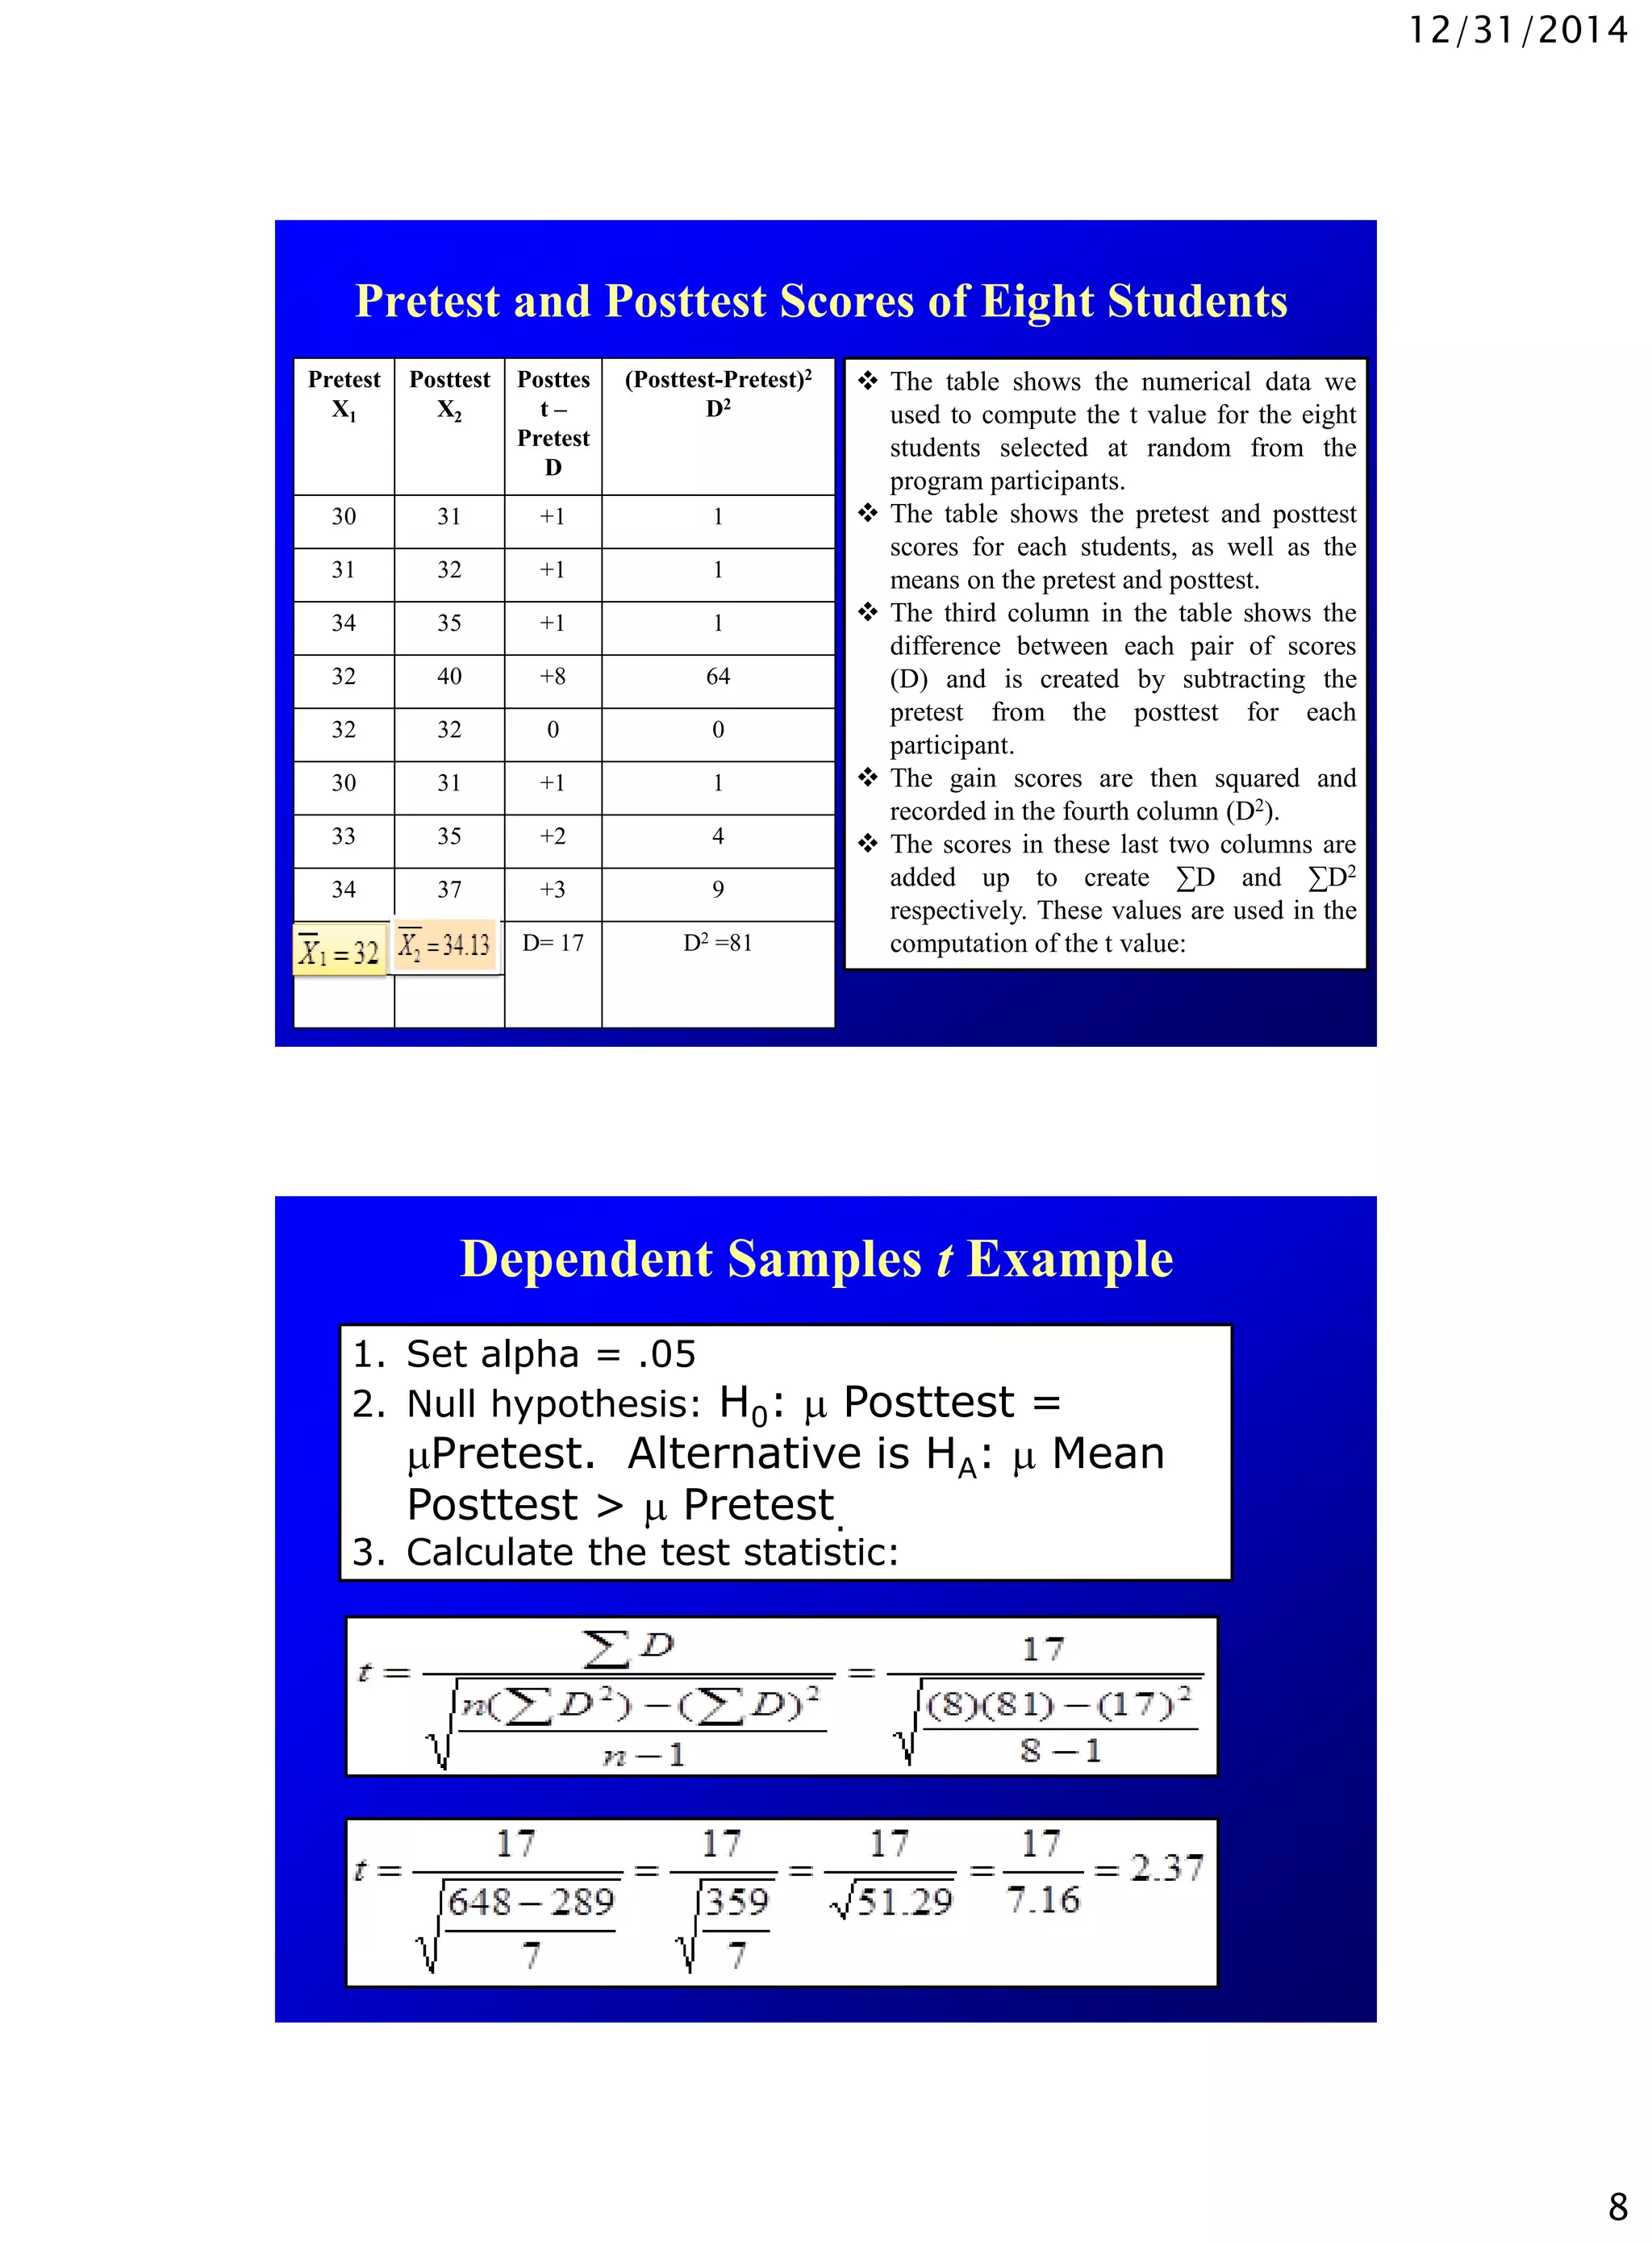
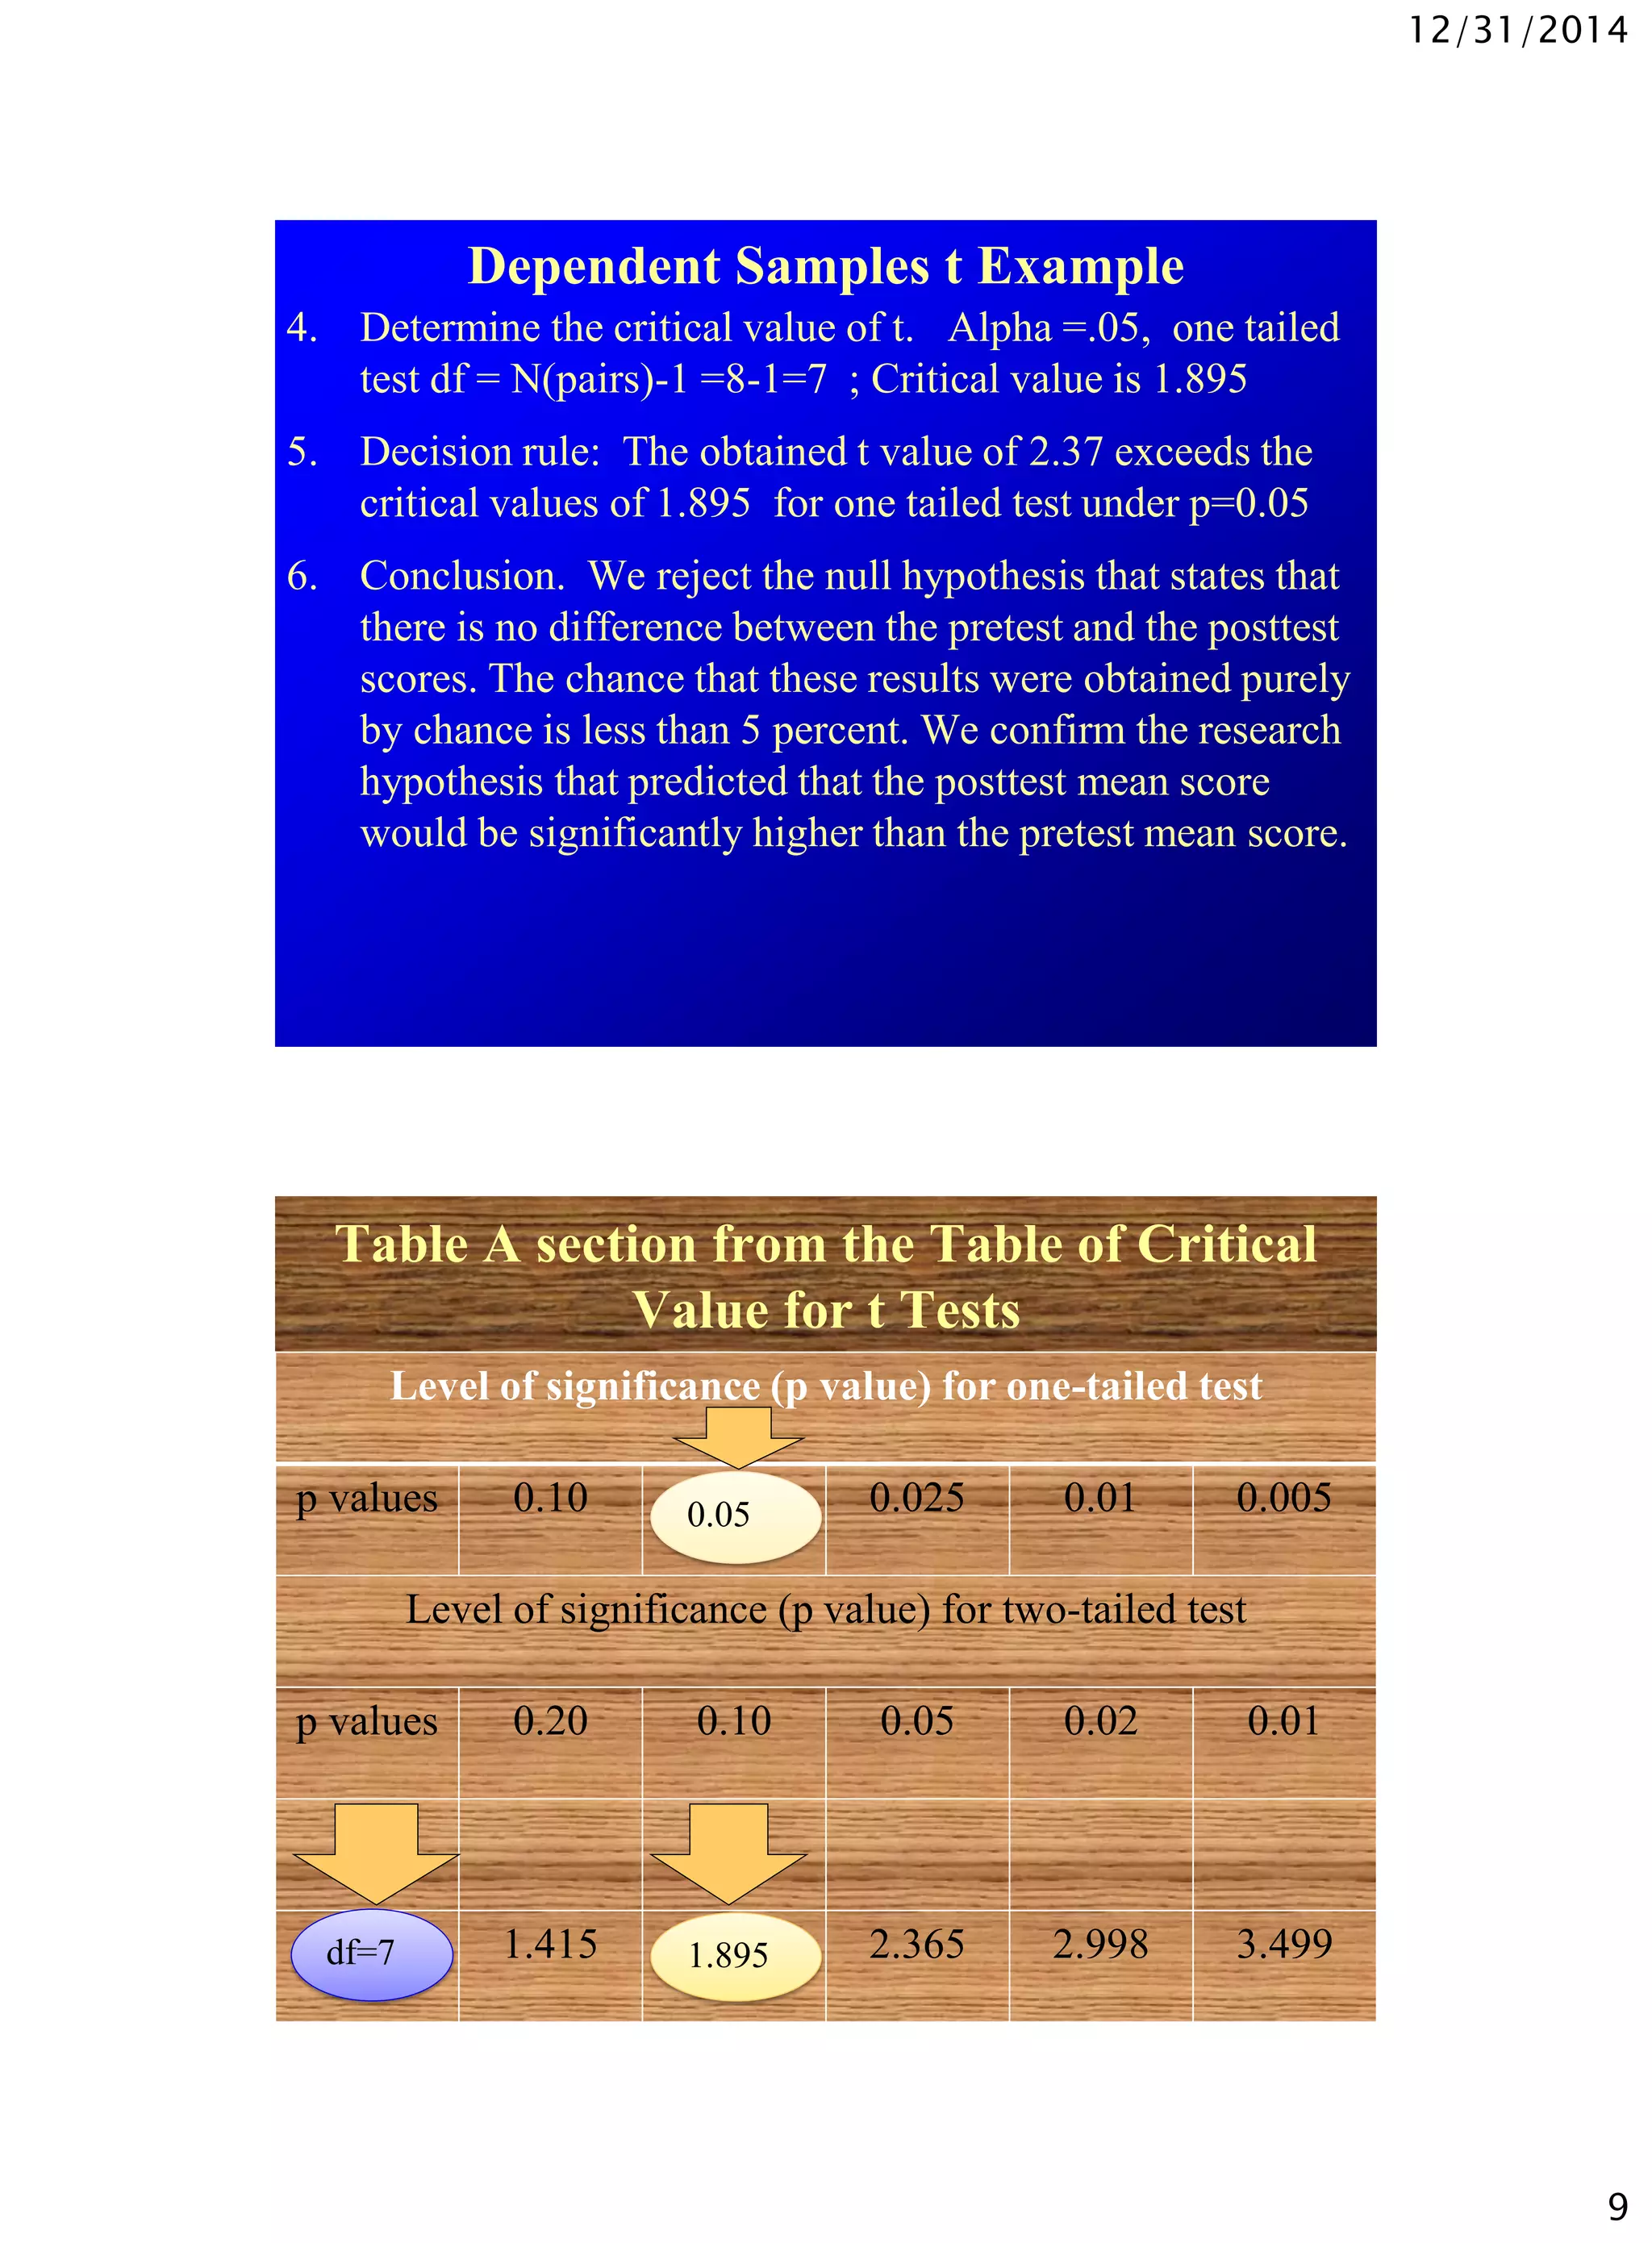
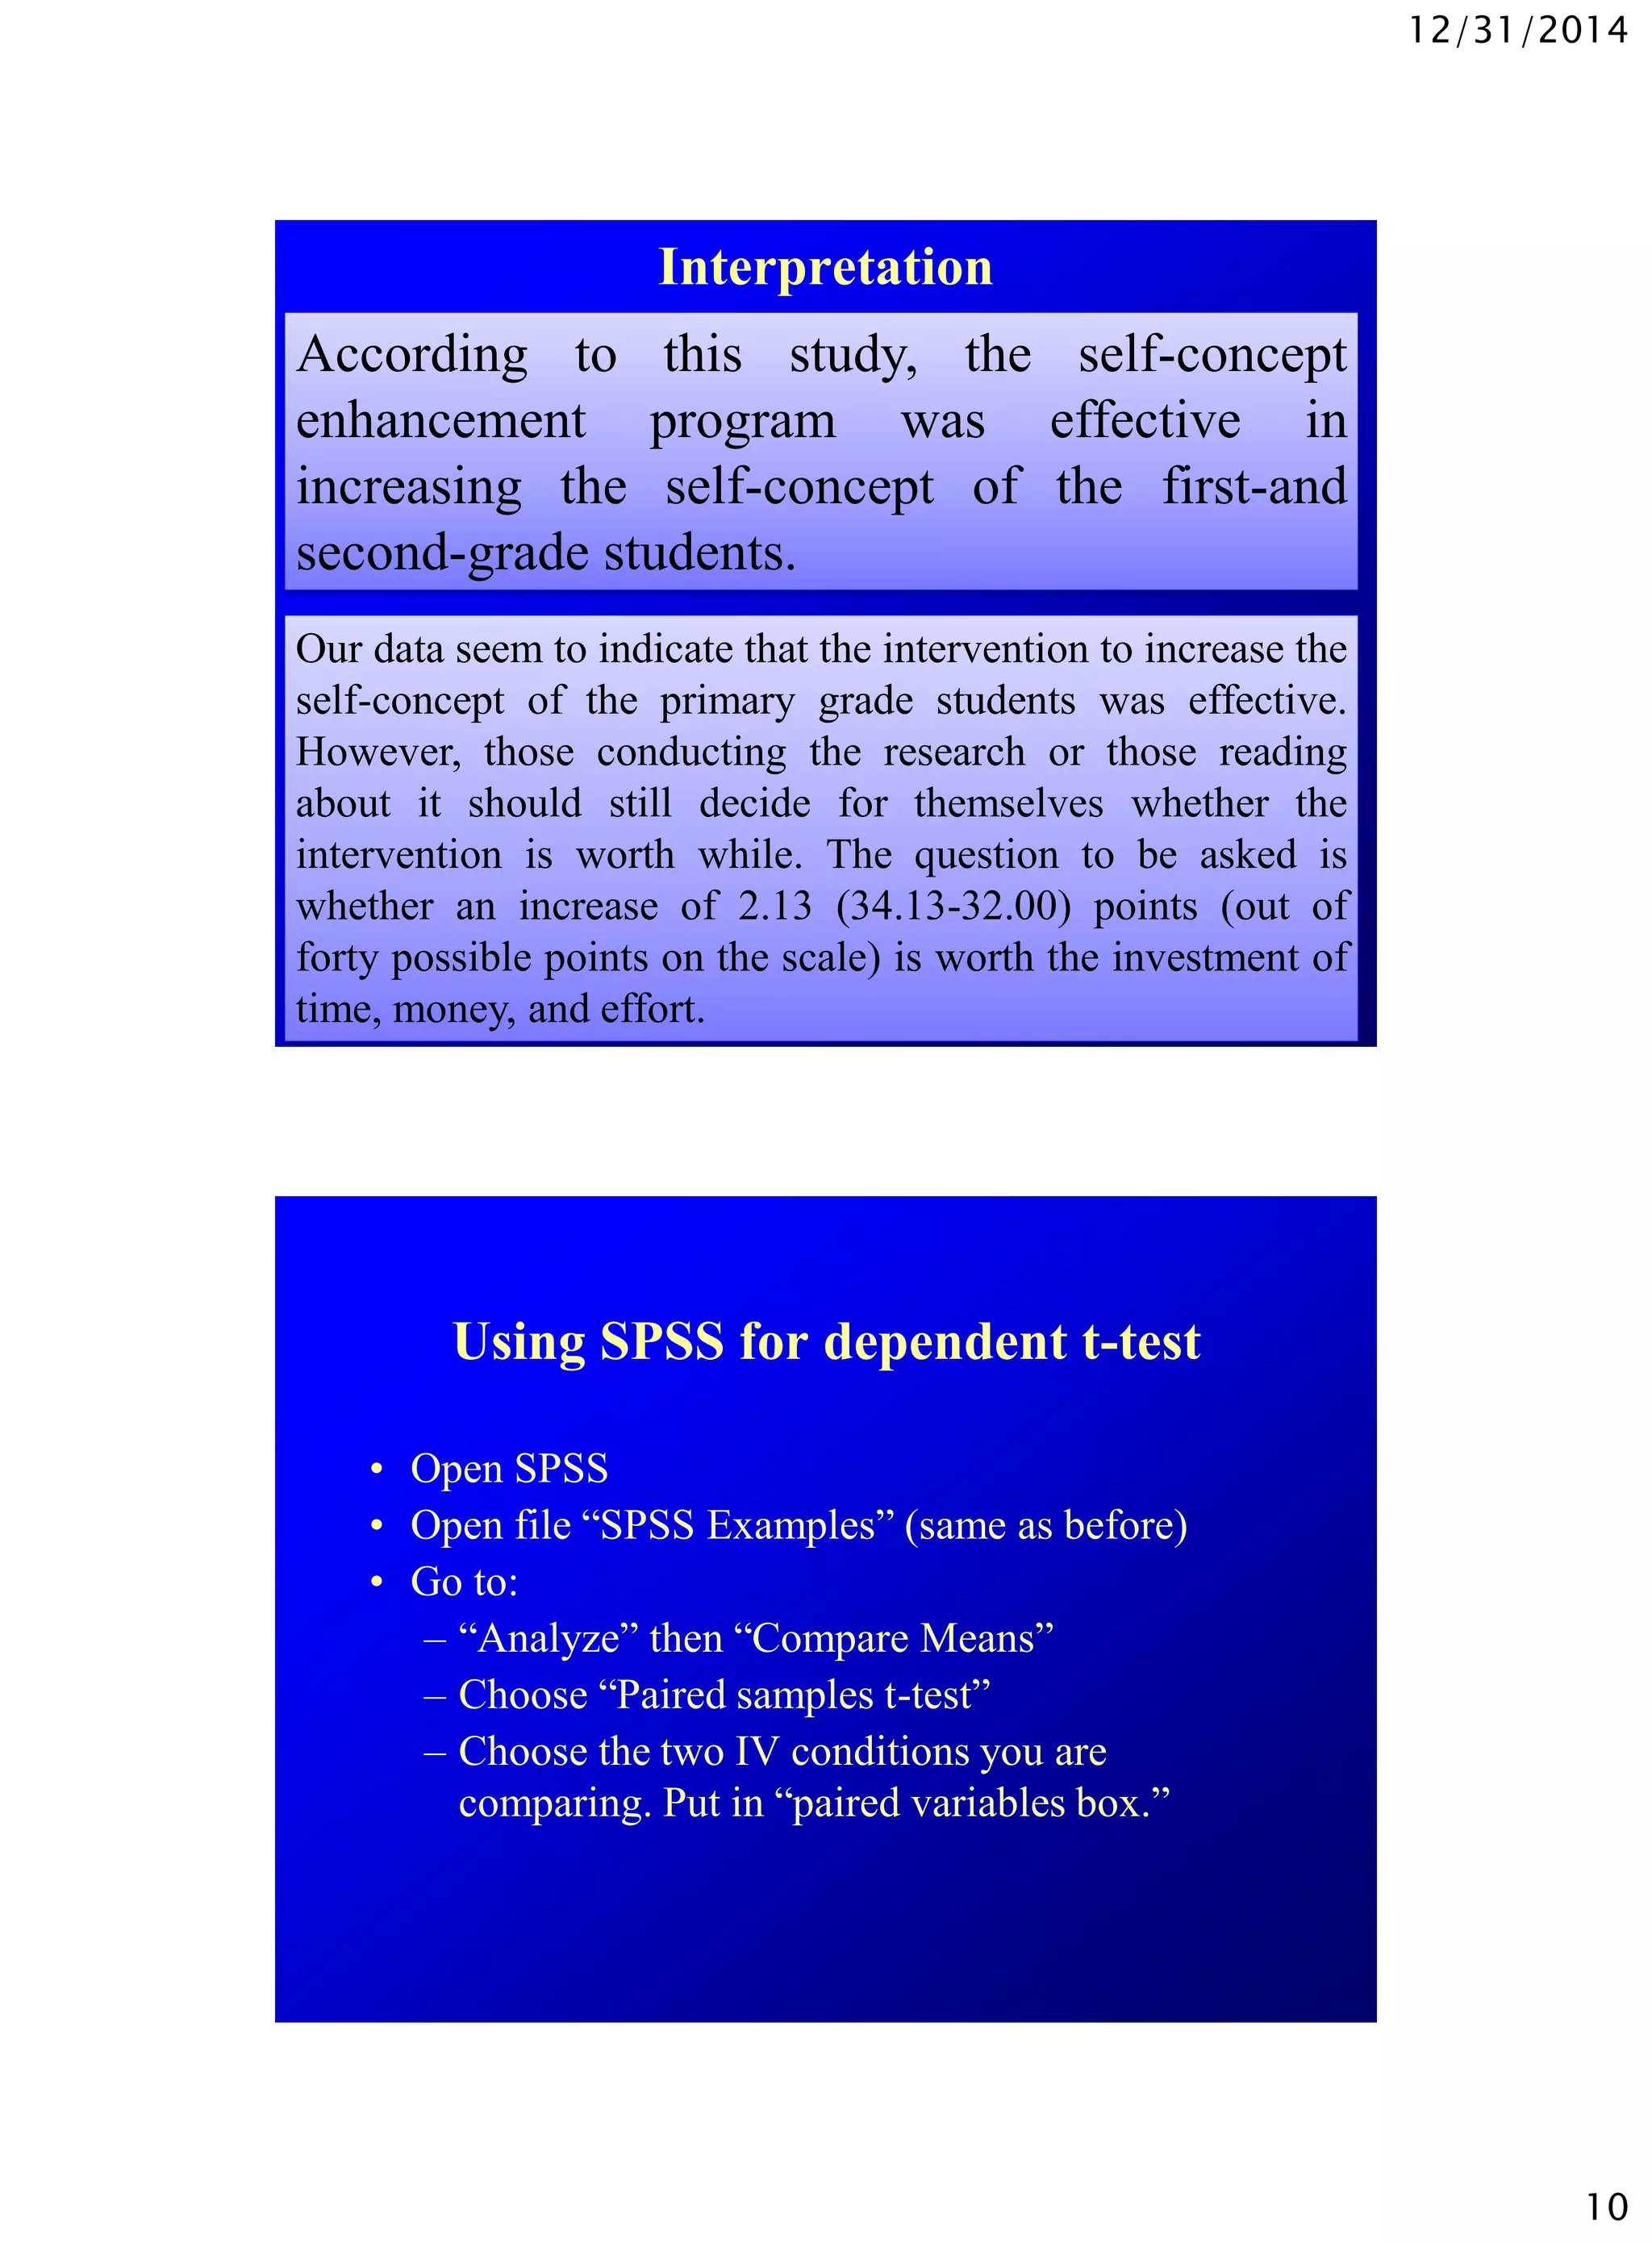
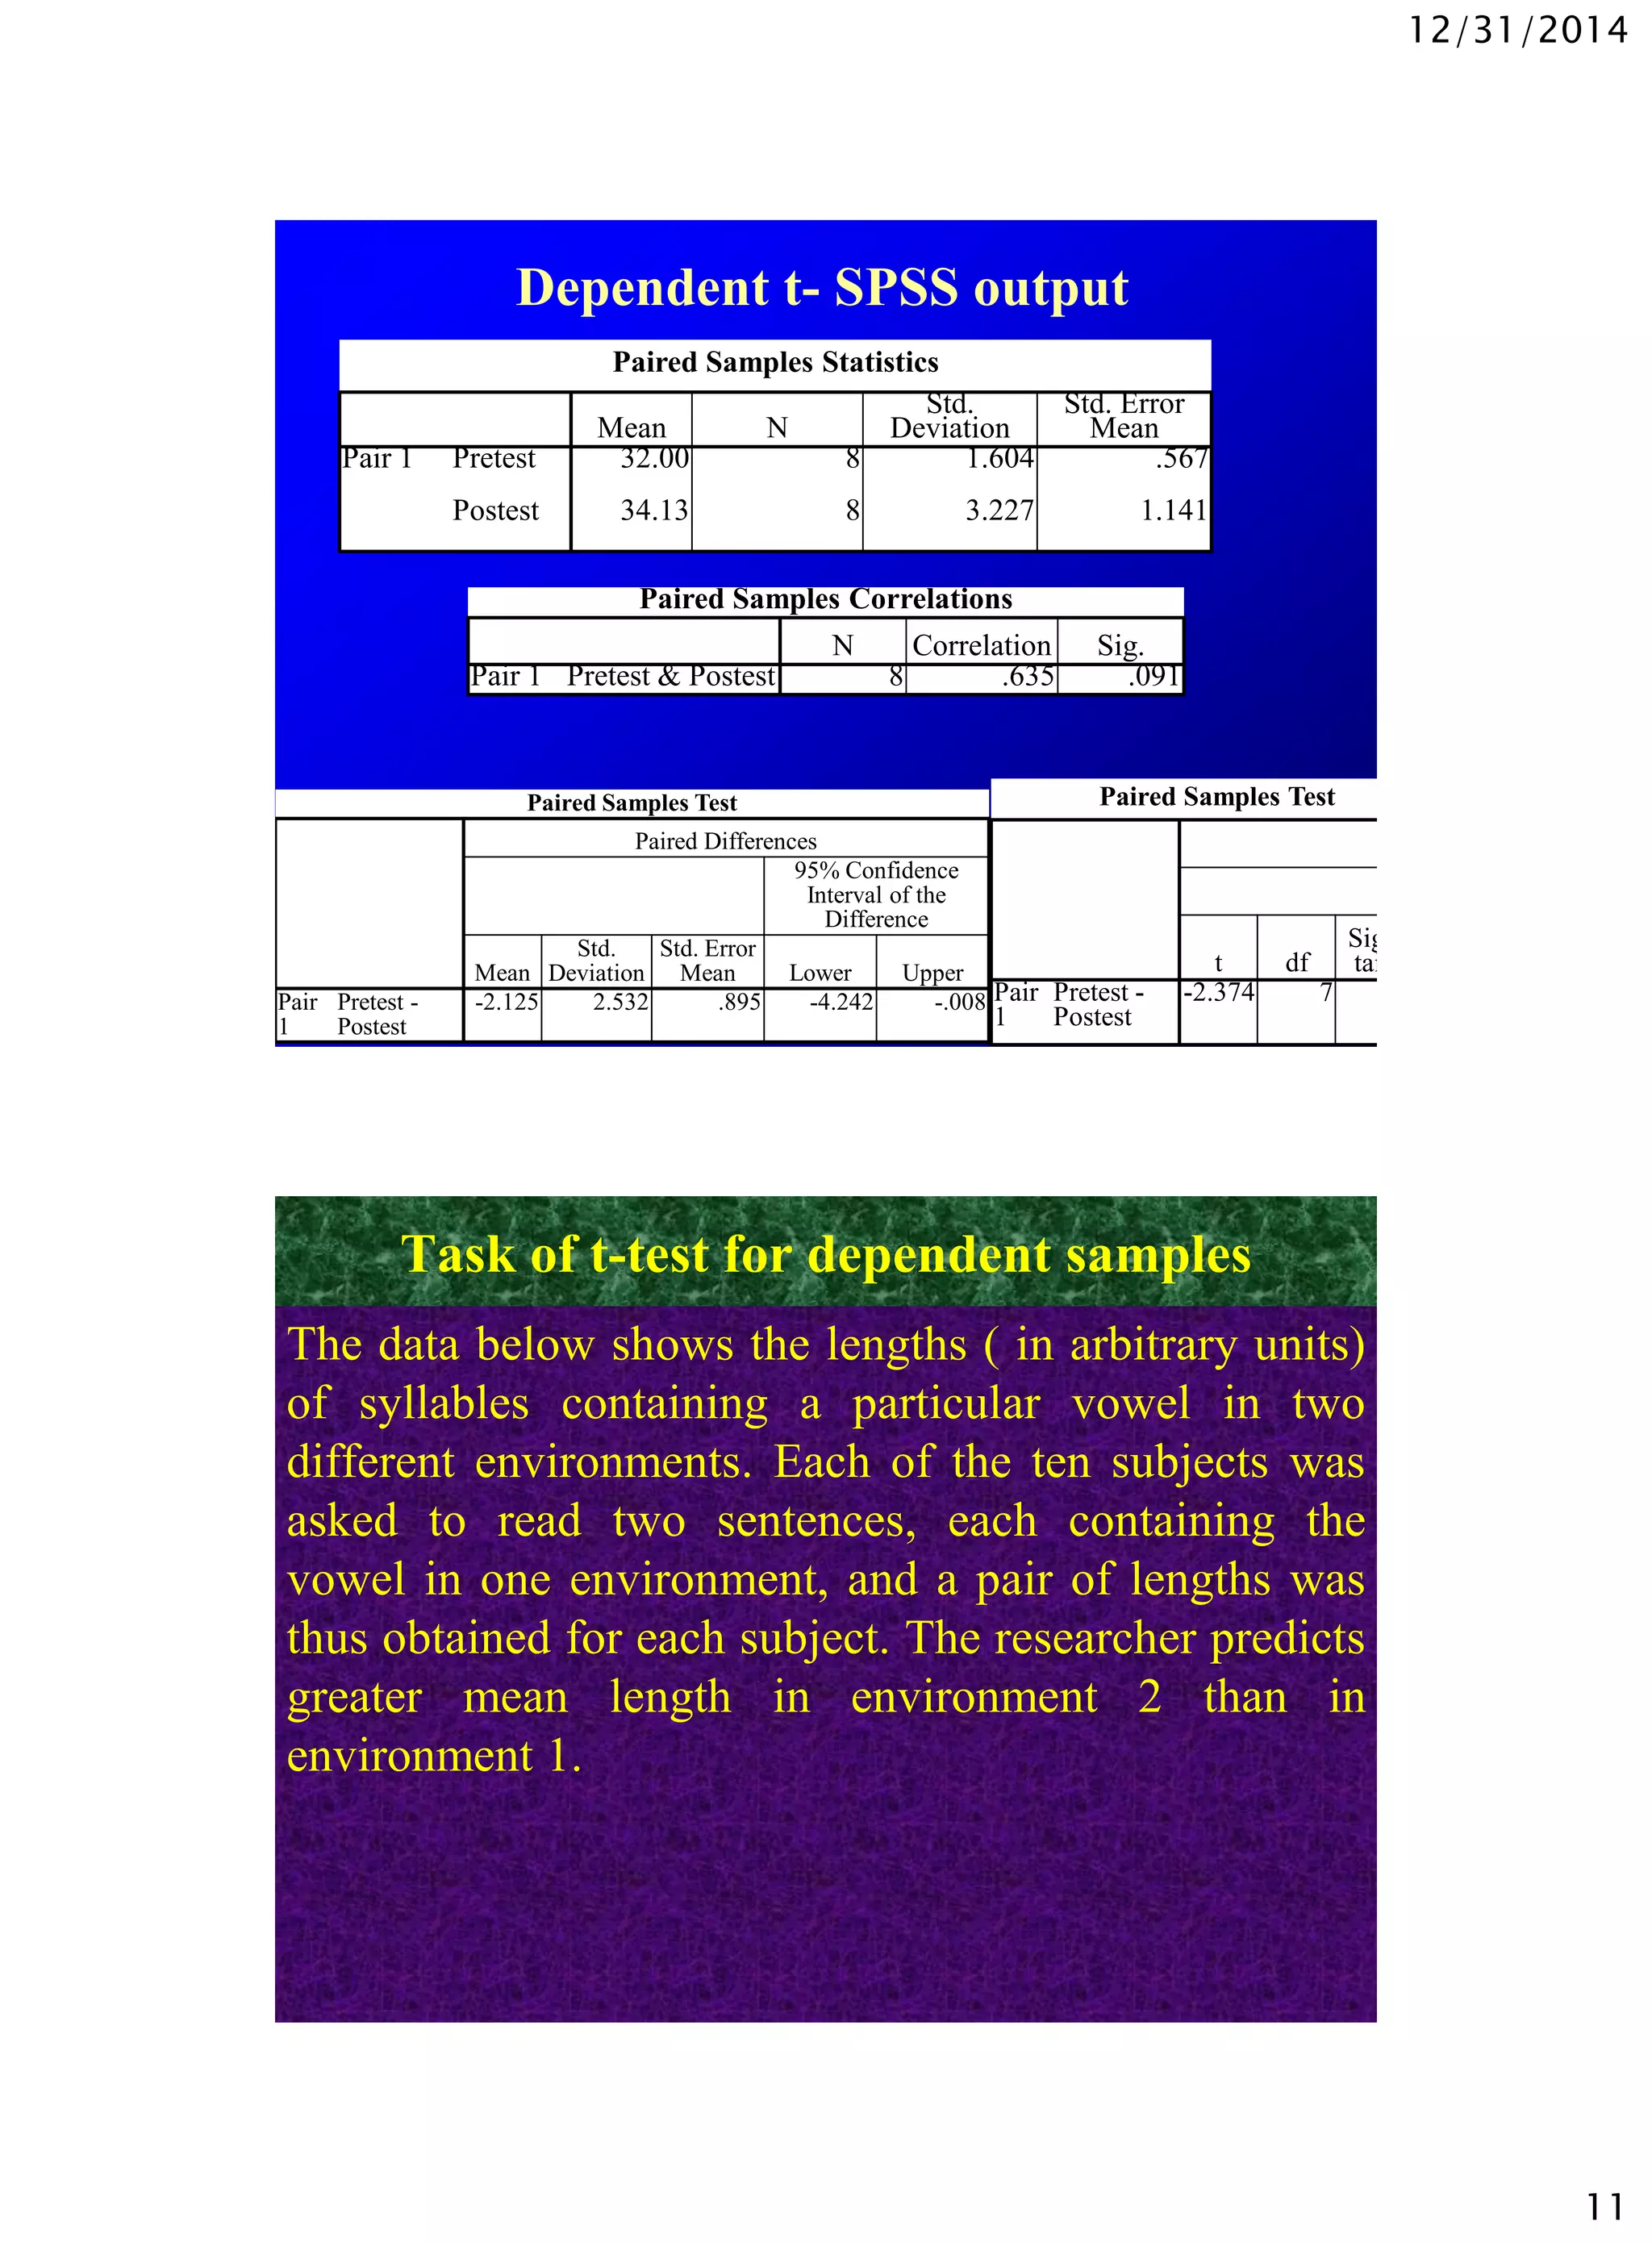
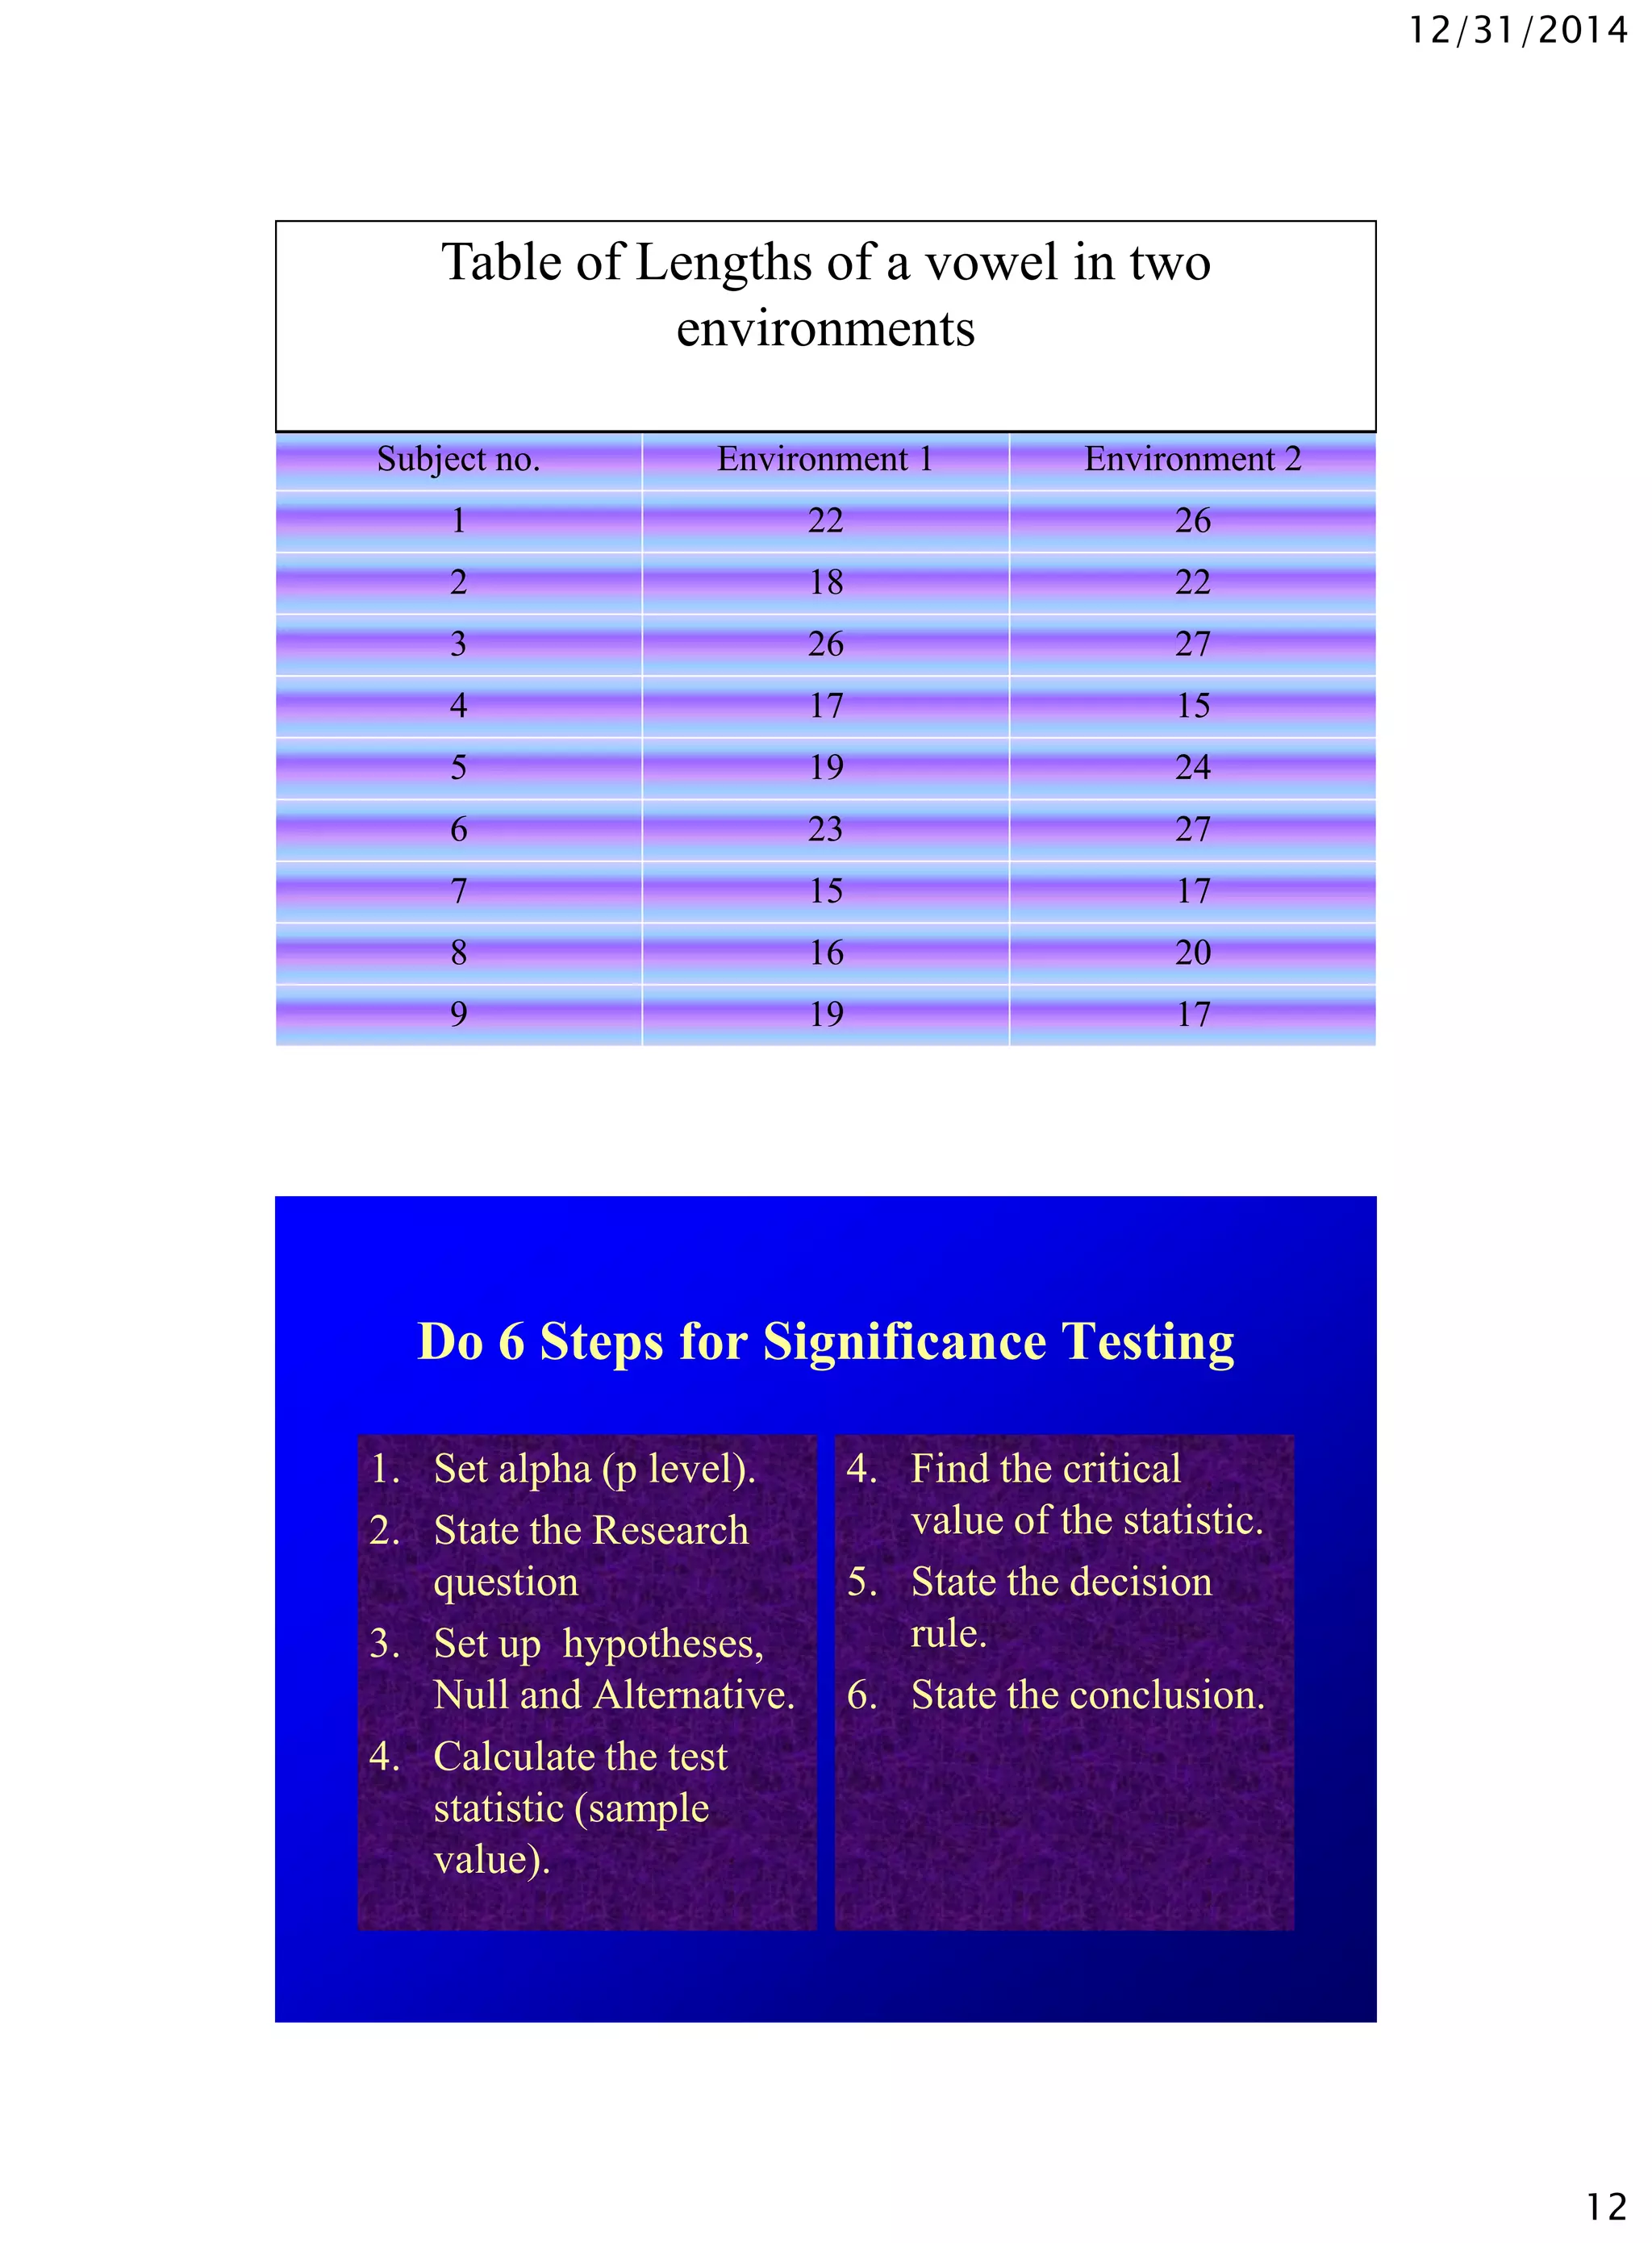
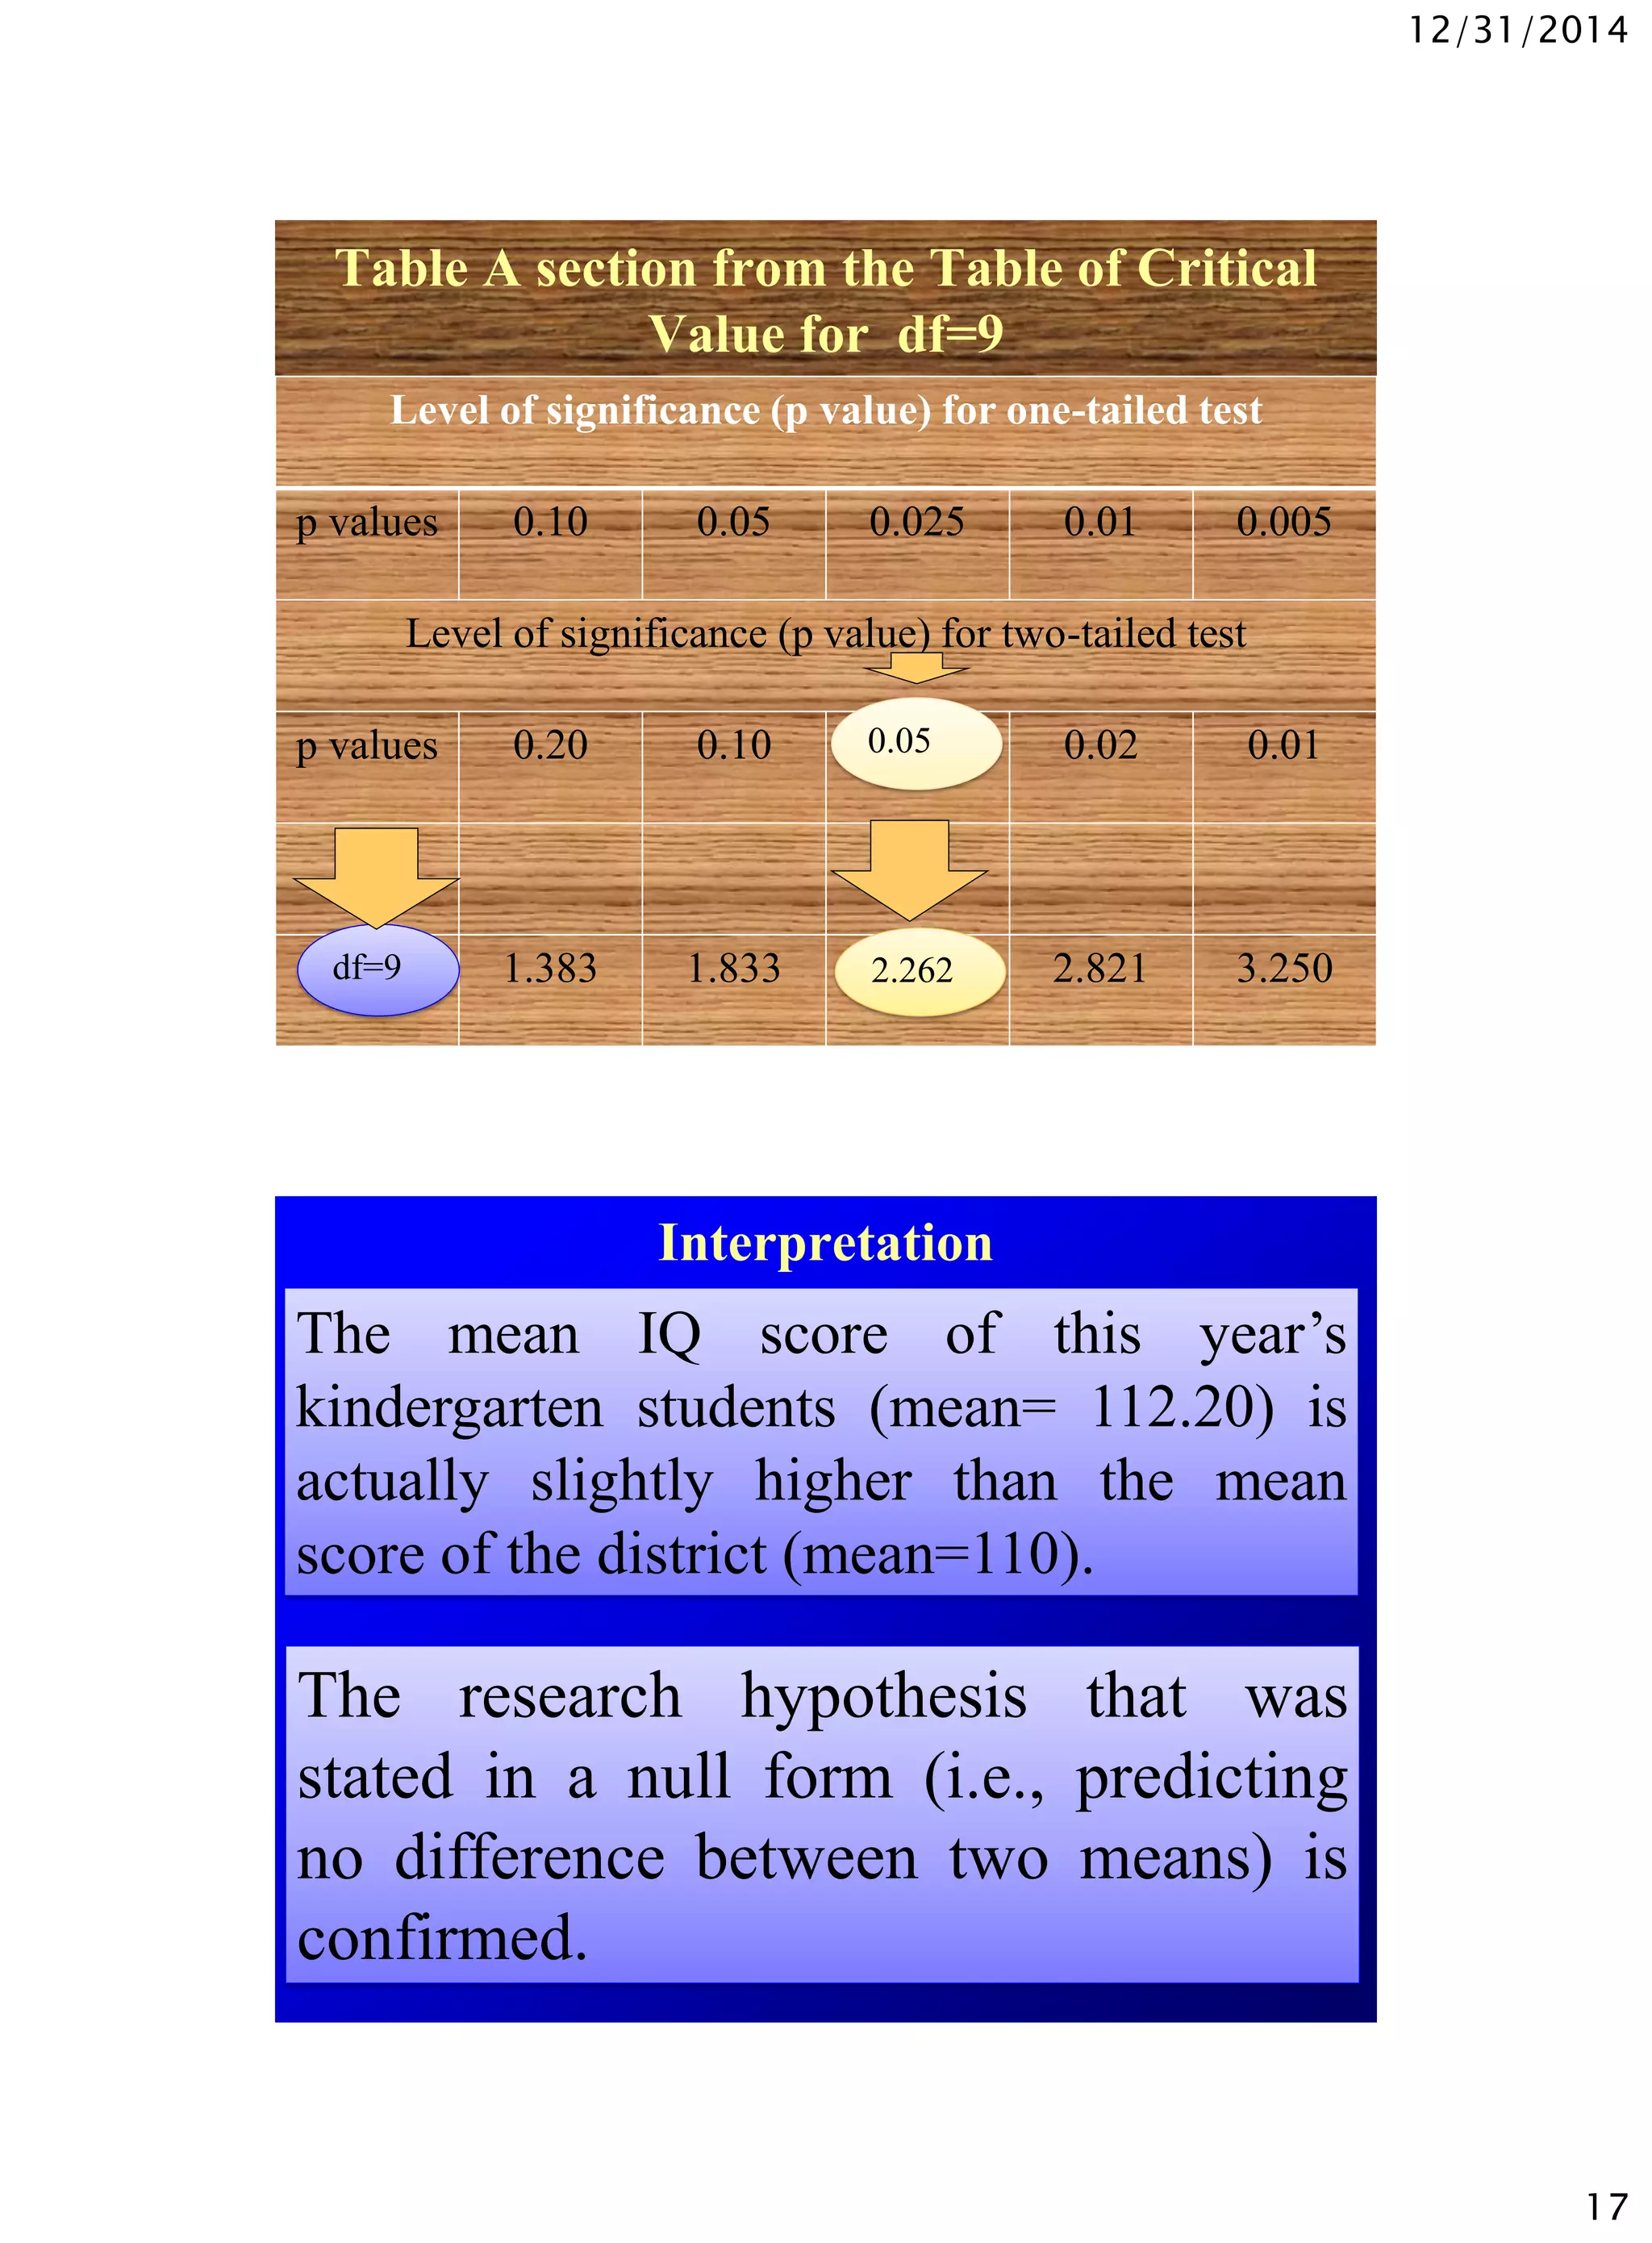
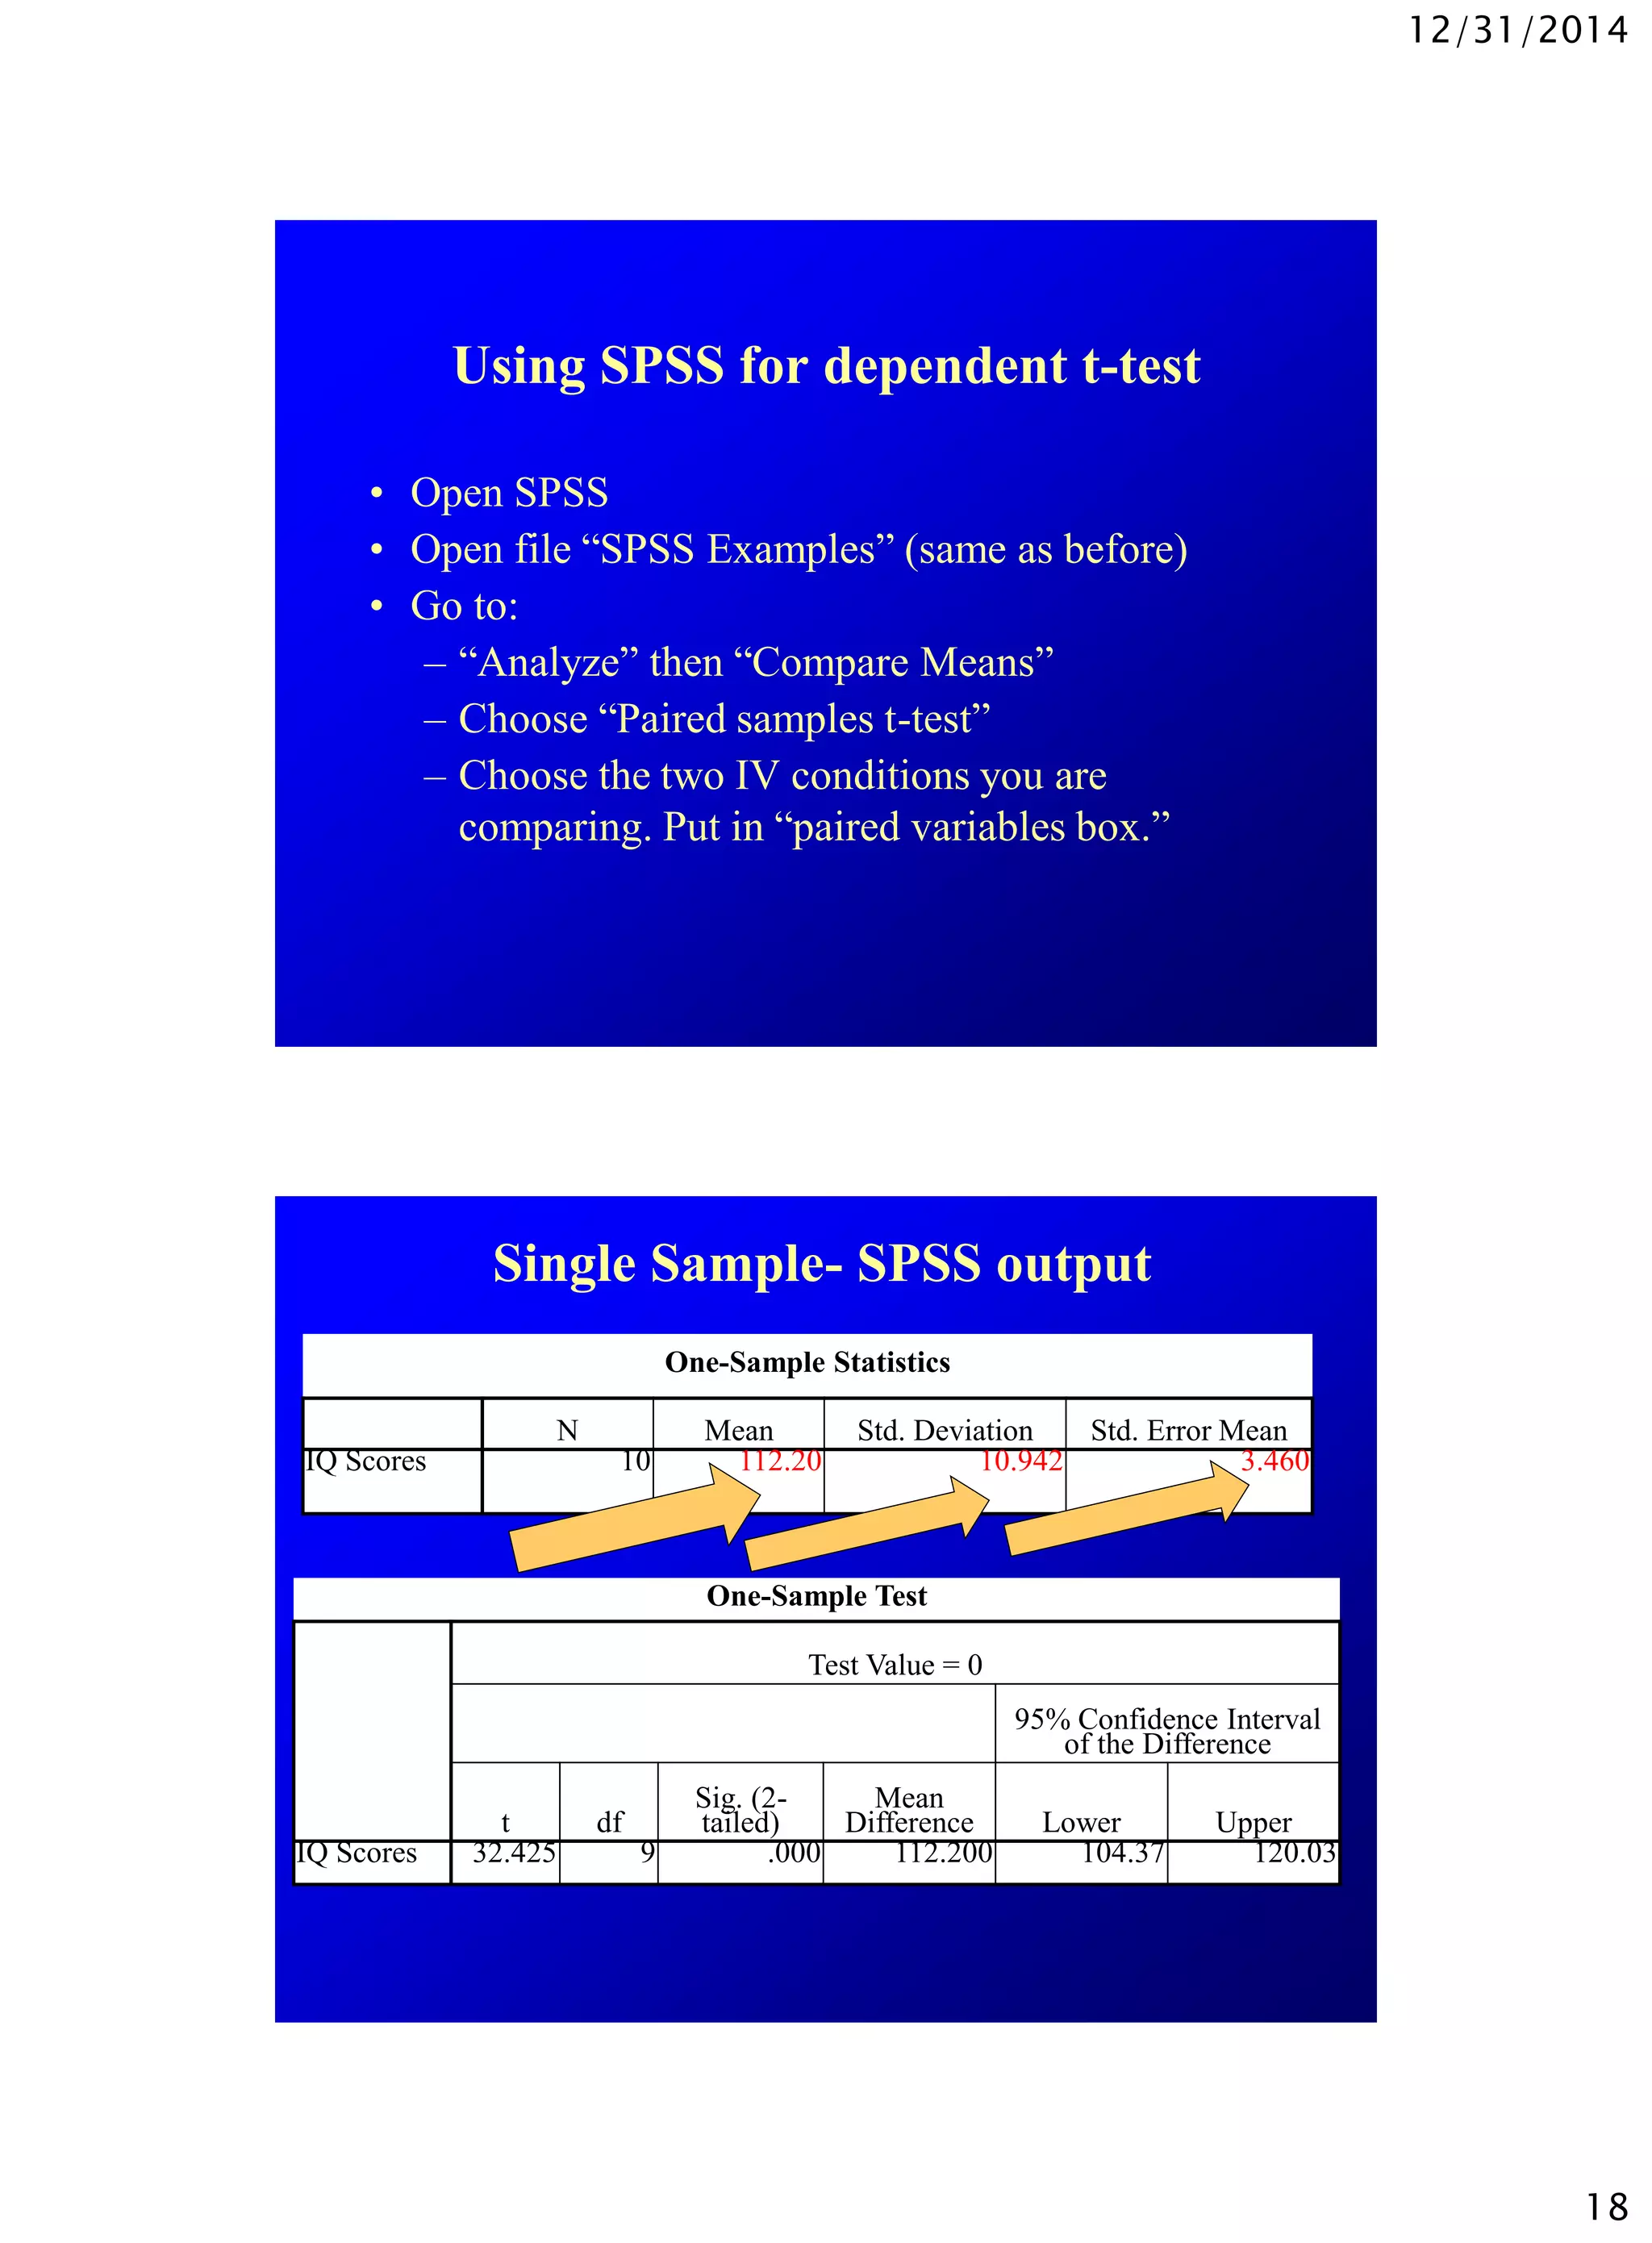
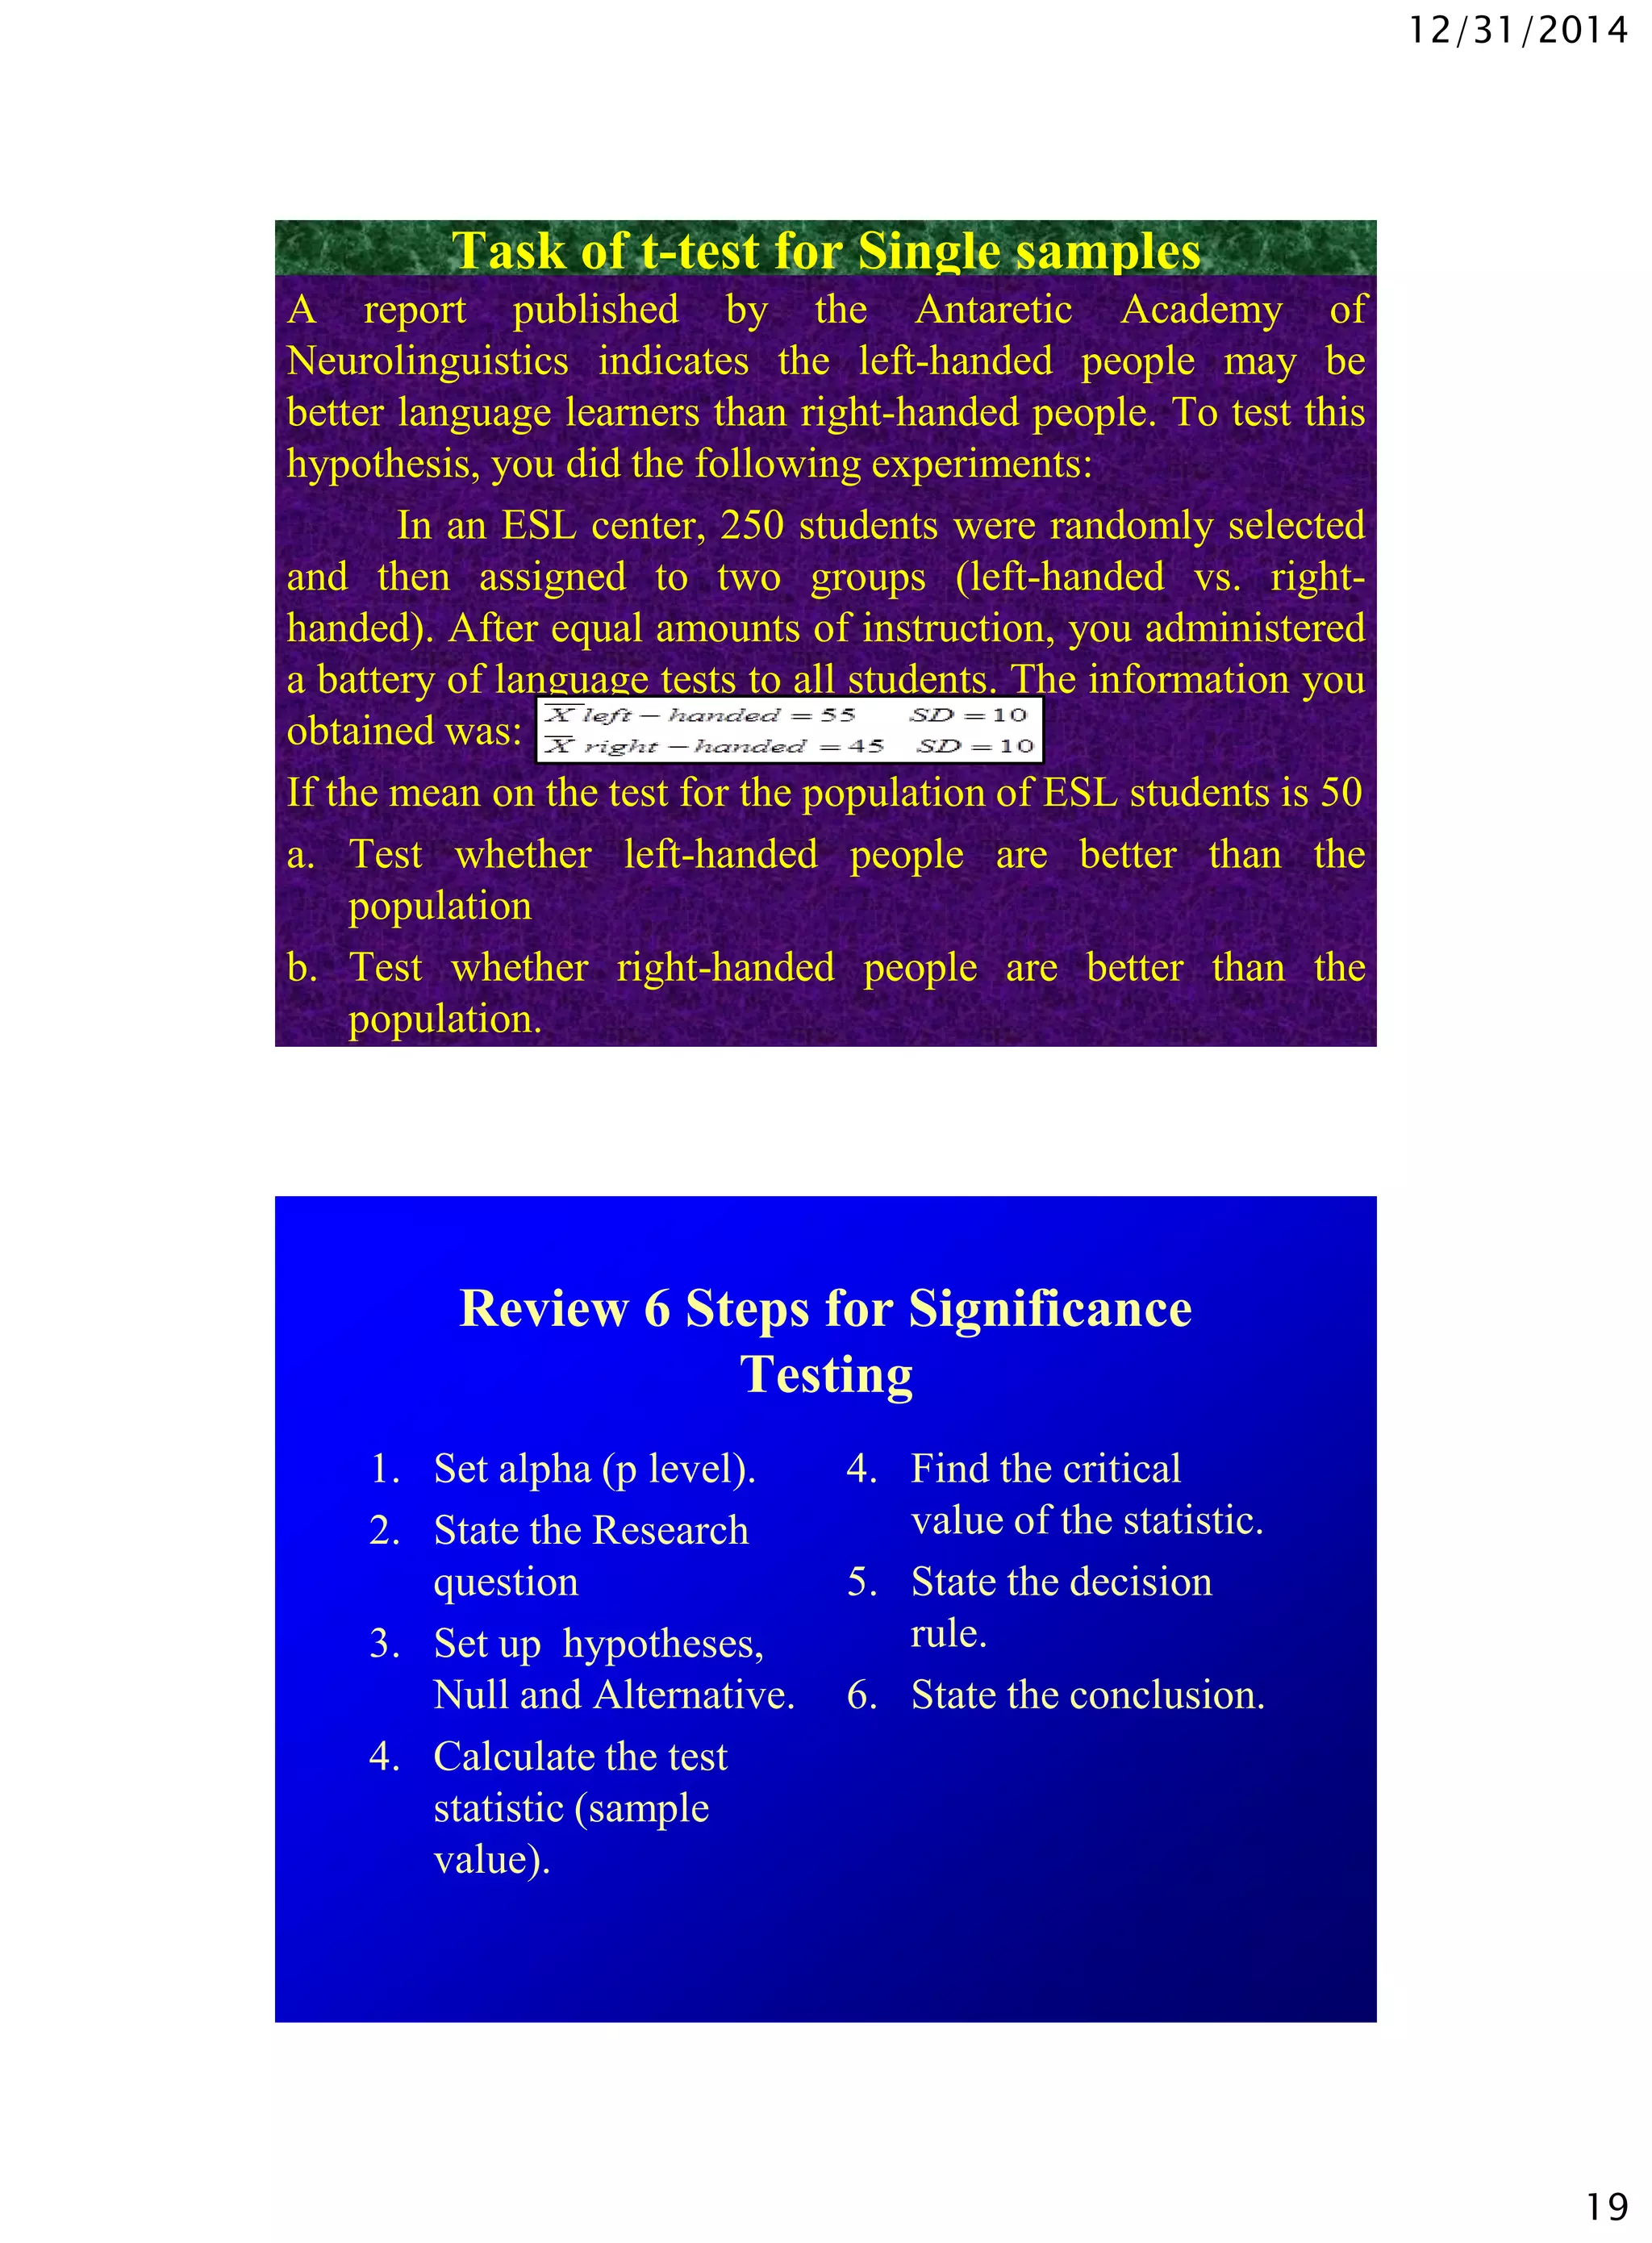
SlideShare a Scribd company logo
12/31/2014
1
Wednesday, December 31, 20141
Compute by hand and interpret
Dependent samples t test
Single sample t test
Use SPSS to compute the same tests
and interpret the output
12/31/2014
2
The Slides discuss
• Comparing two means to ascertain which mean is of greater
statistical significance.
• The statistical test used for this type of analysis is the t test,
and the statistic that is computed is called a t value.
• Three research situations in which the t test can be used to
analyze the data and compare the means from
a) Two paired samples (e.g., pretest and posttest scores); and
b) a sample and a population (e.g., comparing a mean of a
sample to the mean of the population).
• Examples with numerical data to illustrate each of the three
types of t tests.
• After t value is computed, you have decided whether it is
statistically significant and whether your research
hypothesis was confirmed.
STEPS IN THE PROCESS OF HYPOTHESIS TESTING
1. Formulating a research question for the study.
2. Stating a research hypothesis (i.e., an alternative hypothesis). The hypothesis should represent the
researcher’s prediction about the outcome of the study and should be testable. Note that a null
hypothesis for the study is always implied, but it is not formally stated in most cases. The null
hypothesis predicts no difference between groups or means or no relationship between variables.
3. Designing a study to test the research hypothesis. The study’s methodology should include plans
for selecting one or more samples from the population that in interest to researcher; selecting or
designing instruments to gather the numerical data; carrying out the study’s procedure (and
intervention in experimental studies); and determining the statistical test(s) to be used to analyze
the data.
4. Conducting the study and collecting numerical data.
5. Analyzing the data and calculating the appropriate test statistics (e.g., Pearson correlation
coefficient, t test value or chi square value).
6. Determining the appropriate p value.
7. Deciding whether to retain or reject the null hypothesis. A p value of 0.05 is the most commonly
used benchmark to consider the results statistically significant. If the results are statistically
significant, the researcher may also wish to calculate the effect size (EF) to determine the
practical significance of the study’s results.
8. Making a decision whether to confirm the study’s alternative hypothesis (i.e., the research
hypothesis ) and how probable it is that the results were obtained purely by chance. This decision
is based on the decision made regarding the null hypothesis.
9. Summarizing the study’s conclusion, addressing the study’s research question.
12/31/2014
3
Assumptions of t-Test
• The groups are independent of each other.
• A person (or case) may appear in only one group.
• When the two group are approximately the same size,
there is no need for the homogeneity of variance. This
assumption is called the assumption of the homogeneity
of variance.
• We compare the two variances to determine if there is a
statistically significant difference between them.
• To test for the assumption of the homogeneity of the
variances, we divide the larger variance by the smaller
variance and obtain a ratio, called the F value.
• When the F value is statistically significant we cannot
assume that the variance are equal.
Assumptions of t-Test
• A test for the equality of variance, such as the levene’s is
used to test the significance of the F value. An F value
that is not statistically significant (p>0.05) indicates that
the assumption for the homogeneity of variance is not
violated and, therefore, equal variances can be assumed ,
on the other hand, a significant F value (p< 0.05)
indicates that the assumption for the homogeneity of
variance was violated. The t test statistical results are
adjusted for the unequal variance.
12/31/2014
4
Assumptions of t-Test
• The independent variables are interval or ratio.
• The population from which samples are drawn is
normally distributed.
• Samples are randomly selected.
• The groups have equal variance (Homogeneity of
variance).
• The t-statistic is robust (it is reasonably reliable even if
assumptions are not fully met). Therefore, even if the
assumption of the homogeneity of variance is not fully
met, the researcher can probably still use the test to
analyze the data.
A t-test is used to compare two means in three different situations
T Test
t-test for independent
samples
- The two groups whose
means are being
compared are
independent of each other
Ex: a comparison of
experimental and control
groups.
T-test for paired samples (t-test for
dependent, matched or correlation
samples)
The two means represent two
sets of scores that are paired.
Ex: a comparison of pretest
and posttest scores obtained
from one group of people
t-test for a single
sample
The t-test is used
when the mean of a
sample is compared
to the mean of a
population
12/31/2014
5
Dependent Samples
t-tests
Dependent Samples t-test
• A t test for paired samples (dependent sample t-test) is used
when the two means being compared come from two sets of
scores that are related to each other.
• It is used, for example, in experimental research to measure
the effect of an intervention (a treatment) by comparing the
posttest to the pretest scores.
• The most important requirement for conducting this t test is
that the two sets of scores are paired: they belong to the
same individuals.
• Useful to control individual differences. Can result in more
powerful test than independent samples t-test.
12/31/2014
6
Computing the paired-samples t-test
• First find for each person the difference (D) between the
two scores (e.g., between pretest and posttest) and sum up
those difference (∑ D). Usually, the lower scores (e.g.,
pretest) are subtracted from the higher scores (e.g., posttest)
so D values are always positive.
• We also need to compute the sum of the squares of the
difference (∑ D2). Finally the t value is computed using the
formula:
The example that follows demonstrates the computation of a paired-
samples t test. To simplify the computations , we use scores of eight
students only. Of course, in conducting real-life research, it is
recommended that larger samples (thirty or more) be used.
12/31/2014
7
An example of a t Test
for dependent samples or paired samples
Research has documented the potential effect of students’ positive self-concept on
their self-reflections, attitudes toward self, schoolwork, and general development. A
special program is developed by school psychologists and primary grade teachers to
enhance the self-concept of young-age children. The program is implemented in
Sunny Bay School with four groups of first-and second-grade students. The
intervention lasts six weeks and involves various activities in the class and at home.
The instrument used to assess the effectiveness of the program is comprised of forty
pictures, and scores can range from 0 to 40. The program coordinator conducts a
series of workshops to train five graduate students to administer the instrument. All of
the children in the program are tested before the start of the program and then again
during the first week after the end of the program. A t test for paired samples is used
to test the hypothesis that students’ self-concept would improve significantly on the
posttest, compared with their pretest scores. The research hypothesis is:
HA: Mean POSTTEST > Mean PRETEST
Ho: Mean POSTTEST = Mean PRETEST
Review 6 Steps for Significance
Testing
1. Set alpha (p level).
2. State the Research
question
3. Set up hypotheses,
Null and Alternative.
4. Calculate the test
statistic (sample
value).
4. Find the critical
value of the statistic.
5. State the decision
rule.
6. State the conclusion.
12/31/2014
8
Pretest and Posttest Scores of Eight Students
Pretest
X1
Posttest
X2
Posttes
t –
Pretest
D
(Posttest-Pretest)2
D2
30 31 +1 1
31 32 +1 1
34 35 +1 1
32 40 +8 64
32 32 0 0
30 31 +1 1
33 35 +2 4
34 37 +3 9
D= 17 D2 =81
 The table shows the numerical data we
used to compute the t value for the eight
students selected at random from the
program participants.
 The table shows the pretest and posttest
scores for each students, as well as the
means on the pretest and posttest.
 The third column in the table shows the
difference between each pair of scores
(D) and is created by subtracting the
pretest from the posttest for each
participant.
 The gain scores are then squared and
recorded in the fourth column (D2).
 The scores in these last two columns are
added up to create ∑D and ∑D2
respectively. These values are used in the
computation of the t value:
Dependent Samples t Example
1. Set alpha = .05
2. Null hypothesis: H0:  Posttest =
Pretest. Alternative is HA:  Mean
Posttest >  Pretest.
3. Calculate the test statistic:
12/31/2014
9
Dependent Samples t Example
4. Determine the critical value of t. Alpha =.05, one tailed
test df = N(pairs)-1 =8-1=7 ; Critical value is 1.895
5. Decision rule: The obtained t value of 2.37 exceeds the
critical values of 1.895 for one tailed test under p=0.05
6. Conclusion. We reject the null hypothesis that states that
there is no difference between the pretest and the posttest
scores. The chance that these results were obtained purely
by chance is less than 5 percent. We confirm the research
hypothesis that predicted that the posttest mean score
would be significantly higher than the pretest mean score.
Table A section from the Table of Critical
Value for t Tests
Level of significance (p value) for one-tailed test
p values 0.10 0.05 0.025 0.01 0.005
Level of significance (p value) for two-tailed test
p values 0.20 0.10 0.05 0.02 0.01
df=7 1.415 1.895 2.365 2.998 3.4991.895
0.05
df=7
12/31/2014
10
Interpretation
According to this study, the self-concept
enhancement program was effective in
increasing the self-concept of the first-and
second-grade students.
Our data seem to indicate that the intervention to increase the
self-concept of the primary grade students was effective.
However, those conducting the research or those reading
about it should still decide for themselves whether the
intervention is worth while. The question to be asked is
whether an increase of 2.13 (34.13-32.00) points (out of
forty possible points on the scale) is worth the investment of
time, money, and effort.
Using SPSS for dependent t-test
• Open SPSS
• Open file “SPSS Examples” (same as before)
• Go to:
– “Analyze” then “Compare Means”
– Choose “Paired samples t-test”
– Choose the two IV conditions you are
comparing. Put in “paired variables box.”
12/31/2014
11
Dependent t- SPSS output
Paired Samples Statistics
Mean N
Std.
Deviation
Std. Error
Mean
Pair 1 Pretest 32.00 8 1.604 .567
Postest 34.13 8 3.227 1.141
Paired Samples Correlations
N Correlation Sig.
Pair 1 Pretest & Postest 8 .635 .091
Paired Samples Test
Paired Differences
95% Confidence
Interval of the
Difference
Mean
Std.
Deviation
Std. Error
Mean Lower Upper
Pair
1
Pretest -
Postest
-2.125 2.532 .895 -4.242 -.008
Paired Samples Test
t df
Sig. (2-
tailed)
Pair
1
Pretest -
Postest
-2.374 7 .049
Task of t-test for dependent samples
The data below shows the lengths ( in arbitrary units)
of syllables containing a particular vowel in two
different environments. Each of the ten subjects was
asked to read two sentences, each containing the
vowel in one environment, and a pair of lengths was
thus obtained for each subject. The researcher predicts
greater mean length in environment 2 than in
environment 1.
12/31/2014
12
Subject no. Environment 1 Environment 2
1 22 26
2 18 22
3 26 27
4 17 15
5 19 24
6 23 27
7 15 17
8 16 20
9 19 17
10 25 30
Table of Lengths of a vowel in two
environments
Do 6 Steps for Significance Testing
1. Set alpha (p level).
2. State the Research
question
3. Set up hypotheses,
Null and Alternative.
4. Calculate the test
statistic (sample
value).
4. Find the critical
value of the statistic.
5. State the decision
rule.
6. State the conclusion.
12/31/2014
13
t-Tests for a Single
Sample
t-Test for a Single Sample
• A t test for single sample is used when the mean of a sample
is compared to the mean of a population.
• Occasionally, a researcher is interested in comparing a
single group (a sample) to a larger group (a population).
• For example, a high school teacher of a freshmen-
accelerated English class may want to confirm that the
students in that class had obtained higher scores on an
English placement test compared with their peers.
• In order to carry out this kind of a study the researcher must
know prior to the start of the study the mean value of the
population. In this example, the mean score of the
population is the overall mean of the scores of all freshmen
on the English placement test.
12/31/2014
14
Computing t-Test for Single sample
• The t value is computed using the formula:
An example of a t Test
for Single sample
A kindergarten teacher in a school commented to her colleague that the students in
her class this year seem to be less bright than those she had in the past. Her colleague
disagrees with her, and to test whether the first-graders this year are really different
from those in previous years, they conduct a test for a single sample. The scores used
are from the Wechsler Preschool and Primary Scale of Intelligence Third Edition
(WPPSI-III), which is given every year to all kindergarten students in the district. In
this example, we consider the district to be the population to which we compare the
mean of the current kindergarten class. Although the mean IQ score of the population
at large is 100 (µ=100), this district’s mean IQ score is 110 (µ= 110), and this mean is
used in the analysis. The research hypothesis is stated as a null hypothesis and
predicts that there is no statistically significant difference in the mean IQ score of this
year’s kindergarten students (the sample) and the mean IQ score of all kindergarten
students in the district (the population) that were gathered and recorded over the last
three years.
Ho: Mean Class = Mean District
12/31/2014
15
Review 6 Steps for Significance
Testing
1. Set alpha (p level).
2. State the Research
question
3. Set up hypotheses,
Null and Alternative.
4. Calculate the test
statistic (sample
value).
4. Find the critical
value of the statistic.
5. State the decision
rule.
6. State the conclusion.
Table IQ scores of Ten Students
Scores
115 118
135 113
105 98
107 120
112 99
∑X= 1,122
¯X=112.20
SD= 10.94
In order to test their
hypothesis, the two teachers
randomly select IQ scores of
ten students from this year’s
kindergarten class.
These IQ scores are listed in the
table followed by the
computation of the t value.
12/31/2014
16
Dependent Samples t Example
1. Is there any differences between this year’s
kindergarten class and the “typical kindergarten
students in the district?
2. Null hypothesis: H0:  Class =  District : there
is no significant difference between this year’s
kindergarten class and the “typical” kindergarten
students in the district.
3. Alternative is HA:  Class ≠  District.
4. Calculate the test statistic:
Single Samples t Example
4. Determine the critical value of t. Alpha =.05, two tailed
test df = N(pairs)-1 =10-1=9 ; Critical value is 1.895
5. Decision rule: The obtained t value of 0.64 does not
exceeds the critical values of 2.262 for two tailed test
under p=0.05 (because our hypothesis is non-directional)
6. Conclusion. We retain the null hypothesis that states that
there is no significant difference between this year’s
kindergarten class and the “typical” kindergarten students
in the district.
12/31/2014
17
Table A section from the Table of Critical
Value for df=9
Level of significance (p value) for one-tailed test
p values 0.10 0.05 0.025 0.01 0.005
Level of significance (p value) for two-tailed test
p values 0.20 0.10 0.05 0.02 0.01
df=9 1.383 1.833 2.262 2.821 3.2502.262
0.05
df=9
Interpretation
The mean IQ score of this year’s
kindergarten students (mean= 112.20) is
actually slightly higher than the mean
score of the district (mean=110).
The research hypothesis that was
stated in a null form (i.e., predicting
no difference between two means) is
confirmed.
12/31/2014
18
Using SPSS for dependent t-test
• Open SPSS
• Open file “SPSS Examples” (same as before)
• Go to:
– “Analyze” then “Compare Means”
– Choose “Paired samples t-test”
– Choose the two IV conditions you are
comparing. Put in “paired variables box.”
Single Sample- SPSS output
One-Sample Statistics
N Mean Std. Deviation Std. Error Mean
IQ Scores 10 112.20 10.942 3.460
One-Sample Test
Test Value = 0
95% Confidence Interval
of the Difference
t df
Sig. (2-
tailed)
Mean
Difference Lower Upper
IQ Scores 32.425 9 .000 112.200 104.37 120.03
12/31/2014
19
Task of t-test for Single samples
A report published by the Antaretic Academy of
Neurolinguistics indicates the left-handed people may be
better language learners than right-handed people. To test this
hypothesis, you did the following experiments:
In an ESL center, 250 students were randomly selected
and then assigned to two groups (left-handed vs. right-
handed). After equal amounts of instruction, you administered
a battery of language tests to all students. The information you
obtained was:
If the mean on the test for the population of ESL students is 50
a. Test whether left-handed people are better than the
population
b. Test whether right-handed people are better than the
population.
Review 6 Steps for Significance
Testing
1. Set alpha (p level).
2. State the Research
question
3. Set up hypotheses,
Null and Alternative.
4. Calculate the test
statistic (sample
value).
4. Find the critical
value of the statistic.
5. State the decision
rule.
6. State the conclusion.
12/31/2014
20
ReferencesMain Sources
Coolidge, F. L.2000. Statistics: A gentle introduction. London: Sage.
Kranzler, G & Moursund, J .1999. Statistics for the terrified. (2nd ed.). Upper Saddle
River, NJ: Prentice Hall.
Butler Christopher.1985. Statistics in Linguistics. Oxford: Basil Blackwell.
Hatch Evelyn & Hossein Farhady.1982. Research design and Statistics for Applied Linguistics.
Massachusetts: Newbury House Publishers, Inc.
Ravid Ruth.2011. Practical Statistics for Educators, fourth Ed. New York: Rowman &
Littlefield Publisher, Inc.
Quirk Thomas. 2012. Excel 2010 for Educational and Psychological Statistics: A Guide
to Solving Practical Problem. New York: Springer.
Other relevant sources
Agresi A, & B. Finlay.1986. Statistical methods for the social sciences. San Francisco,
CA: Dellen Publishing Company.
Bachman, L.F. 2004. Statistical Analysis for Language Assessment. New York: Cambridge University
Press.
Field, A. (2005). Discovering statistics using SPSS (2nd ed.). London: Sage.
Moore, D. S. (2000). The basic practice of statistics (2nd ed.). New York: W. H.
Freeman and Company.
Wednesday, December 31, 2014
39

More Related Content

What's hot

Source of Data in Research
Source of Data in ResearchSource of Data in Research
Source of Data in ResearchManu K M
 
Statistics
StatisticsStatistics
Statisticspikuoec
 
Population vs sample
Population vs samplePopulation vs sample
Population vs sample5829591
 
Descriptive research
Descriptive researchDescriptive research
Descriptive researchArifa T N
 
Presentation of Data
Presentation of DataPresentation of Data
Presentation of DataUmair Anwar
 
Presentation of Data and Frequency Distribution
Presentation of Data and Frequency DistributionPresentation of Data and Frequency Distribution
Presentation of Data and Frequency DistributionElain Cruz
 
Statistics for Data Analytics
Statistics for Data AnalyticsStatistics for Data Analytics
Statistics for Data AnalyticsSSaudia
 
Methods of Data Collection, Sampling Techniques and Methods in Presenting Data
Methods of Data Collection, Sampling Techniques and Methods in Presenting DataMethods of Data Collection, Sampling Techniques and Methods in Presenting Data
Methods of Data Collection, Sampling Techniques and Methods in Presenting DataRG Luis Vincent Gonzaga
 
Introduction to statistics
Introduction to statisticsIntroduction to statistics
Introduction to statisticsKapil Dev Ghante
 
Meaning and characteristics of research
Meaning and characteristics of researchMeaning and characteristics of research
Meaning and characteristics of researchjedliam
 
Basic Statistical Concepts and Methods
Basic Statistical Concepts and MethodsBasic Statistical Concepts and Methods
Basic Statistical Concepts and MethodsAhmed-Refat Refat
 
Lesson 3 basic terms in statistics
Lesson 3 basic terms in statisticsLesson 3 basic terms in statistics
Lesson 3 basic terms in statisticsMaris Ganace
 

What's hot (20)

Source of Data in Research
Source of Data in ResearchSource of Data in Research
Source of Data in Research
 
Statistics
StatisticsStatistics
Statistics
 
Basic Statistics
Basic  StatisticsBasic  Statistics
Basic Statistics
 
Population vs sample
Population vs samplePopulation vs sample
Population vs sample
 
Descriptive research
Descriptive researchDescriptive research
Descriptive research
 
Presentation of Data
Presentation of DataPresentation of Data
Presentation of Data
 
Presentation of Data and Frequency Distribution
Presentation of Data and Frequency DistributionPresentation of Data and Frequency Distribution
Presentation of Data and Frequency Distribution
 
Methods of sampling
Methods of sampling Methods of sampling
Methods of sampling
 
Results and discussion
Results and discussionResults and discussion
Results and discussion
 
Chapter 9-METHODS OF DATA COLLECTION
Chapter 9-METHODS OF DATA COLLECTIONChapter 9-METHODS OF DATA COLLECTION
Chapter 9-METHODS OF DATA COLLECTION
 
Ppt data collection
Ppt data collectionPpt data collection
Ppt data collection
 
SAMPLING.pptx
SAMPLING.pptxSAMPLING.pptx
SAMPLING.pptx
 
Statistics for Data Analytics
Statistics for Data AnalyticsStatistics for Data Analytics
Statistics for Data Analytics
 
Methods of Data Collection, Sampling Techniques and Methods in Presenting Data
Methods of Data Collection, Sampling Techniques and Methods in Presenting DataMethods of Data Collection, Sampling Techniques and Methods in Presenting Data
Methods of Data Collection, Sampling Techniques and Methods in Presenting Data
 
Introduction to statistics
Introduction to statisticsIntroduction to statistics
Introduction to statistics
 
Meaning and characteristics of research
Meaning and characteristics of researchMeaning and characteristics of research
Meaning and characteristics of research
 
Basic Statistical Concepts and Methods
Basic Statistical Concepts and MethodsBasic Statistical Concepts and Methods
Basic Statistical Concepts and Methods
 
Cluster sampling
Cluster samplingCluster sampling
Cluster sampling
 
Seminar sampling methods
Seminar sampling methodsSeminar sampling methods
Seminar sampling methods
 
Lesson 3 basic terms in statistics
Lesson 3 basic terms in statisticsLesson 3 basic terms in statistics
Lesson 3 basic terms in statistics
 

Viewers also liked

Day 9 hypothesis and correlation for students
Day 9 hypothesis and correlation for studentsDay 9 hypothesis and correlation for students
Day 9 hypothesis and correlation for studentsElih Sutisna Yanto
 
T-Test for Correlated Groups by STR Grp. 2
T-Test for Correlated Groups by STR Grp. 2T-Test for Correlated Groups by STR Grp. 2
T-Test for Correlated Groups by STR Grp. 2Oj Acopiado
 
Independent sample t test
Independent sample t testIndependent sample t test
Independent sample t testShajar Khan
 
Z test
Z testZ test
Z testkagil
 
Day 11 t test for independent samples
Day 11 t test for independent samplesDay 11 t test for independent samples
Day 11 t test for independent samplesElih Sutisna Yanto
 
One Sample T Test
One Sample T TestOne Sample T Test
One Sample T Testshoffma5
 
A Curriculum Model to Underpin Education for Sustainable Development
A  Curriculum Model to Underpin Education for Sustainable DevelopmentA  Curriculum Model to Underpin Education for Sustainable Development
A Curriculum Model to Underpin Education for Sustainable DevelopmentESCalate
 
Day 10 prediction and regression
Day 10 prediction and regressionDay 10 prediction and regression
Day 10 prediction and regressionElih Sutisna Yanto
 
What is a paired samples t test
What is a paired samples t testWhat is a paired samples t test
What is a paired samples t testKen Plummer
 
Information Literacy And Digital Literacy: Life Long Learning Initiatives
Information Literacy And Digital Literacy: Life Long Learning InitiativesInformation Literacy And Digital Literacy: Life Long Learning Initiatives
Information Literacy And Digital Literacy: Life Long Learning InitiativesFe Angela Verzosa
 
ESP COURSE DESIGN FOR GOVERNMENT TEACHERS
ESP COURSE DESIGN FOR GOVERNMENT TEACHERS ESP COURSE DESIGN FOR GOVERNMENT TEACHERS
ESP COURSE DESIGN FOR GOVERNMENT TEACHERS Hameel Khan
 
The nature of language slideshare.net
The nature of language slideshare.netThe nature of language slideshare.net
The nature of language slideshare.netElih Sutisna Yanto
 
Definitions of Personal Learning Environment (PLE)
Definitions of Personal Learning Environment (PLE)Definitions of Personal Learning Environment (PLE)
Definitions of Personal Learning Environment (PLE)Ilona Buchem
 
Neuroscience Presentation TESOL 2015
Neuroscience Presentation TESOL 2015Neuroscience Presentation TESOL 2015
Neuroscience Presentation TESOL 2015Carol Lethaby
 
content analysis
content analysiscontent analysis
content analysisEssam Obaid
 
Dependent T Test
Dependent T TestDependent T Test
Dependent T Testshoffma5
 

Viewers also liked (20)

Day 9 hypothesis and correlation for students
Day 9 hypothesis and correlation for studentsDay 9 hypothesis and correlation for students
Day 9 hypothesis and correlation for students
 
T-Test for Correlated Groups by STR Grp. 2
T-Test for Correlated Groups by STR Grp. 2T-Test for Correlated Groups by STR Grp. 2
T-Test for Correlated Groups by STR Grp. 2
 
Independent sample t test
Independent sample t testIndependent sample t test
Independent sample t test
 
Z test
Z testZ test
Z test
 
Action Research Project
Action Research ProjectAction Research Project
Action Research Project
 
Z test, f-test,etc
Z test, f-test,etcZ test, f-test,etc
Z test, f-test,etc
 
Day 11 t test for independent samples
Day 11 t test for independent samplesDay 11 t test for independent samples
Day 11 t test for independent samples
 
One Sample T Test
One Sample T TestOne Sample T Test
One Sample T Test
 
A Curriculum Model to Underpin Education for Sustainable Development
A  Curriculum Model to Underpin Education for Sustainable DevelopmentA  Curriculum Model to Underpin Education for Sustainable Development
A Curriculum Model to Underpin Education for Sustainable Development
 
Two sample t-test
Two sample t-testTwo sample t-test
Two sample t-test
 
Day 10 prediction and regression
Day 10 prediction and regressionDay 10 prediction and regression
Day 10 prediction and regression
 
What is a paired samples t test
What is a paired samples t testWhat is a paired samples t test
What is a paired samples t test
 
Information Literacy And Digital Literacy: Life Long Learning Initiatives
Information Literacy And Digital Literacy: Life Long Learning InitiativesInformation Literacy And Digital Literacy: Life Long Learning Initiatives
Information Literacy And Digital Literacy: Life Long Learning Initiatives
 
ESP COURSE DESIGN FOR GOVERNMENT TEACHERS
ESP COURSE DESIGN FOR GOVERNMENT TEACHERS ESP COURSE DESIGN FOR GOVERNMENT TEACHERS
ESP COURSE DESIGN FOR GOVERNMENT TEACHERS
 
The nature of language slideshare.net
The nature of language slideshare.netThe nature of language slideshare.net
The nature of language slideshare.net
 
Definitions of Personal Learning Environment (PLE)
Definitions of Personal Learning Environment (PLE)Definitions of Personal Learning Environment (PLE)
Definitions of Personal Learning Environment (PLE)
 
Neuroscience Presentation TESOL 2015
Neuroscience Presentation TESOL 2015Neuroscience Presentation TESOL 2015
Neuroscience Presentation TESOL 2015
 
content analysis
content analysiscontent analysis
content analysis
 
z-test
z-testz-test
z-test
 
Dependent T Test
Dependent T TestDependent T Test
Dependent T Test
 

Similar to Day 12 t test for dependent samples and single samples pdf

Introduction to Analysis of Variance
Introduction to Analysis of VarianceIntroduction to Analysis of Variance
Introduction to Analysis of Variancejasondroesch
 
Inferential Statistics.pptx
Inferential Statistics.pptxInferential Statistics.pptx
Inferential Statistics.pptxjonatanjohn1
 
tests of significance
tests of significancetests of significance
tests of significancebenita regi
 
jhghgjhgjhgjhfhcgjfjhvjhjgjkggjhgjhgjhfjgjgfgfhgfhg
jhghgjhgjhgjhfhcgjfjhvjhjgjkggjhgjhgjhfjgjgfgfhgfhgjhghgjhgjhgjhfhcgjfjhvjhjgjkggjhgjhgjhfjgjgfgfhgfhg
jhghgjhgjhgjhfhcgjfjhvjhjgjkggjhgjhgjhfjgjgfgfhgfhgUMAIRASHFAQ20
 
Analyzing experimental research data
Analyzing experimental research dataAnalyzing experimental research data
Analyzing experimental research dataAtula Ahuja
 
T test^jsample size^j ethics
T test^jsample size^j ethicsT test^jsample size^j ethics
T test^jsample size^j ethicsAbhishek Thakur
 
Navigating the Numbers A Deep Dive into t-tests & ANOVA.pptx
Navigating the Numbers A Deep Dive into t-tests & ANOVA.pptxNavigating the Numbers A Deep Dive into t-tests & ANOVA.pptx
Navigating the Numbers A Deep Dive into t-tests & ANOVA.pptxahmedMETWALLI12
 
Analyzing experimental research data
Analyzing experimental research dataAnalyzing experimental research data
Analyzing experimental research dataAtula Ahuja
 
linearity concept of significance, standard deviation, chi square test, stude...
linearity concept of significance, standard deviation, chi square test, stude...linearity concept of significance, standard deviation, chi square test, stude...
linearity concept of significance, standard deviation, chi square test, stude...KavyasriPuttamreddy
 
Basic of Statistical Inference Part-V: Types of Hypothesis Test (Parametric)
Basic of Statistical Inference Part-V: Types of Hypothesis Test (Parametric) Basic of Statistical Inference Part-V: Types of Hypothesis Test (Parametric)
Basic of Statistical Inference Part-V: Types of Hypothesis Test (Parametric) Dexlab Analytics
 
non parametric test.pptx
non parametric test.pptxnon parametric test.pptx
non parametric test.pptxSoujanyaLk1
 

Similar to Day 12 t test for dependent samples and single samples pdf (20)

Introduction to Analysis of Variance
Introduction to Analysis of VarianceIntroduction to Analysis of Variance
Introduction to Analysis of Variance
 
Inferential Statistics.pptx
Inferential Statistics.pptxInferential Statistics.pptx
Inferential Statistics.pptx
 
tests of significance
tests of significancetests of significance
tests of significance
 
jhghgjhgjhgjhfhcgjfjhvjhjgjkggjhgjhgjhfjgjgfgfhgfhg
jhghgjhgjhgjhfhcgjfjhvjhjgjkggjhgjhgjhfjgjgfgfhgfhgjhghgjhgjhgjhfhcgjfjhvjhjgjkggjhgjhgjhfjgjgfgfhgfhg
jhghgjhgjhgjhfhcgjfjhvjhjgjkggjhgjhgjhfjgjgfgfhgfhg
 
Hm306 week 4
Hm306 week 4Hm306 week 4
Hm306 week 4
 
Hm306 week 4
Hm306 week 4Hm306 week 4
Hm306 week 4
 
Analyzing experimental research data
Analyzing experimental research dataAnalyzing experimental research data
Analyzing experimental research data
 
Non parametric-tests
Non parametric-testsNon parametric-tests
Non parametric-tests
 
T test
T test T test
T test
 
Aron chpt 8 ed
Aron chpt 8 edAron chpt 8 ed
Aron chpt 8 ed
 
Aron chpt 8 ed
Aron chpt 8 edAron chpt 8 ed
Aron chpt 8 ed
 
T test^jsample size^j ethics
T test^jsample size^j ethicsT test^jsample size^j ethics
T test^jsample size^j ethics
 
Student t test
Student t testStudent t test
Student t test
 
Navigating the Numbers A Deep Dive into t-tests & ANOVA.pptx
Navigating the Numbers A Deep Dive into t-tests & ANOVA.pptxNavigating the Numbers A Deep Dive into t-tests & ANOVA.pptx
Navigating the Numbers A Deep Dive into t-tests & ANOVA.pptx
 
Analyzing experimental research data
Analyzing experimental research dataAnalyzing experimental research data
Analyzing experimental research data
 
linearity concept of significance, standard deviation, chi square test, stude...
linearity concept of significance, standard deviation, chi square test, stude...linearity concept of significance, standard deviation, chi square test, stude...
linearity concept of significance, standard deviation, chi square test, stude...
 
Basic of Statistical Inference Part-V: Types of Hypothesis Test (Parametric)
Basic of Statistical Inference Part-V: Types of Hypothesis Test (Parametric) Basic of Statistical Inference Part-V: Types of Hypothesis Test (Parametric)
Basic of Statistical Inference Part-V: Types of Hypothesis Test (Parametric)
 
Hypothesis Testing.pptx
Hypothesis Testing.pptxHypothesis Testing.pptx
Hypothesis Testing.pptx
 
Research Procedure
Research ProcedureResearch Procedure
Research Procedure
 
non parametric test.pptx
non parametric test.pptxnon parametric test.pptx
non parametric test.pptx
 

More from Elih Sutisna Yanto

ThDay 5 variables and measurement scales
ThDay 5 variables and measurement scalesThDay 5 variables and measurement scales
ThDay 5 variables and measurement scalesElih Sutisna Yanto
 
Day 4 normal curve and standard scores
Day 4 normal curve and standard scoresDay 4 normal curve and standard scores
Day 4 normal curve and standard scoresElih Sutisna Yanto
 
Introduction to research statistics
Introduction to research statisticsIntroduction to research statistics
Introduction to research statisticsElih Sutisna Yanto
 
A survey of the dictionary use at a private university
A survey of the dictionary use at a private universityA survey of the dictionary use at a private university
A survey of the dictionary use at a private universityElih Sutisna Yanto
 
Day 9 teaching integrated skills
Day 9 teaching integrated skillsDay 9 teaching integrated skills
Day 9 teaching integrated skillsElih Sutisna Yanto
 
Communicative Language Teaching : A new Perspective
Communicative Language Teaching :  A new PerspectiveCommunicative Language Teaching :  A new Perspective
Communicative Language Teaching : A new PerspectiveElih Sutisna Yanto
 
Second language acquisition in the classroom
Second language acquisition in the classroomSecond language acquisition in the classroom
Second language acquisition in the classroomElih Sutisna Yanto
 
Approach, method and technique in English teaching 2014
Approach, method and technique in English teaching 2014Approach, method and technique in English teaching 2014
Approach, method and technique in English teaching 2014Elih Sutisna Yanto
 
Approach, method and Technique in Language Learning and teaching
Approach, method and Technique in Language Learning and teachingApproach, method and Technique in Language Learning and teaching
Approach, method and Technique in Language Learning and teachingElih Sutisna Yanto
 

More from Elih Sutisna Yanto (13)

ThDay 5 variables and measurement scales
ThDay 5 variables and measurement scalesThDay 5 variables and measurement scales
ThDay 5 variables and measurement scales
 
Day 4 normal curve and standard scores
Day 4 normal curve and standard scoresDay 4 normal curve and standard scores
Day 4 normal curve and standard scores
 
Day 3 descriptive statistics
Day 3  descriptive statisticsDay 3  descriptive statistics
Day 3 descriptive statistics
 
Introduction to research statistics
Introduction to research statisticsIntroduction to research statistics
Introduction to research statistics
 
A survey of the dictionary use at a private university
A survey of the dictionary use at a private universityA survey of the dictionary use at a private university
A survey of the dictionary use at a private university
 
Day 9 teaching integrated skills
Day 9 teaching integrated skillsDay 9 teaching integrated skills
Day 9 teaching integrated skills
 
Day 8 teaching listening
Day 8 teaching listeningDay 8 teaching listening
Day 8 teaching listening
 
Day 7 total physical response
Day 7 total physical responseDay 7 total physical response
Day 7 total physical response
 
Communicative Language Teaching : A new Perspective
Communicative Language Teaching :  A new PerspectiveCommunicative Language Teaching :  A new Perspective
Communicative Language Teaching : A new Perspective
 
Day 5 methodology tefl
Day 5 methodology teflDay 5 methodology tefl
Day 5 methodology tefl
 
Second language acquisition in the classroom
Second language acquisition in the classroomSecond language acquisition in the classroom
Second language acquisition in the classroom
 
Approach, method and technique in English teaching 2014
Approach, method and technique in English teaching 2014Approach, method and technique in English teaching 2014
Approach, method and technique in English teaching 2014
 
Approach, method and Technique in Language Learning and teaching
Approach, method and Technique in Language Learning and teachingApproach, method and Technique in Language Learning and teaching
Approach, method and Technique in Language Learning and teaching
 

Recently uploaded

plant breeding methods in asexually or clonally propagated crops
plant breeding methods in asexually or clonally propagated cropsplant breeding methods in asexually or clonally propagated crops
plant breeding methods in asexually or clonally propagated cropsparmarsneha2
 
aaaaaaaaaaaaaaaaaaaaaaaaaaaaaaaaaaaaaaaaaaaaaaaaaaaaaaa
aaaaaaaaaaaaaaaaaaaaaaaaaaaaaaaaaaaaaaaaaaaaaaaaaaaaaaaaaaaaaaaaaaaaaaaaaaaaaaaaaaaaaaaaaaaaaaaaaaaaaaaaaaaaaa
aaaaaaaaaaaaaaaaaaaaaaaaaaaaaaaaaaaaaaaaaaaaaaaaaaaaaaasiemaillard
 
50 ĐỀ LUYỆN THI IOE LỚP 9 - NĂM HỌC 2022-2023 (CÓ LINK HÌNH, FILE AUDIO VÀ ĐÁ...
50 ĐỀ LUYỆN THI IOE LỚP 9 - NĂM HỌC 2022-2023 (CÓ LINK HÌNH, FILE AUDIO VÀ ĐÁ...50 ĐỀ LUYỆN THI IOE LỚP 9 - NĂM HỌC 2022-2023 (CÓ LINK HÌNH, FILE AUDIO VÀ ĐÁ...
50 ĐỀ LUYỆN THI IOE LỚP 9 - NĂM HỌC 2022-2023 (CÓ LINK HÌNH, FILE AUDIO VÀ ĐÁ...Nguyen Thanh Tu Collection
 
Jose-Rizal-and-Philippine-Nationalism-National-Symbol-2.pptx
Jose-Rizal-and-Philippine-Nationalism-National-Symbol-2.pptxJose-Rizal-and-Philippine-Nationalism-National-Symbol-2.pptx
Jose-Rizal-and-Philippine-Nationalism-National-Symbol-2.pptxricssacare
 
Home assignment II on Spectroscopy 2024 Answers.pdf
Home assignment II on Spectroscopy 2024 Answers.pdfHome assignment II on Spectroscopy 2024 Answers.pdf
Home assignment II on Spectroscopy 2024 Answers.pdfTamralipta Mahavidyalaya
 
Benefits and Challenges of Using Open Educational Resources
Benefits and Challenges of Using Open Educational ResourcesBenefits and Challenges of Using Open Educational Resources
Benefits and Challenges of Using Open Educational Resourcesdimpy50
 
INU_CAPSTONEDESIGN_비밀번호486_업로드용 발표자료.pdf
INU_CAPSTONEDESIGN_비밀번호486_업로드용 발표자료.pdfINU_CAPSTONEDESIGN_비밀번호486_업로드용 발표자료.pdf
INU_CAPSTONEDESIGN_비밀번호486_업로드용 발표자료.pdfbu07226
 
MARUTI SUZUKI- A Successful Joint Venture in India.pptx
MARUTI SUZUKI- A Successful Joint Venture in India.pptxMARUTI SUZUKI- A Successful Joint Venture in India.pptx
MARUTI SUZUKI- A Successful Joint Venture in India.pptxbennyroshan06
 
How to Split Bills in the Odoo 17 POS Module
How to Split Bills in the Odoo 17 POS ModuleHow to Split Bills in the Odoo 17 POS Module
How to Split Bills in the Odoo 17 POS ModuleCeline George
 
1.4 modern child centered education - mahatma gandhi-2.pptx
1.4 modern child centered education - mahatma gandhi-2.pptx1.4 modern child centered education - mahatma gandhi-2.pptx
1.4 modern child centered education - mahatma gandhi-2.pptxJosvitaDsouza2
 
Industrial Training Report- AKTU Industrial Training Report
Industrial Training Report- AKTU Industrial Training ReportIndustrial Training Report- AKTU Industrial Training Report
Industrial Training Report- AKTU Industrial Training ReportAvinash Rai
 
The Challenger.pdf DNHS Official Publication
The Challenger.pdf DNHS Official PublicationThe Challenger.pdf DNHS Official Publication
The Challenger.pdf DNHS Official PublicationDelapenabediema
 
678020731-Sumas-y-Restas-Para-Colorear.pdf
678020731-Sumas-y-Restas-Para-Colorear.pdf678020731-Sumas-y-Restas-Para-Colorear.pdf
678020731-Sumas-y-Restas-Para-Colorear.pdfCarlosHernanMontoyab2
 
Supporting (UKRI) OA monographs at Salford.pptx
Supporting (UKRI) OA monographs at Salford.pptxSupporting (UKRI) OA monographs at Salford.pptx
Supporting (UKRI) OA monographs at Salford.pptxJisc
 
Students, digital devices and success - Andreas Schleicher - 27 May 2024..pptx
Students, digital devices and success - Andreas Schleicher - 27 May 2024..pptxStudents, digital devices and success - Andreas Schleicher - 27 May 2024..pptx
Students, digital devices and success - Andreas Schleicher - 27 May 2024..pptxEduSkills OECD
 
Sha'Carri Richardson Presentation 202345
Sha'Carri Richardson Presentation 202345Sha'Carri Richardson Presentation 202345
Sha'Carri Richardson Presentation 202345beazzy04
 
Basic_QTL_Marker-assisted_Selection_Sourabh.ppt
Basic_QTL_Marker-assisted_Selection_Sourabh.pptBasic_QTL_Marker-assisted_Selection_Sourabh.ppt
Basic_QTL_Marker-assisted_Selection_Sourabh.pptSourabh Kumar
 
GIÁO ÁN DẠY THÊM (KẾ HOẠCH BÀI BUỔI 2) - TIẾNG ANH 8 GLOBAL SUCCESS (2 CỘT) N...
GIÁO ÁN DẠY THÊM (KẾ HOẠCH BÀI BUỔI 2) - TIẾNG ANH 8 GLOBAL SUCCESS (2 CỘT) N...GIÁO ÁN DẠY THÊM (KẾ HOẠCH BÀI BUỔI 2) - TIẾNG ANH 8 GLOBAL SUCCESS (2 CỘT) N...
GIÁO ÁN DẠY THÊM (KẾ HOẠCH BÀI BUỔI 2) - TIẾNG ANH 8 GLOBAL SUCCESS (2 CỘT) N...Nguyen Thanh Tu Collection
 
Accounting and finance exit exam 2016 E.C.pdf
Accounting and finance exit exam 2016 E.C.pdfAccounting and finance exit exam 2016 E.C.pdf
Accounting and finance exit exam 2016 E.C.pdfYibeltalNibretu
 

Recently uploaded (20)

plant breeding methods in asexually or clonally propagated crops
plant breeding methods in asexually or clonally propagated cropsplant breeding methods in asexually or clonally propagated crops
plant breeding methods in asexually or clonally propagated crops
 
aaaaaaaaaaaaaaaaaaaaaaaaaaaaaaaaaaaaaaaaaaaaaaaaaaaaaaa
aaaaaaaaaaaaaaaaaaaaaaaaaaaaaaaaaaaaaaaaaaaaaaaaaaaaaaaaaaaaaaaaaaaaaaaaaaaaaaaaaaaaaaaaaaaaaaaaaaaaaaaaaaaaaa
aaaaaaaaaaaaaaaaaaaaaaaaaaaaaaaaaaaaaaaaaaaaaaaaaaaaaaa
 
Chapter 3 - Islamic Banking Products and Services.pptx
Chapter 3 - Islamic Banking Products and Services.pptxChapter 3 - Islamic Banking Products and Services.pptx
Chapter 3 - Islamic Banking Products and Services.pptx
 
50 ĐỀ LUYỆN THI IOE LỚP 9 - NĂM HỌC 2022-2023 (CÓ LINK HÌNH, FILE AUDIO VÀ ĐÁ...
50 ĐỀ LUYỆN THI IOE LỚP 9 - NĂM HỌC 2022-2023 (CÓ LINK HÌNH, FILE AUDIO VÀ ĐÁ...50 ĐỀ LUYỆN THI IOE LỚP 9 - NĂM HỌC 2022-2023 (CÓ LINK HÌNH, FILE AUDIO VÀ ĐÁ...
50 ĐỀ LUYỆN THI IOE LỚP 9 - NĂM HỌC 2022-2023 (CÓ LINK HÌNH, FILE AUDIO VÀ ĐÁ...
 
Jose-Rizal-and-Philippine-Nationalism-National-Symbol-2.pptx
Jose-Rizal-and-Philippine-Nationalism-National-Symbol-2.pptxJose-Rizal-and-Philippine-Nationalism-National-Symbol-2.pptx
Jose-Rizal-and-Philippine-Nationalism-National-Symbol-2.pptx
 
Home assignment II on Spectroscopy 2024 Answers.pdf
Home assignment II on Spectroscopy 2024 Answers.pdfHome assignment II on Spectroscopy 2024 Answers.pdf
Home assignment II on Spectroscopy 2024 Answers.pdf
 
Benefits and Challenges of Using Open Educational Resources
Benefits and Challenges of Using Open Educational ResourcesBenefits and Challenges of Using Open Educational Resources
Benefits and Challenges of Using Open Educational Resources
 
INU_CAPSTONEDESIGN_비밀번호486_업로드용 발표자료.pdf
INU_CAPSTONEDESIGN_비밀번호486_업로드용 발표자료.pdfINU_CAPSTONEDESIGN_비밀번호486_업로드용 발표자료.pdf
INU_CAPSTONEDESIGN_비밀번호486_업로드용 발표자료.pdf
 
MARUTI SUZUKI- A Successful Joint Venture in India.pptx
MARUTI SUZUKI- A Successful Joint Venture in India.pptxMARUTI SUZUKI- A Successful Joint Venture in India.pptx
MARUTI SUZUKI- A Successful Joint Venture in India.pptx
 
How to Split Bills in the Odoo 17 POS Module
How to Split Bills in the Odoo 17 POS ModuleHow to Split Bills in the Odoo 17 POS Module
How to Split Bills in the Odoo 17 POS Module
 
1.4 modern child centered education - mahatma gandhi-2.pptx
1.4 modern child centered education - mahatma gandhi-2.pptx1.4 modern child centered education - mahatma gandhi-2.pptx
1.4 modern child centered education - mahatma gandhi-2.pptx
 
Industrial Training Report- AKTU Industrial Training Report
Industrial Training Report- AKTU Industrial Training ReportIndustrial Training Report- AKTU Industrial Training Report
Industrial Training Report- AKTU Industrial Training Report
 
The Challenger.pdf DNHS Official Publication
The Challenger.pdf DNHS Official PublicationThe Challenger.pdf DNHS Official Publication
The Challenger.pdf DNHS Official Publication
 
678020731-Sumas-y-Restas-Para-Colorear.pdf
678020731-Sumas-y-Restas-Para-Colorear.pdf678020731-Sumas-y-Restas-Para-Colorear.pdf
678020731-Sumas-y-Restas-Para-Colorear.pdf
 
Supporting (UKRI) OA monographs at Salford.pptx
Supporting (UKRI) OA monographs at Salford.pptxSupporting (UKRI) OA monographs at Salford.pptx
Supporting (UKRI) OA monographs at Salford.pptx
 
Students, digital devices and success - Andreas Schleicher - 27 May 2024..pptx
Students, digital devices and success - Andreas Schleicher - 27 May 2024..pptxStudents, digital devices and success - Andreas Schleicher - 27 May 2024..pptx
Students, digital devices and success - Andreas Schleicher - 27 May 2024..pptx
 
Sha'Carri Richardson Presentation 202345
Sha'Carri Richardson Presentation 202345Sha'Carri Richardson Presentation 202345
Sha'Carri Richardson Presentation 202345
 
Basic_QTL_Marker-assisted_Selection_Sourabh.ppt
Basic_QTL_Marker-assisted_Selection_Sourabh.pptBasic_QTL_Marker-assisted_Selection_Sourabh.ppt
Basic_QTL_Marker-assisted_Selection_Sourabh.ppt
 
GIÁO ÁN DẠY THÊM (KẾ HOẠCH BÀI BUỔI 2) - TIẾNG ANH 8 GLOBAL SUCCESS (2 CỘT) N...
GIÁO ÁN DẠY THÊM (KẾ HOẠCH BÀI BUỔI 2) - TIẾNG ANH 8 GLOBAL SUCCESS (2 CỘT) N...GIÁO ÁN DẠY THÊM (KẾ HOẠCH BÀI BUỔI 2) - TIẾNG ANH 8 GLOBAL SUCCESS (2 CỘT) N...
GIÁO ÁN DẠY THÊM (KẾ HOẠCH BÀI BUỔI 2) - TIẾNG ANH 8 GLOBAL SUCCESS (2 CỘT) N...
 
Accounting and finance exit exam 2016 E.C.pdf
Accounting and finance exit exam 2016 E.C.pdfAccounting and finance exit exam 2016 E.C.pdf
Accounting and finance exit exam 2016 E.C.pdf
 

Day 12 t test for dependent samples and single samples pdf

  • 1. 12/31/2014 1 Wednesday, December 31, 20141 Compute by hand and interpret Dependent samples t test Single sample t test Use SPSS to compute the same tests and interpret the output
  • 2. 12/31/2014 2 The Slides discuss • Comparing two means to ascertain which mean is of greater statistical significance. • The statistical test used for this type of analysis is the t test, and the statistic that is computed is called a t value. • Three research situations in which the t test can be used to analyze the data and compare the means from a) Two paired samples (e.g., pretest and posttest scores); and b) a sample and a population (e.g., comparing a mean of a sample to the mean of the population). • Examples with numerical data to illustrate each of the three types of t tests. • After t value is computed, you have decided whether it is statistically significant and whether your research hypothesis was confirmed. STEPS IN THE PROCESS OF HYPOTHESIS TESTING 1. Formulating a research question for the study. 2. Stating a research hypothesis (i.e., an alternative hypothesis). The hypothesis should represent the researcher’s prediction about the outcome of the study and should be testable. Note that a null hypothesis for the study is always implied, but it is not formally stated in most cases. The null hypothesis predicts no difference between groups or means or no relationship between variables. 3. Designing a study to test the research hypothesis. The study’s methodology should include plans for selecting one or more samples from the population that in interest to researcher; selecting or designing instruments to gather the numerical data; carrying out the study’s procedure (and intervention in experimental studies); and determining the statistical test(s) to be used to analyze the data. 4. Conducting the study and collecting numerical data. 5. Analyzing the data and calculating the appropriate test statistics (e.g., Pearson correlation coefficient, t test value or chi square value). 6. Determining the appropriate p value. 7. Deciding whether to retain or reject the null hypothesis. A p value of 0.05 is the most commonly used benchmark to consider the results statistically significant. If the results are statistically significant, the researcher may also wish to calculate the effect size (EF) to determine the practical significance of the study’s results. 8. Making a decision whether to confirm the study’s alternative hypothesis (i.e., the research hypothesis ) and how probable it is that the results were obtained purely by chance. This decision is based on the decision made regarding the null hypothesis. 9. Summarizing the study’s conclusion, addressing the study’s research question.
  • 3. 12/31/2014 3 Assumptions of t-Test • The groups are independent of each other. • A person (or case) may appear in only one group. • When the two group are approximately the same size, there is no need for the homogeneity of variance. This assumption is called the assumption of the homogeneity of variance. • We compare the two variances to determine if there is a statistically significant difference between them. • To test for the assumption of the homogeneity of the variances, we divide the larger variance by the smaller variance and obtain a ratio, called the F value. • When the F value is statistically significant we cannot assume that the variance are equal. Assumptions of t-Test • A test for the equality of variance, such as the levene’s is used to test the significance of the F value. An F value that is not statistically significant (p>0.05) indicates that the assumption for the homogeneity of variance is not violated and, therefore, equal variances can be assumed , on the other hand, a significant F value (p< 0.05) indicates that the assumption for the homogeneity of variance was violated. The t test statistical results are adjusted for the unequal variance.
  • 4. 12/31/2014 4 Assumptions of t-Test • The independent variables are interval or ratio. • The population from which samples are drawn is normally distributed. • Samples are randomly selected. • The groups have equal variance (Homogeneity of variance). • The t-statistic is robust (it is reasonably reliable even if assumptions are not fully met). Therefore, even if the assumption of the homogeneity of variance is not fully met, the researcher can probably still use the test to analyze the data. A t-test is used to compare two means in three different situations T Test t-test for independent samples - The two groups whose means are being compared are independent of each other Ex: a comparison of experimental and control groups. T-test for paired samples (t-test for dependent, matched or correlation samples) The two means represent two sets of scores that are paired. Ex: a comparison of pretest and posttest scores obtained from one group of people t-test for a single sample The t-test is used when the mean of a sample is compared to the mean of a population
  • 5. 12/31/2014 5 Dependent Samples t-tests Dependent Samples t-test • A t test for paired samples (dependent sample t-test) is used when the two means being compared come from two sets of scores that are related to each other. • It is used, for example, in experimental research to measure the effect of an intervention (a treatment) by comparing the posttest to the pretest scores. • The most important requirement for conducting this t test is that the two sets of scores are paired: they belong to the same individuals. • Useful to control individual differences. Can result in more powerful test than independent samples t-test.
  • 6. 12/31/2014 6 Computing the paired-samples t-test • First find for each person the difference (D) between the two scores (e.g., between pretest and posttest) and sum up those difference (∑ D). Usually, the lower scores (e.g., pretest) are subtracted from the higher scores (e.g., posttest) so D values are always positive. • We also need to compute the sum of the squares of the difference (∑ D2). Finally the t value is computed using the formula: The example that follows demonstrates the computation of a paired- samples t test. To simplify the computations , we use scores of eight students only. Of course, in conducting real-life research, it is recommended that larger samples (thirty or more) be used.
  • 7. 12/31/2014 7 An example of a t Test for dependent samples or paired samples Research has documented the potential effect of students’ positive self-concept on their self-reflections, attitudes toward self, schoolwork, and general development. A special program is developed by school psychologists and primary grade teachers to enhance the self-concept of young-age children. The program is implemented in Sunny Bay School with four groups of first-and second-grade students. The intervention lasts six weeks and involves various activities in the class and at home. The instrument used to assess the effectiveness of the program is comprised of forty pictures, and scores can range from 0 to 40. The program coordinator conducts a series of workshops to train five graduate students to administer the instrument. All of the children in the program are tested before the start of the program and then again during the first week after the end of the program. A t test for paired samples is used to test the hypothesis that students’ self-concept would improve significantly on the posttest, compared with their pretest scores. The research hypothesis is: HA: Mean POSTTEST > Mean PRETEST Ho: Mean POSTTEST = Mean PRETEST Review 6 Steps for Significance Testing 1. Set alpha (p level). 2. State the Research question 3. Set up hypotheses, Null and Alternative. 4. Calculate the test statistic (sample value). 4. Find the critical value of the statistic. 5. State the decision rule. 6. State the conclusion.
  • 8. 12/31/2014 8 Pretest and Posttest Scores of Eight Students Pretest X1 Posttest X2 Posttes t – Pretest D (Posttest-Pretest)2 D2 30 31 +1 1 31 32 +1 1 34 35 +1 1 32 40 +8 64 32 32 0 0 30 31 +1 1 33 35 +2 4 34 37 +3 9 D= 17 D2 =81  The table shows the numerical data we used to compute the t value for the eight students selected at random from the program participants.  The table shows the pretest and posttest scores for each students, as well as the means on the pretest and posttest.  The third column in the table shows the difference between each pair of scores (D) and is created by subtracting the pretest from the posttest for each participant.  The gain scores are then squared and recorded in the fourth column (D2).  The scores in these last two columns are added up to create ∑D and ∑D2 respectively. These values are used in the computation of the t value: Dependent Samples t Example 1. Set alpha = .05 2. Null hypothesis: H0:  Posttest = Pretest. Alternative is HA:  Mean Posttest >  Pretest. 3. Calculate the test statistic:
  • 9. 12/31/2014 9 Dependent Samples t Example 4. Determine the critical value of t. Alpha =.05, one tailed test df = N(pairs)-1 =8-1=7 ; Critical value is 1.895 5. Decision rule: The obtained t value of 2.37 exceeds the critical values of 1.895 for one tailed test under p=0.05 6. Conclusion. We reject the null hypothesis that states that there is no difference between the pretest and the posttest scores. The chance that these results were obtained purely by chance is less than 5 percent. We confirm the research hypothesis that predicted that the posttest mean score would be significantly higher than the pretest mean score. Table A section from the Table of Critical Value for t Tests Level of significance (p value) for one-tailed test p values 0.10 0.05 0.025 0.01 0.005 Level of significance (p value) for two-tailed test p values 0.20 0.10 0.05 0.02 0.01 df=7 1.415 1.895 2.365 2.998 3.4991.895 0.05 df=7
  • 10. 12/31/2014 10 Interpretation According to this study, the self-concept enhancement program was effective in increasing the self-concept of the first-and second-grade students. Our data seem to indicate that the intervention to increase the self-concept of the primary grade students was effective. However, those conducting the research or those reading about it should still decide for themselves whether the intervention is worth while. The question to be asked is whether an increase of 2.13 (34.13-32.00) points (out of forty possible points on the scale) is worth the investment of time, money, and effort. Using SPSS for dependent t-test • Open SPSS • Open file “SPSS Examples” (same as before) • Go to: – “Analyze” then “Compare Means” – Choose “Paired samples t-test” – Choose the two IV conditions you are comparing. Put in “paired variables box.”
  • 11. 12/31/2014 11 Dependent t- SPSS output Paired Samples Statistics Mean N Std. Deviation Std. Error Mean Pair 1 Pretest 32.00 8 1.604 .567 Postest 34.13 8 3.227 1.141 Paired Samples Correlations N Correlation Sig. Pair 1 Pretest & Postest 8 .635 .091 Paired Samples Test Paired Differences 95% Confidence Interval of the Difference Mean Std. Deviation Std. Error Mean Lower Upper Pair 1 Pretest - Postest -2.125 2.532 .895 -4.242 -.008 Paired Samples Test t df Sig. (2- tailed) Pair 1 Pretest - Postest -2.374 7 .049 Task of t-test for dependent samples The data below shows the lengths ( in arbitrary units) of syllables containing a particular vowel in two different environments. Each of the ten subjects was asked to read two sentences, each containing the vowel in one environment, and a pair of lengths was thus obtained for each subject. The researcher predicts greater mean length in environment 2 than in environment 1.
  • 12. 12/31/2014 12 Subject no. Environment 1 Environment 2 1 22 26 2 18 22 3 26 27 4 17 15 5 19 24 6 23 27 7 15 17 8 16 20 9 19 17 10 25 30 Table of Lengths of a vowel in two environments Do 6 Steps for Significance Testing 1. Set alpha (p level). 2. State the Research question 3. Set up hypotheses, Null and Alternative. 4. Calculate the test statistic (sample value). 4. Find the critical value of the statistic. 5. State the decision rule. 6. State the conclusion.
  • 13. 12/31/2014 13 t-Tests for a Single Sample t-Test for a Single Sample • A t test for single sample is used when the mean of a sample is compared to the mean of a population. • Occasionally, a researcher is interested in comparing a single group (a sample) to a larger group (a population). • For example, a high school teacher of a freshmen- accelerated English class may want to confirm that the students in that class had obtained higher scores on an English placement test compared with their peers. • In order to carry out this kind of a study the researcher must know prior to the start of the study the mean value of the population. In this example, the mean score of the population is the overall mean of the scores of all freshmen on the English placement test.
  • 14. 12/31/2014 14 Computing t-Test for Single sample • The t value is computed using the formula: An example of a t Test for Single sample A kindergarten teacher in a school commented to her colleague that the students in her class this year seem to be less bright than those she had in the past. Her colleague disagrees with her, and to test whether the first-graders this year are really different from those in previous years, they conduct a test for a single sample. The scores used are from the Wechsler Preschool and Primary Scale of Intelligence Third Edition (WPPSI-III), which is given every year to all kindergarten students in the district. In this example, we consider the district to be the population to which we compare the mean of the current kindergarten class. Although the mean IQ score of the population at large is 100 (µ=100), this district’s mean IQ score is 110 (µ= 110), and this mean is used in the analysis. The research hypothesis is stated as a null hypothesis and predicts that there is no statistically significant difference in the mean IQ score of this year’s kindergarten students (the sample) and the mean IQ score of all kindergarten students in the district (the population) that were gathered and recorded over the last three years. Ho: Mean Class = Mean District
  • 15. 12/31/2014 15 Review 6 Steps for Significance Testing 1. Set alpha (p level). 2. State the Research question 3. Set up hypotheses, Null and Alternative. 4. Calculate the test statistic (sample value). 4. Find the critical value of the statistic. 5. State the decision rule. 6. State the conclusion. Table IQ scores of Ten Students Scores 115 118 135 113 105 98 107 120 112 99 ∑X= 1,122 ¯X=112.20 SD= 10.94 In order to test their hypothesis, the two teachers randomly select IQ scores of ten students from this year’s kindergarten class. These IQ scores are listed in the table followed by the computation of the t value.
  • 16. 12/31/2014 16 Dependent Samples t Example 1. Is there any differences between this year’s kindergarten class and the “typical kindergarten students in the district? 2. Null hypothesis: H0:  Class =  District : there is no significant difference between this year’s kindergarten class and the “typical” kindergarten students in the district. 3. Alternative is HA:  Class ≠  District. 4. Calculate the test statistic: Single Samples t Example 4. Determine the critical value of t. Alpha =.05, two tailed test df = N(pairs)-1 =10-1=9 ; Critical value is 1.895 5. Decision rule: The obtained t value of 0.64 does not exceeds the critical values of 2.262 for two tailed test under p=0.05 (because our hypothesis is non-directional) 6. Conclusion. We retain the null hypothesis that states that there is no significant difference between this year’s kindergarten class and the “typical” kindergarten students in the district.
  • 17. 12/31/2014 17 Table A section from the Table of Critical Value for df=9 Level of significance (p value) for one-tailed test p values 0.10 0.05 0.025 0.01 0.005 Level of significance (p value) for two-tailed test p values 0.20 0.10 0.05 0.02 0.01 df=9 1.383 1.833 2.262 2.821 3.2502.262 0.05 df=9 Interpretation The mean IQ score of this year’s kindergarten students (mean= 112.20) is actually slightly higher than the mean score of the district (mean=110). The research hypothesis that was stated in a null form (i.e., predicting no difference between two means) is confirmed.
  • 18. 12/31/2014 18 Using SPSS for dependent t-test • Open SPSS • Open file “SPSS Examples” (same as before) • Go to: – “Analyze” then “Compare Means” – Choose “Paired samples t-test” – Choose the two IV conditions you are comparing. Put in “paired variables box.” Single Sample- SPSS output One-Sample Statistics N Mean Std. Deviation Std. Error Mean IQ Scores 10 112.20 10.942 3.460 One-Sample Test Test Value = 0 95% Confidence Interval of the Difference t df Sig. (2- tailed) Mean Difference Lower Upper IQ Scores 32.425 9 .000 112.200 104.37 120.03
  • 19. 12/31/2014 19 Task of t-test for Single samples A report published by the Antaretic Academy of Neurolinguistics indicates the left-handed people may be better language learners than right-handed people. To test this hypothesis, you did the following experiments: In an ESL center, 250 students were randomly selected and then assigned to two groups (left-handed vs. right- handed). After equal amounts of instruction, you administered a battery of language tests to all students. The information you obtained was: If the mean on the test for the population of ESL students is 50 a. Test whether left-handed people are better than the population b. Test whether right-handed people are better than the population. Review 6 Steps for Significance Testing 1. Set alpha (p level). 2. State the Research question 3. Set up hypotheses, Null and Alternative. 4. Calculate the test statistic (sample value). 4. Find the critical value of the statistic. 5. State the decision rule. 6. State the conclusion.
  • 20. 12/31/2014 20 ReferencesMain Sources Coolidge, F. L.2000. Statistics: A gentle introduction. London: Sage. Kranzler, G & Moursund, J .1999. Statistics for the terrified. (2nd ed.). Upper Saddle River, NJ: Prentice Hall. Butler Christopher.1985. Statistics in Linguistics. Oxford: Basil Blackwell. Hatch Evelyn & Hossein Farhady.1982. Research design and Statistics for Applied Linguistics. Massachusetts: Newbury House Publishers, Inc. Ravid Ruth.2011. Practical Statistics for Educators, fourth Ed. New York: Rowman & Littlefield Publisher, Inc. Quirk Thomas. 2012. Excel 2010 for Educational and Psychological Statistics: A Guide to Solving Practical Problem. New York: Springer. Other relevant sources Agresi A, & B. Finlay.1986. Statistical methods for the social sciences. San Francisco, CA: Dellen Publishing Company. Bachman, L.F. 2004. Statistical Analysis for Language Assessment. New York: Cambridge University Press. Field, A. (2005). Discovering statistics using SPSS (2nd ed.). London: Sage. Moore, D. S. (2000). The basic practice of statistics (2nd ed.). New York: W. H. Freeman and Company. Wednesday, December 31, 2014 39