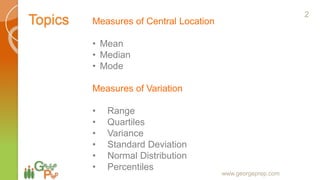
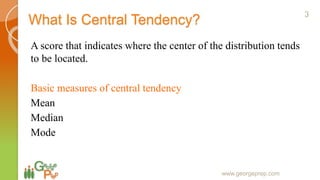
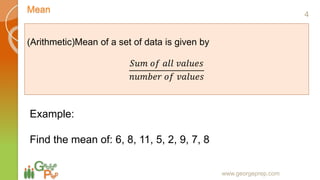
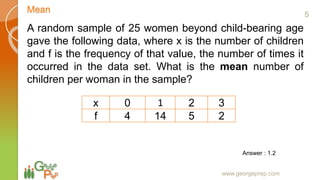
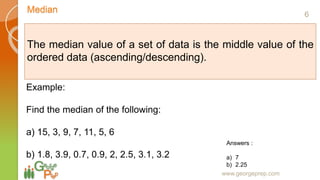
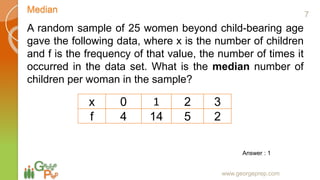
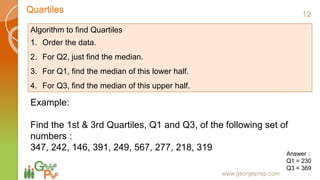
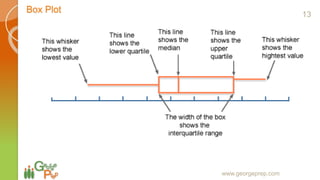
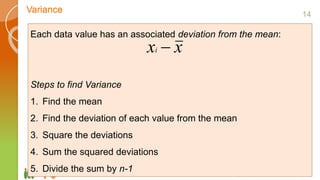
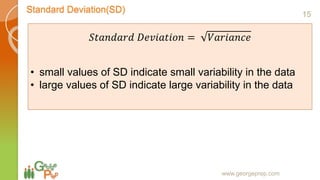
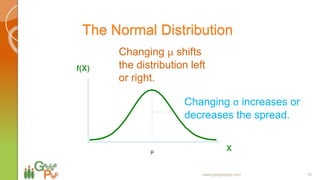
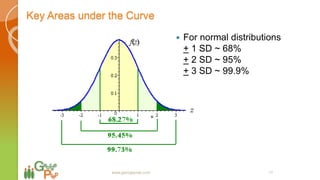
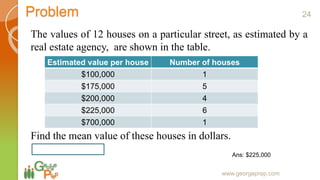
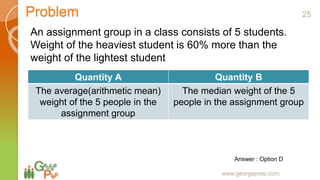
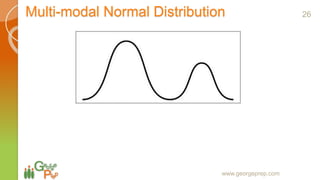
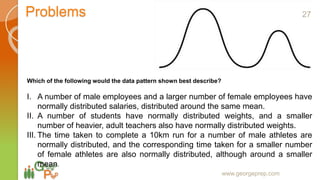
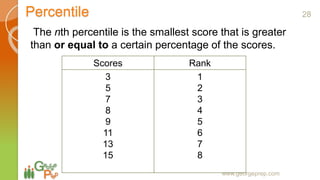
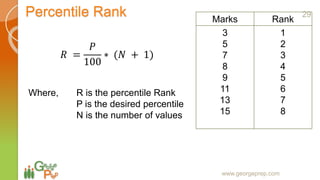
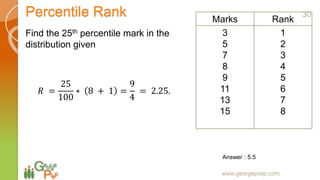
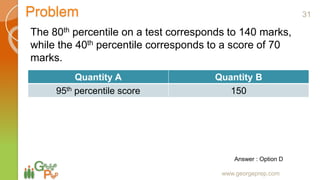
Concept Session: Statistics
www.georgeprep.com
1
Topics Measures of Central Location
• Mean
• Median
• Mode
Measures of Variation
• Range
• Quartiles
• Variance
• Standard Deviation
• Normal Distribution
• Percentiles
www.georgeprep.com
2
What Is Central Tendency?
A score that indicates where the center of the distribution tends
to be located.
Basic measures of central tendency
Mean
Median
Mode
www.georgeprep.com
3
Mean
www.georgeprep.com
(Arithmetic)Mean of a set of data is given by
𝑆𝑢𝑚 𝑜𝑓 𝑎𝑙𝑙 𝑣𝑎𝑙𝑢𝑒𝑠
𝑛𝑢𝑚𝑏𝑒𝑟 𝑜𝑓 𝑣𝑎𝑙𝑢𝑒𝑠
Example:
Find the mean of: 6, 8, 11, 5, 2, 9, 7, 8
4
Mean
www.georgeprep.com
A random sample of 25 women beyond child-bearing age
gave the following data, where x is the number of children
and f is the frequency of that value, the number of times it
occurred in the data set. What is the mean number of
children per woman in the sample?
x 0 1 2 3
f 4 14 5 2
Answer : 1.2
5
Median
www.georgeprep.com
The median value of a set of data is the middle value of the
ordered data (ascending/descending).
Example:
Find the median of the following:
a) 15, 3, 9, 7, 11, 5, 6
b) 1.8, 3.9, 0.7, 0.9, 2, 2.5, 3.1, 3.2
Answers :
a) 7
b) 2.25
6
Median
www.georgeprep.com
A random sample of 25 women beyond child-bearing age
gave the following data, where x is the number of children
and f is the frequency of that value, the number of times it
occurred in the data set. What is the median number of
children per woman in the sample?
x 0 1 2 3
f 4 14 5 2
Answer : 1
7
Mode
www.georgeprep.com
The modal value of a set of data is the most frequently occurring
value.
Example:
Find the mode for: 2, 6, 3, 9, 5, 6, 2, 6
8
Mode
www.georgeprep.com
A random sample of 25 women beyond child-bearing age
gave the following data, where x is the number of children
and f is the frequency of that value, the number of times it
occurred in the data set. What is the mode of the sample?
x 0 1 2 3
f 4 14 5 2
Answer : 1
9
Range
www.georgeprep.com
The range is strongly affected by outliers
Range = max  min
10
Quartiles
www.georgeprep.com
Three numbers which divide the ordered data into four
equal sized groups.
Q1 has 25% of the data below it.
Q2 has 50% of the data below it. (Median)
Q3 has 75% of the data below it.
11
Quartiles
www.georgeprep.com
Algorithm to find Quartiles
1. Order the data.
2. For Q2, just find the median.
3. For Q1, find the median of this lower half.
4. For Q3, find the median of this upper half.
Example:
Find the 1st & 3rd Quartiles, Q1 and Q3, of the following set of
numbers :
347, 242, 146, 391, 249, 567, 277, 218, 319
Answer :
Q1 = 230
Q3 = 369
12
Box Plot
www.georgeprep.com
13
Variance
www.georgeprep.com
Each data value has an associated deviation from the mean:
Steps to find Variance
1. Find the mean
2. Find the deviation of each value from the mean
3. Square the deviations
4. Sum the squared deviations
5. Divide the sum by n-1
xxi 
14
Standard Deviation(SD)
www.georgeprep.com
𝑆𝑡𝑎𝑛𝑑𝑎𝑟𝑑 𝐷𝑒𝑣𝑖𝑎𝑡𝑖𝑜𝑛 = 𝑉𝑎𝑟𝑖𝑎𝑛𝑐𝑒
• small values of SD indicate small variability in the data
• large values of SD indicate large variability in the data
15
The Normal Distribution
X
f(X)
Changing μ shifts
the distribution left
or right.
Changing σ increases or
decreases the spread.
µ
www.georgeprep.com 16
Key Areas under the Curve
 For normal distributions
+ 1 SD ~ 68%
+ 2 SD ~ 95%
+ 3 SD ~ 99.9%
www.georgeprep.com 17
Problem
Family income in a city is normally distributed with
mean $25000 and standard deviation of $10000. If the
poverty level is $15,000, what percentage of the
population lives in poverty?
www.georgeprep.com
18
Ans: 16
Problem
Joe buys 6 pens with an average(arithmetic mean) price
of $15. If Joe buys 2 more pens with an
average(arithmetic mean) price of $20, what is the
average price all the pens taken together ( in $, correct to
two decimal places)
www.georgeprep.com
Ans: $16.25
19
Problem
The average ( arithmetic mean) of 21 consecutive
integers is 25, what is the value of the smallest
integer among the 21 integers?
www.georgeprep.com
Ans: 15
20
Problem
Dataset A: -12, -10, -8, -6
Dataset B: -12, -11, -10, -9
Dataset C: 12, 12, 12, 12
Dataset D: -12, -24, -36, -48
Arrange the datasets above in ascending order of standard deviation.
A. C, B, A, D
B. C, A, B, D
C. B, C, A, D
D. A, B, C, D
E. C, D, B, A
www.georgeprep.com
Ans: A
21
Problem
Given below is the sample of ages (in months) of 18 children at
a day care:
36, 42, 18, 32, 22, 22, 25, 29, 30, 31, 19, 24, 35, 29, 26, 36, 24,
28
The interquartile range for this data set is
www.georgeprep.com
Ans : 8 ( 32-24)
22
Problem
Rank the following measures in order or “least affected by
outliers” to “most affected by outliers”.
A. mean, median, range
B. median, mean, range
C. range, median, mean
D. median, range, mean
E. range, mean, median
www.georgeprep.com
Ans: option B (median, mean, range)
23
Problem
The values of 12 houses on a particular street, as estimated by a
real estate agency, are shown in the table.
Find the mean value of these houses in dollars.
www.georgeprep.com
Ans: $225,000
Estimated value per house Number of houses
$100,000 1
$175,000 5
$200,000 4
$225,000 6
$700,000 1
24
Problem
Quantity A Quantity B
The average(arithmetic mean)
weight of the 5 people in the
assignment group
The median weight of the 5
people in the assignment group
www.georgeprep.com
An assignment group in a class consists of 5 students.
Weight of the heaviest student is 60% more than the
weight of the lightest student
Answer : Option D
25
Multi-modal Normal Distribution
www.georgeprep.com
26
Problems
www.georgeprep.com
Which of the following would the data pattern shown best describe?
I. A number of male employees and a larger number of female employees have
normally distributed salaries, distributed around the same mean.
II. A number of students have normally distributed weights, and a smaller
number of heavier, adult teachers also have normally distributed weights.
III. The time taken to complete a 10km run for a number of male athletes are
normally distributed, and the corresponding time taken for a smaller number
of female athletes are also normally distributed, although around a smaller
mean.
27
Percentile
www.georgeprep.com
The nth percentile is the smallest score that is greater
than or equal to a certain percentage of the scores.
Scores Rank
3
5
7
8
9
11
13
15
1
2
3
4
5
6
7
8
28
Percentile Rank
www.georgeprep.com
Marks Rank
3
5
7
8
9
11
13
15
1
2
3
4
5
6
7
8
𝑅 =
𝑃
100
∗ (𝑁 + 1)
Where, R is the percentile Rank
P is the desired percentile
N is the number of values
29
Percentile Rank
www.georgeprep.com
Marks Rank
3
5
7
8
9
11
13
15
1
2
3
4
5
6
7
8
Find the 25th percentile mark in the
distribution given
Answer : 5.5
𝑅 =
25
100
∗ 8 + 1 =
9
4
= 2.25.
30
Problem
Quantity A Quantity B
95th percentile score 150
www.georgeprep.com
The 80th percentile on a test corresponds to 140 marks,
while the 40th percentile corresponds to a score of 70
marks.
Answer : Option D
31

GRE - Statistics

  • 1.
  • 2.
    Topics Measures ofCentral Location • Mean • Median • Mode Measures of Variation • Range • Quartiles • Variance • Standard Deviation • Normal Distribution • Percentiles www.georgeprep.com 2
  • 3.
    What Is CentralTendency? A score that indicates where the center of the distribution tends to be located. Basic measures of central tendency Mean Median Mode www.georgeprep.com 3
  • 4.
    Mean www.georgeprep.com (Arithmetic)Mean of aset of data is given by 𝑆𝑢𝑚 𝑜𝑓 𝑎𝑙𝑙 𝑣𝑎𝑙𝑢𝑒𝑠 𝑛𝑢𝑚𝑏𝑒𝑟 𝑜𝑓 𝑣𝑎𝑙𝑢𝑒𝑠 Example: Find the mean of: 6, 8, 11, 5, 2, 9, 7, 8 4
  • 5.
    Mean www.georgeprep.com A random sampleof 25 women beyond child-bearing age gave the following data, where x is the number of children and f is the frequency of that value, the number of times it occurred in the data set. What is the mean number of children per woman in the sample? x 0 1 2 3 f 4 14 5 2 Answer : 1.2 5
  • 6.
    Median www.georgeprep.com The median valueof a set of data is the middle value of the ordered data (ascending/descending). Example: Find the median of the following: a) 15, 3, 9, 7, 11, 5, 6 b) 1.8, 3.9, 0.7, 0.9, 2, 2.5, 3.1, 3.2 Answers : a) 7 b) 2.25 6
  • 7.
    Median www.georgeprep.com A random sampleof 25 women beyond child-bearing age gave the following data, where x is the number of children and f is the frequency of that value, the number of times it occurred in the data set. What is the median number of children per woman in the sample? x 0 1 2 3 f 4 14 5 2 Answer : 1 7
  • 8.
    Mode www.georgeprep.com The modal valueof a set of data is the most frequently occurring value. Example: Find the mode for: 2, 6, 3, 9, 5, 6, 2, 6 8
  • 9.
    Mode www.georgeprep.com A random sampleof 25 women beyond child-bearing age gave the following data, where x is the number of children and f is the frequency of that value, the number of times it occurred in the data set. What is the mode of the sample? x 0 1 2 3 f 4 14 5 2 Answer : 1 9
  • 10.
    Range www.georgeprep.com The range isstrongly affected by outliers Range = max  min 10
  • 11.
    Quartiles www.georgeprep.com Three numbers whichdivide the ordered data into four equal sized groups. Q1 has 25% of the data below it. Q2 has 50% of the data below it. (Median) Q3 has 75% of the data below it. 11
  • 12.
    Quartiles www.georgeprep.com Algorithm to findQuartiles 1. Order the data. 2. For Q2, just find the median. 3. For Q1, find the median of this lower half. 4. For Q3, find the median of this upper half. Example: Find the 1st & 3rd Quartiles, Q1 and Q3, of the following set of numbers : 347, 242, 146, 391, 249, 567, 277, 218, 319 Answer : Q1 = 230 Q3 = 369 12
  • 13.
  • 14.
    Variance www.georgeprep.com Each data valuehas an associated deviation from the mean: Steps to find Variance 1. Find the mean 2. Find the deviation of each value from the mean 3. Square the deviations 4. Sum the squared deviations 5. Divide the sum by n-1 xxi  14
  • 15.
    Standard Deviation(SD) www.georgeprep.com 𝑆𝑡𝑎𝑛𝑑𝑎𝑟𝑑 𝐷𝑒𝑣𝑖𝑎𝑡𝑖𝑜𝑛= 𝑉𝑎𝑟𝑖𝑎𝑛𝑐𝑒 • small values of SD indicate small variability in the data • large values of SD indicate large variability in the data 15
  • 16.
    The Normal Distribution X f(X) Changingμ shifts the distribution left or right. Changing σ increases or decreases the spread. µ www.georgeprep.com 16
  • 17.
    Key Areas underthe Curve  For normal distributions + 1 SD ~ 68% + 2 SD ~ 95% + 3 SD ~ 99.9% www.georgeprep.com 17
  • 18.
    Problem Family income ina city is normally distributed with mean $25000 and standard deviation of $10000. If the poverty level is $15,000, what percentage of the population lives in poverty? www.georgeprep.com 18 Ans: 16
  • 19.
    Problem Joe buys 6pens with an average(arithmetic mean) price of $15. If Joe buys 2 more pens with an average(arithmetic mean) price of $20, what is the average price all the pens taken together ( in $, correct to two decimal places) www.georgeprep.com Ans: $16.25 19
  • 20.
    Problem The average (arithmetic mean) of 21 consecutive integers is 25, what is the value of the smallest integer among the 21 integers? www.georgeprep.com Ans: 15 20
  • 21.
    Problem Dataset A: -12,-10, -8, -6 Dataset B: -12, -11, -10, -9 Dataset C: 12, 12, 12, 12 Dataset D: -12, -24, -36, -48 Arrange the datasets above in ascending order of standard deviation. A. C, B, A, D B. C, A, B, D C. B, C, A, D D. A, B, C, D E. C, D, B, A www.georgeprep.com Ans: A 21
  • 22.
    Problem Given below isthe sample of ages (in months) of 18 children at a day care: 36, 42, 18, 32, 22, 22, 25, 29, 30, 31, 19, 24, 35, 29, 26, 36, 24, 28 The interquartile range for this data set is www.georgeprep.com Ans : 8 ( 32-24) 22
  • 23.
    Problem Rank the followingmeasures in order or “least affected by outliers” to “most affected by outliers”. A. mean, median, range B. median, mean, range C. range, median, mean D. median, range, mean E. range, mean, median www.georgeprep.com Ans: option B (median, mean, range) 23
  • 24.
    Problem The values of12 houses on a particular street, as estimated by a real estate agency, are shown in the table. Find the mean value of these houses in dollars. www.georgeprep.com Ans: $225,000 Estimated value per house Number of houses $100,000 1 $175,000 5 $200,000 4 $225,000 6 $700,000 1 24
  • 25.
    Problem Quantity A QuantityB The average(arithmetic mean) weight of the 5 people in the assignment group The median weight of the 5 people in the assignment group www.georgeprep.com An assignment group in a class consists of 5 students. Weight of the heaviest student is 60% more than the weight of the lightest student Answer : Option D 25
  • 26.
  • 27.
    Problems www.georgeprep.com Which of thefollowing would the data pattern shown best describe? I. A number of male employees and a larger number of female employees have normally distributed salaries, distributed around the same mean. II. A number of students have normally distributed weights, and a smaller number of heavier, adult teachers also have normally distributed weights. III. The time taken to complete a 10km run for a number of male athletes are normally distributed, and the corresponding time taken for a smaller number of female athletes are also normally distributed, although around a smaller mean. 27
  • 28.
    Percentile www.georgeprep.com The nth percentileis the smallest score that is greater than or equal to a certain percentage of the scores. Scores Rank 3 5 7 8 9 11 13 15 1 2 3 4 5 6 7 8 28
  • 29.
    Percentile Rank www.georgeprep.com Marks Rank 3 5 7 8 9 11 13 15 1 2 3 4 5 6 7 8 𝑅= 𝑃 100 ∗ (𝑁 + 1) Where, R is the percentile Rank P is the desired percentile N is the number of values 29
  • 30.
    Percentile Rank www.georgeprep.com Marks Rank 3 5 7 8 9 11 13 15 1 2 3 4 5 6 7 8 Findthe 25th percentile mark in the distribution given Answer : 5.5 𝑅 = 25 100 ∗ 8 + 1 = 9 4 = 2.25. 30
  • 31.
    Problem Quantity A QuantityB 95th percentile score 150 www.georgeprep.com The 80th percentile on a test corresponds to 140 marks, while the 40th percentile corresponds to a score of 70 marks. Answer : Option D 31