Presentation is about advance excel advance feature PIVOT Table and contains steps to insert pivot table and some useful features of pivot table in case of large amount of data
The pivot tables are not created mechanically. In Microsoft excel the user should select the data first for which the pivot table should be created. The pivot table option is available on the insert tab. The user has the option of inserting the pivot table either in the existing sheet or creating the pivot table in the new sheet. Copy the link given below and paste it in new browser window to get more information on Pivot Table:- http://www.transtutors.com/homework-help/statistics/pivot-table.aspx
Assignment 3.1 Determining Causes and Effects– Draft VersionThe.docxrock73
Assignment 3.1: Determining Causes and Effects– Draft Version
The following scenarios on which to focus your cause and effect paper. Research the topic and include credible sources to support claims. Identify your purpose clearly, incorporate audience needs, establish a desired tone, and organize information/claims effectively.
2. The director of your state unemployment agency has asked you (a public relations specialist) to write about the causes and effects of unemployment on an individual/family. The paper will be presented to the agency as they make decisions about reaching out to those who need jobs.
Write a four to five (4-5) page paper in which you:
1. Provide a clear thesis statement.
2. Describe the major cause.
3. Describe a leading second cause
4. Describe two (2) economic effects of the cause..
5. Describe two (2) effects on people.
6. Develop a coherently structured paper with an introduction, body, and conclusion.
7. Provide three (3) relevant and credible sources to support claims. Note: Wikipedia and other Websites do not qualify as academic resources.
Your assignment must follow these formatting requirements:
· Be typed, double spaced, using Times New Roman font (size 12), with one-inch margins on all sides; references must follow APA or school-specific format. Check with your professor for any additional instructions.
· Include a cover page containing the title of the assignment, the student’s name, the professor’s name, the course title, and the date. The cover page and the reference page are not included in the required page length.
The specific course learning outcomes associated with this assignment are:
· Associate the features of audience, purpose, and text with various genres.
· Recognize the elements and correct use of a thesis statement.
· Recognize how to organize ideas with transitional words, phrases, and sentences.
· Incorporate relevant, correctly documented sources to substantiate claims.
· Apply the writing process to develop various writing genres.
· Write clearly and concisely about selected topics using proper writing mechanics.
· Use technology and information resources to research selected issues for this course.
Using References in your Lab Writeup
Make sure you both cite the reference that you use in the body of your text, AND
provide a reference list at the end of your writeup.
For example, to cite references within the body of your lab writeup:
In this lab we examined how different fish like to eat different kinds of algae. The red
algae are the largest group of algae (Abbott, 1999). Therefore, we focused on red algae
in this lab. Many red algae are quite edible and some of the best known red algae
include those that are eaten in sushi (sushiworld.com). Algae are also quite nutritious
(Markeley, 2010). Our fish came from tidepools, which are located in the area between
high and low tide (Mahon and Mahon, 1994). According to our lab manual (WOU
Biology, 2011), our fish were col ...
8th grade ngsss math standards checklist formatTaleese
Fl teachers. You can take this chart to a Kinkos/FedEx and blow it up to poster size for about $5-$10 a sheet. Laminate it at your school, and post on wall using Velcro.
You can also provide each student with this a way to track their learning.
EGR1013M Coursework 1 - Excel 2017-18.pdfPage 1 of 4 S.docxSALU18
EGR1013M Coursework 1 - Excel 2017-18.pdf
Page 1 of 4
STUDENT
NAME:
TUTOR NAME: Alex Borman
PROGRAMME: BEng/MEng (All Pathways)
MODULE CODE:
EGR1013M
MODULE
TITLE:
COMPUTING FOR ENGINEERS
SUBJECT: COURSEWORK 1: MICROSOFT EXCEL
COURSEWORK
TITLE:
MICROSOFT EXCEL SKILLS COURSEWORK
COURSEWORK
WEIGHTING (%):
50%
Issue Date:
04/12/2017
Due Date:
14/01/2018
Feedback Date:
2 weeks after hand-in
PERFORMANCE CRITERIA:
TARGETED LEARNING OUTCOMES
LO1 Use engineering software to model simple systems, and interpret the results
LO2 Design and write structured programs in a high-level language
LO3 Locate and use learning resources in the development of coding solutions
LO4 Manage their time effectively and work independently
Important Information – Please Read Before Completing Your Work
All students should submit their work by the date specified using the procedures specified in the Student Handbook. An
assessment that has been handed in after this deadline will be marked initially as if it had been handed in on time, but
the Board of Examiners will normally apply a lateness penalty.
Your attention is drawn to the Section on Academic Misconduct in the Student’s Handbook.
All work will be considered as individual unless collaboration is specifically requested, in which case this should be
explicitly acknowledged by the student within their submitted material.
Any queries that you may have on the requirements of this assessment should be e-mailed to [email protected] No
queries will be answered after respective submission dates.
You must ensure you retain a copy of your completed work prior to submission.
Page 2 of 4
COURSEWORK BRIEF:
This coursework will assess your abilities with Microsoft Excel, testing a range of skills developed during the
course of the lectures and supplementary tutorial activity.
This piece of work, being taught simultaneously with Statics for all full time students, will focus on an aspect of this
module and using Excel to take in data, process it and produces solutions to the question posed. For any students
not taking the Statics module this year, your ability to solve the statics problem is not being assessed and help will
be given in this task if difficulties are faced with this aspect of the coursework.
The specific question that will be considered is a Structural Analysis problem, as displayed below.
The Truss used to support a balcony is subjected to the loading shown. Using the method of joints, determine the
force in each member, stating also whether members are in tension or compression.
Test Data Set (these values will be varied when marked):
P1 = 60kN; P2 = 40kN; X1=4m; X2=4m; Y1=4m
Test data results:
FAD = 84.9kN (C); FAB = 60.0kN (T); FBD = 40kN (C); FBC = 60kN (T); FDC = 141 kN (T); FDE = 160kN (C)
Your task is to produce a spreadsheet capable of collecting values for the five variables and outputting ...
Use tables and figures effectively to present detailed results and complex relationships, reduce the length of the manuscript, and enhance readers’ understanding of the study results.
For this Applied Knowledge Assessment, you will use the concepts.docxAKHIL969626
For this Applied Knowledge Assessment, you will use the concepts learned throughout this unit. You will develop your understanding of nets, perimeter, and area. Refer back to individual lessons if you need help.
Nets in the Kitchen
This assessment is worth 75 points. Show all work on this sheet and submit one document for full credit.
Part 1: Nets
Recall (refer to page 12 in your textbook if necessary) that a net is a two-dimensional pattern that you can fold to form a three-dimensional figure. You are to create nets for two different boxes from your house. Some good box examples include: cereal boxes, pasta boxes, cracker boxes, etc.
1. Rummage through your house and locate the two different boxes that you will use for this activity.
2. In the space provided below, describe what your original box looks like in a few sentences. You may also take pictures of your box and insert them into this document; however, this is not mandatory. When describing each three-dimensional figure, be sure to use complete sentences and proper grammar/spelling.
3. Create a net for each box. You may cut the box to help you unfold it into a two-dimensional piece.
4. Sketch your net in the space provided below. You must sketch your net by hand. The size of the net will not be drawn to scale. Draw each net to fit in the provided space. Use a ruler or other straight edge to make neat, straight lines.
Part 2: Perimeter and Area
Part 2 of this assessment will focus on perimeter and area. Choose one of your boxes from Part 1 to complete this activity. You will need a ruler. If you do not have one available, you may visit the following link to print and cut out a ruler:
http://www.vendian.org/mncharity/dir3/paper_rulers/UnstableURL/ruler_foot.pdf
1. Measure the top of your box. Draw a picture of the top of the box. Include your measurements and label the units. You may use inches or centimeters for the units. (Be sure to use the same units for the remainder of Part 2.)
2. What is the perimeter and area of the top of the box? Show all work and include the proper units.
3. Measure the front of your box. Draw a picture of the front of the box. Include your measurements and label the units.
4. What is the perimeter and area of the front of the box? Show all work and include the proper units.
5. Measure the bottom of the box. Draw a picture of the bottom of the box. Include your measurements and label the units.
6. What is the perimeter and area of the bottom of the box? Show all work and include the proper units.
7. Compare the areas of the pieces of the box. Which pieces have the same area? Why?
8. There are some pieces of the box that we did not measure. Use your knowledge of area and your findings from the previous questions to infer which pieces of the box will have the same area (you do not need to calculate the actual areas here). Be sure to list all parts of the box (top, bottom, front, back, side 1, and side 2).
Directions for Inserting an Image i ...
Week 2 Project - STAT 3001Student Name Type your name here.docxcockekeshia
Week 2 Project - STAT 3001
Student Name: <Type your name here>
Date: <Enter the date on which you began working on this assignment.>
Instructions: To complete this project, you will need the following materials:
· STATDISK User Manual (found in the classroom in DocSharing)
· Access to the Internet to download the STATDISK program.
This assignment is worth a total of 60 points.
Part I. Histograms and Frequency Tables
Instructions
Answers
1. Open the file Diamonds using menu option Datasets and then Elementary Stats, 9th Edition. This file contains some information about diamonds. What are the names of the variables in this file?
2. Create a histogram for the depth of the diamonds using the Auto-fit option. Paste the chart here. Once your histogram displays, click Turn on Labels to get the height of the bars.
3. Using the information in the above histogram, complete this table. Be sure to include frequency, relative frequency, and cumulative frequency.
Depth
Frequency
Relative Frequency
Cumulative Frequency
57-58.9
59-60.9
61-62.9
63-64.9
a. Using the frequency table above, how many of the diamonds have a depth of 60.9 or less? How do you know?
b. Using the frequency table above, how many of the diamonds have a depth between 59 and 62.9? Show your work.
c. What percent of the diamonds have a depth of 61 or more?
Part II. Comparing Datasets
Instructions
Answers
1. Create a boxplot that compares the color and clarity of the diamonds. Paste it here.
2. Describe the similarities and differences in the data sets. Please be specific to the graph created.
Part III. Finding Descriptive Numbers
Instructions
Answers
3. Open the file named Stowaway (using Datasets and then Elementary Stats, 9th Edition). This gives information on the number of stowaways going west vs east.List all the variables in the dataset.
4. Find the Mean, median, and midrange for the Data in Column 1.
5. Find the Range, variance, and standard deviation for the first column.
6. List any values for the first column that you think may be outliers. Why do you think that?
[Hint: You may want to sort the data and look at the smallest and largest values.]
7. Find the Mean, median, and midrange for the data in Column 2.
8. Find the Range, variance, and standard deviation for the data in Column 2.
9. List any values for the second column that you think may be outliers. Why do you think that?
10. Find the five-number summary for the stowaways data in Columns 1 and 2. You will need to label each of the columns with an appropriate measure in the top row for clarity.
11. Compare number of stowaways going west and east using a boxplot of Columns 1 and 2. Paste your boxplot here
12. Create a histogram for the
Column 1 data and paste it here.
13. Create a histogram for the
Column 2 data and paste it here.
Part IV. Interpreting Statistical Information
The Stowaway data contains two columns, both of which are mea.
Electronic Keno Project 3 Overview and Rationale.docxShiraPrater50
Electronic Keno
Project 3
Overview and Rationale
This assignment is designed to provide you with hands-on experience in using discrete and
continuous probability distributions. In this assignment you will use technology to
generate random samples and explore the samples’ relationship with the underlying
population. Finally, you will have an opportunity to apply the Central Limit Theorem to
inferential statistics.
Course Outcomes
This assignment is directly linked to the following key learning outcomes from the course
syllabus:
CO2: Create distributions and graphical representation based on given data and identify
which distribution models best fit the data
CO3: Apply the theory of probability to calculate events’ likelihoods, understanding the
differences between experimental and theoretical probabilities (the Law of Large
Numbers), and calculate posterior probabilities by using the Bayes’ Law with emphasis on
applications
CO7: Interpret meaningful relationships and patterns in the data in relation to a given
business question
Assignment Summary
Read the scenario below and follow the instructions in the project description below (Parts
1 and 2) to analyze the data presented in the Excel workbook (Module 3
Project_Keno_v1.xlsx). Complete all parts in the designated Excel workbook. Submit both
the report and the Excel workbook. The Excel workbook contains all statistical work. The
report should include all your findings along with important analysis.
Project Description
The game of Keno: keno is an ancient Chinese game that has become popular in recent
years. In one electronic version of this game, a player selects 20 numbers from the set of
numbers 1 through 100. The computer then randomly draws another set of 20 numbers
from the set 1 through 100, and the player is rewarded according to how many of his
selected numbers have been matched by the 20 numbers drawn by the computer.
Part 1
Let X be the number of matches between a player’s 20 selected numbers and the 20
numbers drawn by the computer. Then X may range from 0 (no match) to 20 (all match)
and follows a hyper-geometric probability distribution.
Complete all of the following steps (a – j) in worksheet Part 1 of the Excel workbook
provided. All cells should contain formulas.
a. Construct a tabular probability distribution for X in column E of the worksheet.
b. Construct a tabular cumulative probability distribution for X in column F of the
worksheet.
c. Create a graphical probability distribution for X.
d. Create a graphical cumulative probability distribution for X.
e. Calculate the theoretical expected value (mean), the theoretical variance, and the
theoretical standard deviation of X in the spaces provided for those quantities. Interpret
those values in your Word report
f. In column M of the worksheet, use the Excel function “=RAND()” to generate 1000
random values according to the standard uniform ...
Professional resume/CV for Bradley M Kremer. Mr Kremer is an international curriculum specialist and science educator based in Helsinki, Finland. He has worked in 6 countries across 3 continents.
This is the instruction sheet for my MYP year 4 chemistry unit on thermal energy. It's a Vernier lab, which means it requires proprietary probes from the Vernier company. I have adapted the company's original document to highlight key steps for my students.
Macroeconomics- Movie Location
This will be used as part of your Personal Professional Portfolio once graded.
Objective:
Prepare a presentation or a paper using research, basic comparative analysis, data organization and application of economic information. You will make an informed assessment of an economic climate outside of the United States to accomplish an entertainment industry objective.
Model Attribute Check Company Auto PropertyCeline George
In Odoo, the multi-company feature allows you to manage multiple companies within a single Odoo database instance. Each company can have its own configurations while still sharing common resources such as products, customers, and suppliers.
Introduction to AI for Nonprofits with Tapp NetworkTechSoup
Dive into the world of AI! Experts Jon Hill and Tareq Monaur will guide you through AI's role in enhancing nonprofit websites and basic marketing strategies, making it easy to understand and apply.
2024.06.01 Introducing a competency framework for languag learning materials ...Sandy Millin
http://sandymillin.wordpress.com/iateflwebinar2024
Published classroom materials form the basis of syllabuses, drive teacher professional development, and have a potentially huge influence on learners, teachers and education systems. All teachers also create their own materials, whether a few sentences on a blackboard, a highly-structured fully-realised online course, or anything in between. Despite this, the knowledge and skills needed to create effective language learning materials are rarely part of teacher training, and are mostly learnt by trial and error.
Knowledge and skills frameworks, generally called competency frameworks, for ELT teachers, trainers and managers have existed for a few years now. However, until I created one for my MA dissertation, there wasn’t one drawing together what we need to know and do to be able to effectively produce language learning materials.
This webinar will introduce you to my framework, highlighting the key competencies I identified from my research. It will also show how anybody involved in language teaching (any language, not just English!), teacher training, managing schools or developing language learning materials can benefit from using the framework.
Synthetic Fiber Construction in lab .pptxPavel ( NSTU)
Synthetic fiber production is a fascinating and complex field that blends chemistry, engineering, and environmental science. By understanding these aspects, students can gain a comprehensive view of synthetic fiber production, its impact on society and the environment, and the potential for future innovations. Synthetic fibers play a crucial role in modern society, impacting various aspects of daily life, industry, and the environment. ynthetic fibers are integral to modern life, offering a range of benefits from cost-effectiveness and versatility to innovative applications and performance characteristics. While they pose environmental challenges, ongoing research and development aim to create more sustainable and eco-friendly alternatives. Understanding the importance of synthetic fibers helps in appreciating their role in the economy, industry, and daily life, while also emphasizing the need for sustainable practices and innovation.
A Strategic Approach: GenAI in EducationPeter Windle
Artificial Intelligence (AI) technologies such as Generative AI, Image Generators and Large Language Models have had a dramatic impact on teaching, learning and assessment over the past 18 months. The most immediate threat AI posed was to Academic Integrity with Higher Education Institutes (HEIs) focusing their efforts on combating the use of GenAI in assessment. Guidelines were developed for staff and students, policies put in place too. Innovative educators have forged paths in the use of Generative AI for teaching, learning and assessments leading to pockets of transformation springing up across HEIs, often with little or no top-down guidance, support or direction.
This Gasta posits a strategic approach to integrating AI into HEIs to prepare staff, students and the curriculum for an evolving world and workplace. We will highlight the advantages of working with these technologies beyond the realm of teaching, learning and assessment by considering prompt engineering skills, industry impact, curriculum changes, and the need for staff upskilling. In contrast, not engaging strategically with Generative AI poses risks, including falling behind peers, missed opportunities and failing to ensure our graduates remain employable. The rapid evolution of AI technologies necessitates a proactive and strategic approach if we are to remain relevant.
Executive Directors Chat Leveraging AI for Diversity, Equity, and InclusionTechSoup
Let’s explore the intersection of technology and equity in the final session of our DEI series. Discover how AI tools, like ChatGPT, can be used to support and enhance your nonprofit's DEI initiatives. Participants will gain insights into practical AI applications and get tips for leveraging technology to advance their DEI goals.
Unit 8 - Information and Communication Technology (Paper I).pdfThiyagu K
This slides describes the basic concepts of ICT, basics of Email, Emerging Technology and Digital Initiatives in Education. This presentations aligns with the UGC Paper I syllabus.
Normal Labour/ Stages of Labour/ Mechanism of LabourWasim Ak
Normal labor is also termed spontaneous labor, defined as the natural physiological process through which the fetus, placenta, and membranes are expelled from the uterus through the birth canal at term (37 to 42 weeks
June 3, 2024 Anti-Semitism Letter Sent to MIT President Kornbluth and MIT Cor...Levi Shapiro
Letter from the Congress of the United States regarding Anti-Semitism sent June 3rd to MIT President Sally Kornbluth, MIT Corp Chair, Mark Gorenberg
Dear Dr. Kornbluth and Mr. Gorenberg,
The US House of Representatives is deeply concerned by ongoing and pervasive acts of antisemitic
harassment and intimidation at the Massachusetts Institute of Technology (MIT). Failing to act decisively to ensure a safe learning environment for all students would be a grave dereliction of your responsibilities as President of MIT and Chair of the MIT Corporation.
This Congress will not stand idly by and allow an environment hostile to Jewish students to persist. The House believes that your institution is in violation of Title VI of the Civil Rights Act, and the inability or
unwillingness to rectify this violation through action requires accountability.
Postsecondary education is a unique opportunity for students to learn and have their ideas and beliefs challenged. However, universities receiving hundreds of millions of federal funds annually have denied
students that opportunity and have been hijacked to become venues for the promotion of terrorism, antisemitic harassment and intimidation, unlawful encampments, and in some cases, assaults and riots.
The House of Representatives will not countenance the use of federal funds to indoctrinate students into hateful, antisemitic, anti-American supporters of terrorism. Investigations into campus antisemitism by the Committee on Education and the Workforce and the Committee on Ways and Means have been expanded into a Congress-wide probe across all relevant jurisdictions to address this national crisis. The undersigned Committees will conduct oversight into the use of federal funds at MIT and its learning environment under authorities granted to each Committee.
• The Committee on Education and the Workforce has been investigating your institution since December 7, 2023. The Committee has broad jurisdiction over postsecondary education, including its compliance with Title VI of the Civil Rights Act, campus safety concerns over disruptions to the learning environment, and the awarding of federal student aid under the Higher Education Act.
• The Committee on Oversight and Accountability is investigating the sources of funding and other support flowing to groups espousing pro-Hamas propaganda and engaged in antisemitic harassment and intimidation of students. The Committee on Oversight and Accountability is the principal oversight committee of the US House of Representatives and has broad authority to investigate “any matter” at “any time” under House Rule X.
• The Committee on Ways and Means has been investigating several universities since November 15, 2023, when the Committee held a hearing entitled From Ivory Towers to Dark Corners: Investigating the Nexus Between Antisemitism, Tax-Exempt Universities, and Terror Financing. The Committee followed the hearing with letters to those institutions on January 10, 202
Natural birth techniques - Mrs.Akanksha Trivedi Rama University
Graphing periodic trends
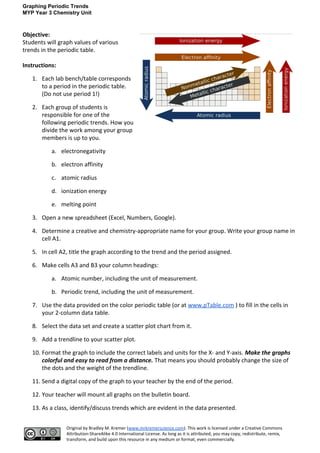
1. Graphing Periodic Trends
MYP Year 3 Chemistry Unit
Objective:
Students will graph values of various
trends in the periodic table.
Instructions:
1. Each lab bench/table corresponds
to a period in the periodic table.
(Do not use period 1!)
2. Each group of students is
responsible for one of the
following periodic trends. How you
divide the work among your group
members is up to you.
a. electronegativity
b. electron affinity
c. atomic radius
d. ionization energy
e. melting point
3. Open a new spreadsheet (Excel, Numbers, Google).
4. Determine a creative and chemistry-appropriate name for your group. Write your group name in
cell A1.
5. In cell A2, title the graph according to the trend and the period assigned.
6. Make cells A3 and B3 your column headings:
a. Atomic number, including the unit of measurement.
b. Periodic trend, including the unit of measurement.
7. Use the data provided on the color periodic table (or at www.pTable.com ) to fill in the cells in
your 2-column data table.
8. Select the data set and create a scatter plot chart from it.
9. Add a trendline to your scatter plot.
10. Format the graph to include the correct labels and units for the X- and Y-axis. Make the graphs
colorful and easy to read from a distance. That means you should probably change the size of
the dots and the weight of the trendline.
11. Send a digital copy of the graph to your teacher by the end of the period.
12. Your teacher will mount all graphs on the bulletin board.
13. As a class, identify/discuss trends which are evident in the data presented.
Original by Bradley M. Kremer (www.mrkremerscience.com). This work is licensed under a Creative Commons
Attribution-ShareAlike 4.0 International License. As long as it is attributed, you may copy, redistribute, remix,
transform, and build upon this resource in any medium or format, even commercially.