SlideShare a Scribd company logo
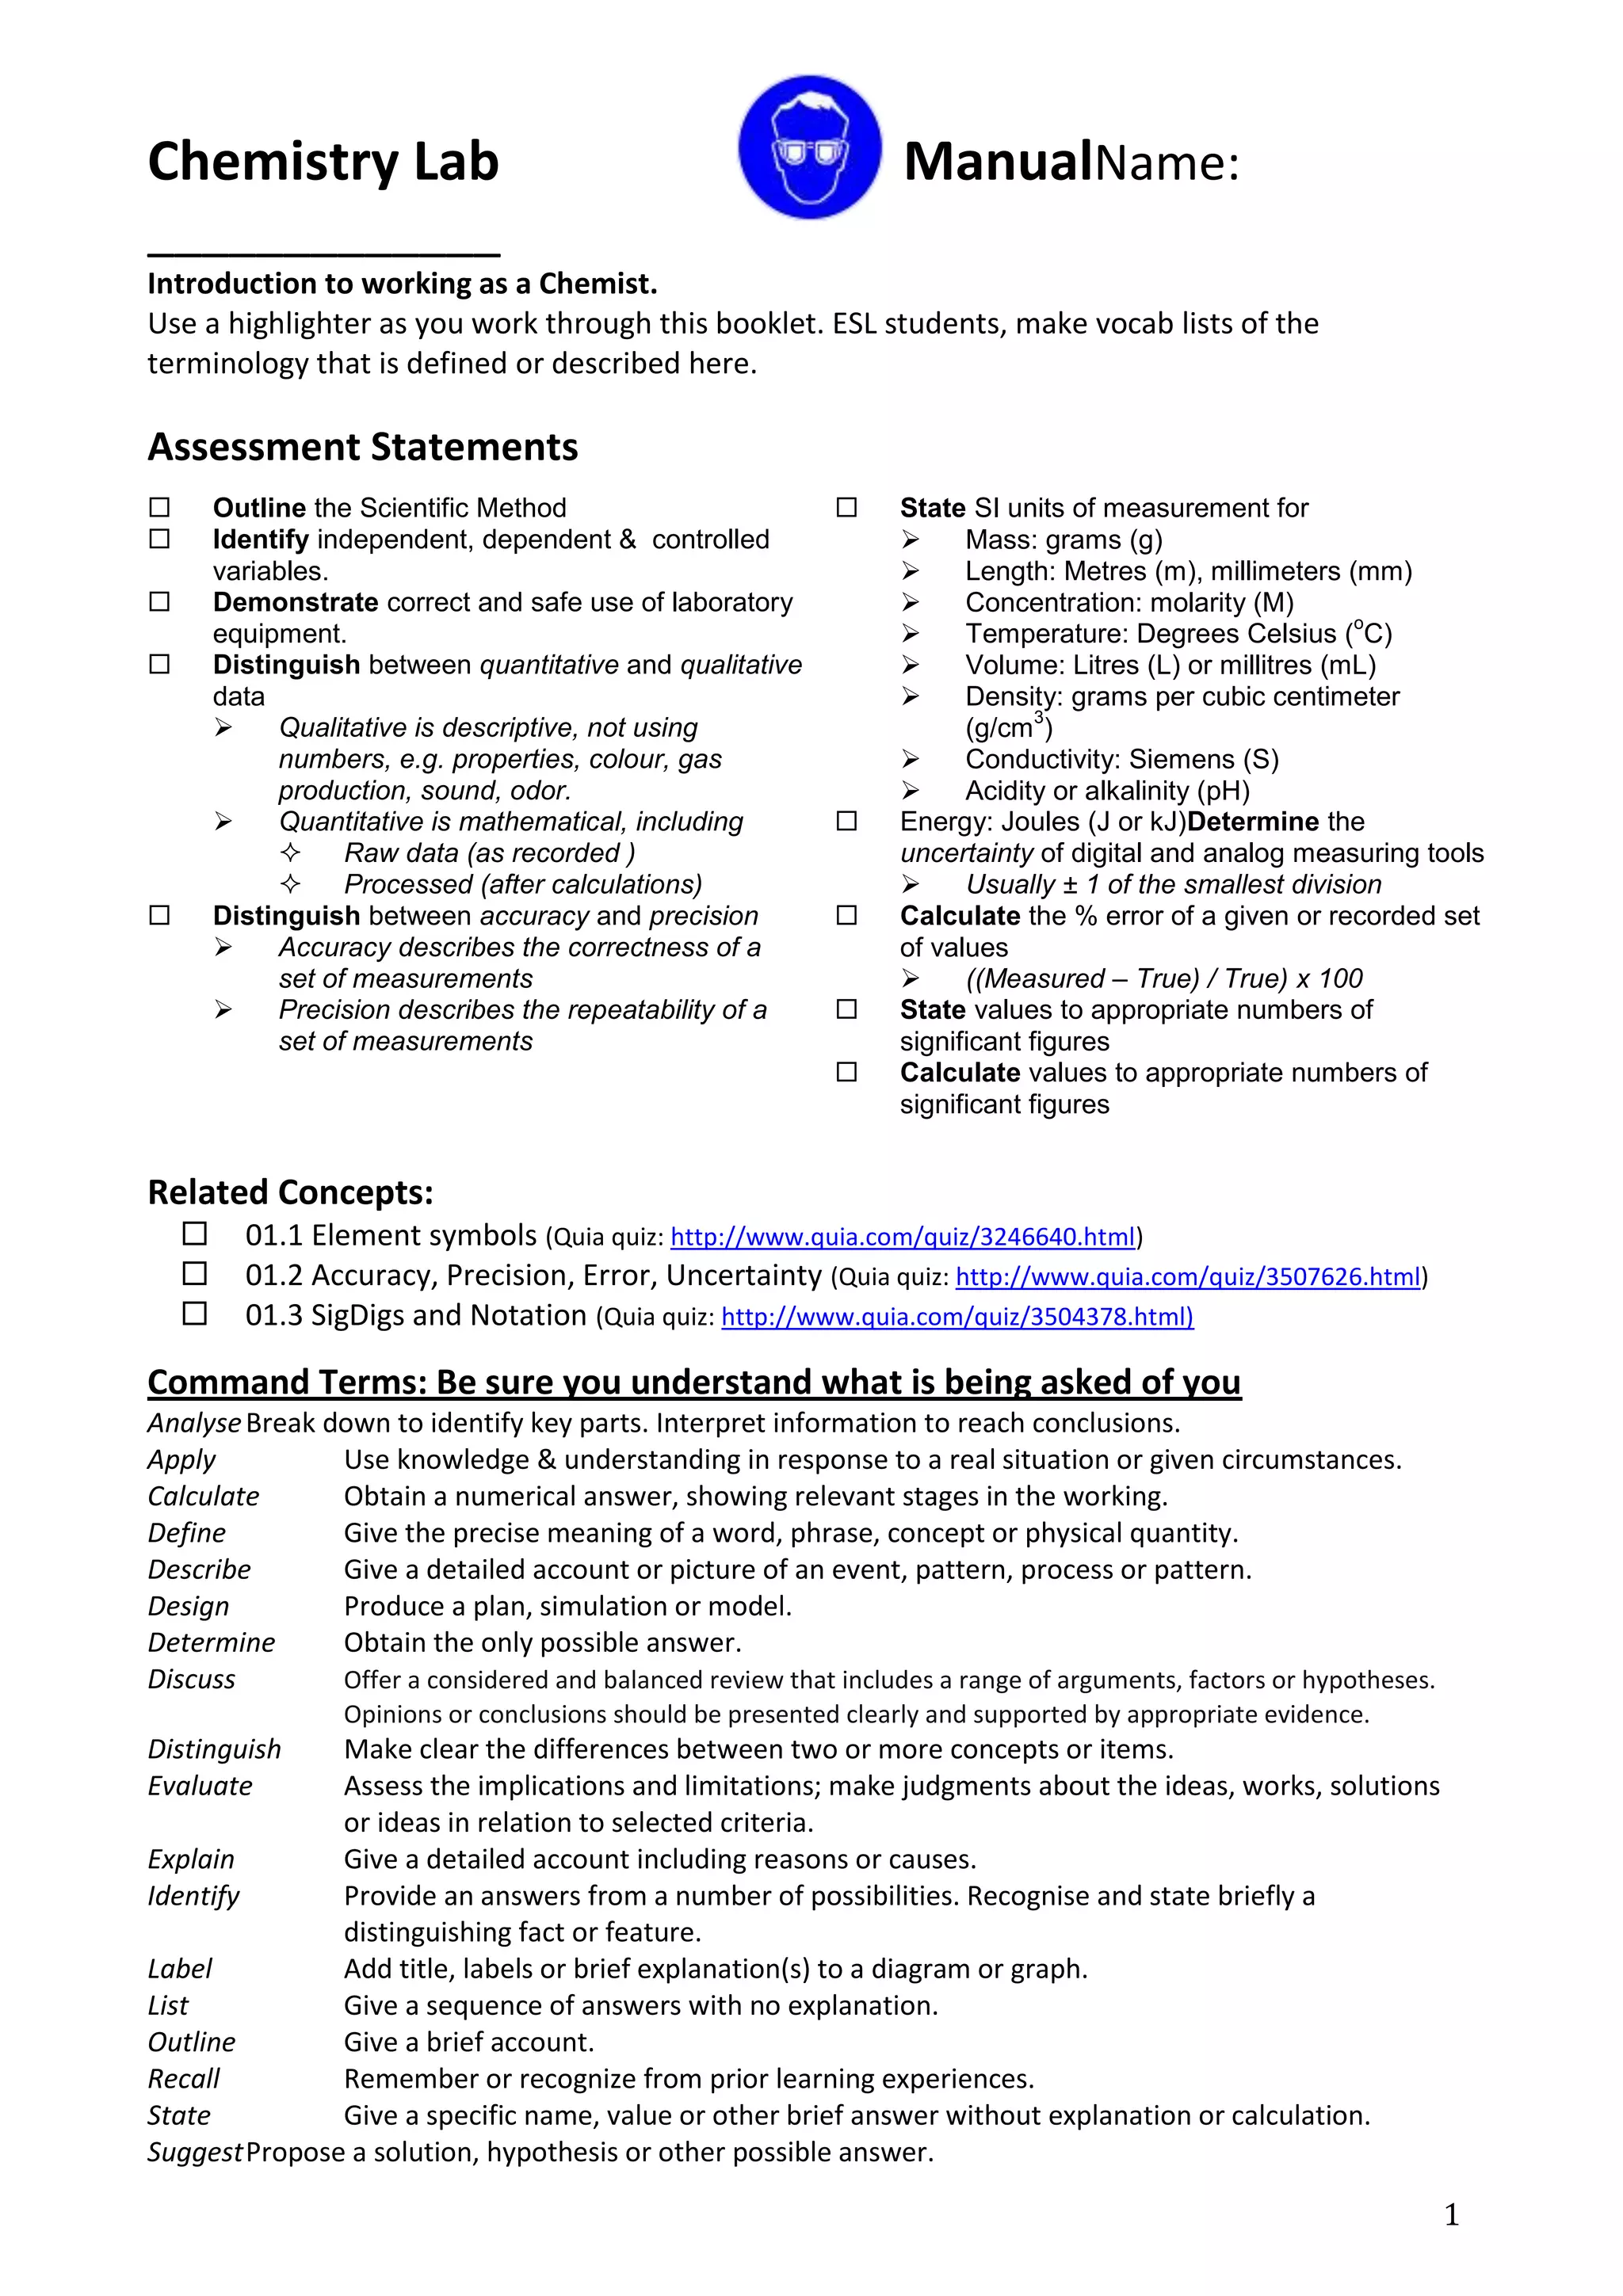
Chemistry Lab                                                      ManualName:
_____________
Introduction to working as a Chemist.
Use a highlighter as you work through this booklet. ESL students, make vocab lists of the
terminology that is defined or described here.

Assessment Statements
       Outline the Scientific Method                            State SI units of measurement for
       Identify independent, dependent & controlled                   Mass: grams (g)
        variables.                                                     Length: Metres (m), millimeters (mm)
       Demonstrate correct and safe use of laboratory                 Concentration: molarity (M)
                                                                                                          o
        equipment.                                                     Temperature: Degrees Celsius ( C)
       Distinguish between quantitative and qualitative               Volume: Litres (L) or millitres (mL)
        data                                                           Density: grams per cubic centimeter
                                                                               3
            Qualitative is descriptive, not using                      (g/cm )
             numbers, e.g. properties, colour, gas                     Conductivity: Siemens (S)
             production, sound, odor.                                  Acidity or alkalinity (pH)
            Quantitative is mathematical, including             Energy: Joules (J or kJ)Determine the
                  Raw data (as recorded )                        uncertainty of digital and analog measuring tools
                  Processed (after calculations)                      Usually ± 1 of the smallest division
       Distinguish between accuracy and precision               Calculate the % error of a given or recorded set
            Accuracy describes the correctness of a              of values
             set of measurements                                       ((Measured – True) / True) x 100
            Precision describes the repeatability of a          State values to appropriate numbers of
             set of measurements                                  significant figures
                                                                 Calculate values to appropriate numbers of
                                                                  significant figures


Related Concepts:
         01.1 Element symbols (Quia quiz: http://www.quia.com/quiz/3246640.html)
         01.2 Accuracy, Precision, Error, Uncertainty (Quia quiz: http://www.quia.com/quiz/3507626.html)
         01.3 SigDigs and Notation (Quia quiz: http://www.quia.com/quiz/3504378.html)

Command Terms: Be sure you understand what is being asked of you
Analyse Break down to identify key parts. Interpret information to reach conclusions.
Apply          Use knowledge & understanding in response to a real situation or given circumstances.
Calculate      Obtain a numerical answer, showing relevant stages in the working.
Define         Give the precise meaning of a word, phrase, concept or physical quantity.
Describe       Give a detailed account or picture of an event, pattern, process or pattern.
Design         Produce a plan, simulation or model.
Determine      Obtain the only possible answer.
Discuss        Offer a considered and balanced review that includes a range of arguments, factors or hypotheses.
                  Opinions or conclusions should be presented clearly and supported by appropriate evidence.
Distinguish    Make clear the differences between two or more concepts or items.
Evaluate       Assess the implications and limitations; make judgments about the ideas, works, solutions
               or ideas in relation to selected criteria.
Explain        Give a detailed account including reasons or causes.
Identify       Provide an answers from a number of possibilities. Recognise and state briefly a
               distinguishing fact or feature.
Label          Add title, labels or brief explanation(s) to a diagram or graph.
List           Give a sequence of answers with no explanation.
Outline        Give a brief account.
Recall         Remember or recognize from prior learning experiences.
State          Give a specific name, value or other brief answer without explanation or calculation.
Suggest Propose a solution, hypothesis or other possible answer.

                                                                                                                   1
Use   Apply knowledge or rules to put theory into practice.


                                                              2
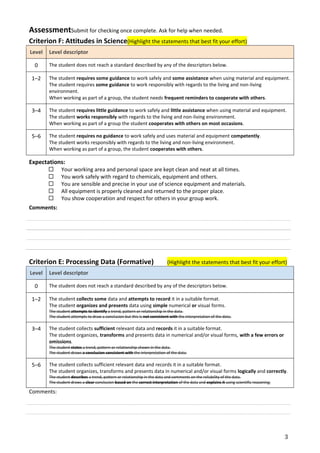
AssessmentSubmit for checking once complete. Ask for help when needed.
Criterion F: Attitudes in Science(Highlight the statements that best fit your effort)
Level   Level descriptor

  0     The student does not reach a standard described by any of the descriptors below.

 1–2    The student requires some guidance to work safely and some assistance when using material and equipment.
        The student requires some guidance to work responsibly with regards to the living and non-living
        environment.
        When working as part of a group, the student needs frequent reminders to cooperate with others.

 3–4    The student requires little guidance to work safely and little assistance when using material and equipment.
        The student works responsibly with regards to the living and non-living environment.
        When working as part of a group the student cooperates with others on most occasions.

 5–6    The student requires no guidance to work safely and uses material and equipment competently.
        The student works responsibly with regards to the living and non-living environment.
        When working as part of a group, the student cooperates with others.

Expectations:
              Your working area and personal space are kept clean and neat at all times.
              You work safely with regard to chemicals, equipment and others.
              You are sensible and precise in your use of science equipment and materials.
              All equipment is properly cleaned and returned to the proper place.
              You show cooperation and respect for others in your group work.
Comments:


Criterion E: Processing Data (Formative)                                    (Highlight the statements that best fit your effort)
Level   Level descriptor

  0     The student does not reach a standard described by any of the descriptors below.

 1–2    The student collects some data and attempts to record it in a suitable format.
        The student organizes and presents data using simple numerical or visual forms.
        The student attempts to identify a trend, pattern or relationship in the data.
        The student attempts to draw a conclusion but this is not consistent with the interpretation of the data.

 3–4    The student collects sufficient relevant data and records it in a suitable format.
        The student organizes, transforms and presents data in numerical and/or visual forms, with a few errors or
        omissions.
        The student states a trend, pattern or relationship shown in the data.
        The student draws a conclusion consistent with the interpretation of the data.

 5–6    The student collects sufficient relevant data and records it in a suitable format.
        The student organizes, transforms and presents data in numerical and/or visual forms logically and correctly.
        The student describes a trend, pattern or relationship in the data and comments on the reliability of the data.
        The student draws a clear conclusion based on the correct interpretation of the data and explains it using scientific reasoning.

Comments:


                                                                                                                                           3
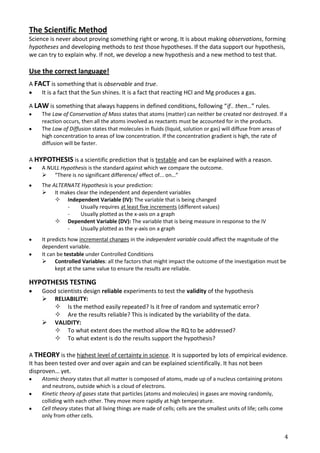
The Scientific Method
Science is never about proving something right or wrong. It is about making observations, forming
hypotheses and developing methods to test those hypotheses. If the data support our hypothesis,
we can try to explain why. If not, we develop a new hypothesis and a new method to test that.

Use the correct language!
A FACT is something that is observable and true.
    It is a fact that the Sun shines. It is a fact that reacting HCl and Mg produces a gas.

A LAW is something that always happens in defined conditions, following “if.. then…” rules.
     The Law of Conservation of Mass states that atoms (matter) can neither be created nor destroyed. If a
     reaction occurs, then all the atoms involved as reactants must be accounted for in the products.
     The Law of Diffusion states that molecules in fluids (liquid, solution or gas) will diffuse from areas of
     high concentration to areas of low concentration. If the concentration gradient is high, the rate of
     diffusion will be faster.

A HYPOTHESIS is a scientific prediction that is testable and can be explained with a reason.
     A NULL Hypothesis is the standard against which we compare the outcome.
      “There is no significant difference/ effect of... on…”
     The ALTERNATE Hypothesis is your prediction:
      It makes clear the independent and dependent variables
           Independent Variable (IV): The variable that is being changed
              -   Usually requires at least five increments (different values)
              -   Usually plotted as the x-axis on a graph
           Dependent Variable (DV): The variable that is being measure in response to the IV
              -   Usually plotted as the y-axis on a graph
     It predicts how incremental changes in the independent variable could affect the magnitude of the
     dependent variable.
     It can be testable under Controlled Conditions
      Controlled Variables: all the factors that might impact the outcome of the investigation must be
           kept at the same value to ensure the results are reliable.

HYPOTHESIS TESTING
     Good scientists design reliable experiments to test the validity of the hypothesis
      RELIABILITY:
          Is the method easily repeated? Is it free of random and systematic error?
          Are the results reliable? This is indicated by the variability of the data.
      VALIDITY:
          To what extent does the method allow the RQ to be addressed?
          To what extent is do the results support the hypothesis?

A THEORY is the highest level of certainty in science. It is supported by lots of empirical evidence.
It has been tested over and over again and can be explained scientifically. It has not been
disproven… yet.
     Atomic theory states that all matter is composed of atoms, made up of a nucleus containing protons
     and neutrons, outside which is a cloud of electrons.
     Kinetic theory of gases state that particles (atoms and molecules) in gases are moving randomly,
     colliding with each other. They move more rapidly at high temperature.
     Cell theory states that all living things are made of cells; cells are the smallest units of life; cells come
     only from other cells.


                                                                                                                     4
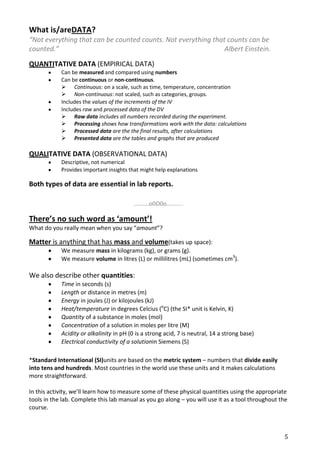
What is/areDATA?
“Not everything that can be counted counts. Not everything that counts can be
counted.”                                                      Albert Einstein.

QUANTITATIVE DATA (EMPIRICAL DATA)
            Can be measured and compared using numbers
            Can be continuous or non-continuous.
             Continuous: on a scale, such as time, temperature, concentration
             Non-continuous: not scaled, such as categories, groups.
            Includes the values of the increments of the IV
            Includes raw and processed data of the DV
             Raw data includes all numbers recorded during the experiment.
             Processing shows how transformations work with the data: calculations
             Processed data are the the final results, after calculations
             Presented data are the tables and graphs that are produced

QUALITATIVE DATA (OBSERVATIONAL DATA)
            Descriptive, not numerical
            Provides important insights that might help explanations

Both types of data are essential in lab reports.

                                          ……….o0O0o………..

There’s no such word as ‘amount’!
What do you really mean when you say “amount”?

Matter is anything that has mass and volume(takes up space):
            We measure mass in kilograms (kg), or grams (g).
            We measure volume in litres (L) or millilitres (mL) (sometimes cm3).

We also describe other quantities:
            Time in seconds (s)
            Length or distance in metres (m)
            Energy in joules (J) or kilojoules (kJ)
            Heat/temperature in degrees Celcius (oC) (the SI* unit is Kelvin, K)
            Quantity of a substance in moles (mol)
            Concentration of a solution in moles per litre (M)
            Acidity or alkalinity in pH (0 is a strong acid, 7 is neutral, 14 a strong base)
            Electrical conductivity of a solutionin Siemens (S)

*Standard International (SI)units are based on the metric system – numbers that divide easily
into tens and hundreds. Most countries in the world use these units and it makes calculations
more straightforward.

In this activity, we’ll learn how to measure some of these physical quantities using the appropriate
tools in the lab. Complete this lab manual as you go along – you will use it as a tool throughout the
course.


                                                                                                   5
Safety First
We must be safe in the lab at all times. Check that you can find these:
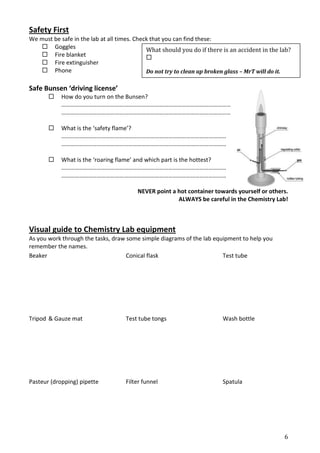
    Goggles                                 What should you do if there is an accident in the lab?
    Fire blanket                            
    Fire extinguisher
    Phone                                   Do not try to clean up broken glass – MrT will do it.

Safe Bunsen ‘driving license’
           How do you turn on the Bunsen?
            ……………………………………………………………………………………………………
            ……………………………………………………………………………………………………

           What is the ‘safety flame’?
            …………………………………………………………………………………………………
            …………………………………………………………………………………………………

           What is the ‘roaring flame’ and which part is the hottest?
            …………………………………………………………………………………………………
            …………………………………………………………………………………………………

                                         NEVER point a hot container towards yourself or others.
                                                       ALWAYS be careful in the Chemistry Lab!


Visual guide to Chemistry Lab equipment
As you work through the tasks, draw some simple diagrams of the lab equipment to help you
remember the names.
Beaker                              Conical flask                      Test tube


Tripod & Gauze mat                  Test tube tongs                      Wash bottle


Pasteur (dropping) pipette          Filter funnel                        Spatula


                                                                                                6
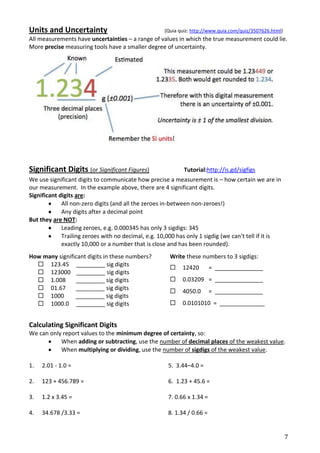
Units and Uncertainty                                (Quia quiz: http://www.quia.com/quiz/3507626.html)
All measurements have uncertainties – a range of values in which the true measurement could lie.
More precise measuring tools have a smaller degree of uncertainty.


Significant Digits (or Significant Figures)                  Tutorial:http://is.gd/sigfigs
We use significant digits to communicate how precise a measurement is – how certain we are in
our measurement. In the example above, there are 4 significant digits.
Significant digits are:
             All non-zero digits (and all the zeroes in-between non-zeroes!)
             Any digits after a decimal point
But they are NOT:
             Leading zeroes, e.g. 0.000345 has only 3 sigdigs: 345
             Trailing zeroes with no decimal, e.g. 10,000 has only 1 sigdig (we can’t tell if it is
             exactly 10,000 or a number that is close and has been rounded).
How many significant digits in these numbers?          Write these numbers to 3 sigdigs:
   123.45 _________ sig digits
                                                           12420        = _______________
   123000 _________ sig digits
   1.008       _________ sig digits                       0.03209 = _______________
   01.67       _________ sig digits
                                                           4050.0       = _______________
   1000        _________ sig digits
   1000.0 _________ sig digits                            0.0101010 = ______________


Calculating Significant Digits
We can only report values to the minimum degree of certainty, so:
           When adding or subtracting, use the number of decimal places of the weakest value.
           When multiplying or dividing, use the number of sigdigs of the weakest value.

1.   2.01 - 1.0 =                                     5. 3.44–4.0 =

2.   123 + 456.789 =                                  6. 1.23 + 45.6 =

3.   1.2 x 3.45 =                                     7. 0.66 x 1.34 =

4.   34.678 /3.33 =                                   8. 1.34 / 0.66 =


                                                                                                          7
Accuracy, Precision & Errors                         (Quia quiz: http://www.quia.com/quiz/3507626.html)

There is always an element of error in our measurements.
The accuracy of a measurement is how close it lies to the true value (“correct
answer”). The precision of a measurement is how repeatable that measurement is.
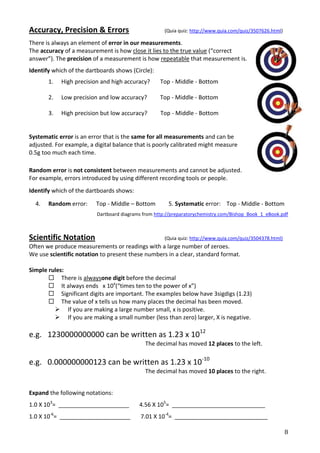
Identify which of the dartboards shows (Circle):
       1.   High precision and high accuracy?       Top - Middle - Bottom

       2.   Low precision and low accuracy?         Top - Middle - Bottom

       3.   High precision but low accuracy?        Top - Middle - Bottom


Systematic error is an error that is the same for all measurements and can be
adjusted. For example, a digital balance that is poorly calibrated might measure
0.5g too much each time.

Random error is not consistent between measurements and cannot be adjusted.
For example, errors introduced by using different recording tools or people.
Identify which of the dartboards shows:

  4.   Random error:     Top - Middle – Bottom         5. Systematic error: Top - Middle - Bottom
                          Dartboard diagrams from http://preparatorychemistry.com/Bishop_Book_1_eBook.pdf


Scientific Notation                                  (Quia quiz: http://www.quia.com/quiz/3504378.html)
Often we produce measurements or readings with a large number of zeroes.
We use scientific notation to present these numbers in a clear, standard format.

Simple rules:
        There is alwaysone digit before the decimal
        It always ends x 10x(“times ten to the power of x”)
        Significant digits are important. The examples below have 3sigdigs (1.23)
        The value of x tells us how many places the decimal has been moved.
          If you are making a large number small, x is positive.
          If you are making a small number (less than zero) larger, X is negative.

e.g. 1230000000000 can be written as 1.23 x 10¹²
                                             The decimal has moved 12 places to the left.

e.g. 0.000000000123 can be written as 1.23 x 10⁻¹⁰
                                             The decimal has moved 10 places to the right.


Expand the following notations:
1.0 X 103= ______________________          4.56 X 105= _____________________________
1.0 X 10-6= ______________________          7.01 X 10-4= _____________________________

                                                                                                          8
Statethe following in scientific notation to 3 significant digits:
    •   12340000        = _____________________________
    •   00012340        = _____________________________
    •   10101010        = _____________________________


Compare the following measurements:
3.04 x 10⁴ kJ   3.040 x 10⁴ kJ 3.0400 x 10⁴ kJ


What is a Solution?
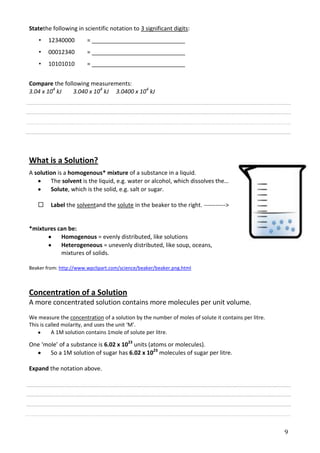
A solution is a homogenous* mixture of a substance in a liquid.
        The solvent is the liquid, e.g. water or alcohol, which dissolves the…
        Solute, which is the solid, e.g. salt or sugar.

        Label the solventand the solute in the beaker to the right. ----------->


*mixtures can be:
           Homogenous = evenly distributed, like solutions
           Heterogeneous = unevenly distributed, like soup, oceans,
           mixtures of solids.

Beaker from: http://www.wpclipart.com/science/beaker/beaker.png.html


Concentration of a Solution
A more concentrated solution contains more molecules per unit volume.
We measure the concentration of a solution by the number of moles of solute it contains per litre.
This is called molarity, and uses the unit ‘M’.
          A 1M solution contains 1mole of solute per litre.

One ‘mole’ of a substance is 6.02 x 10²³ units (atoms or molecules).
       So a 1M solution of sugar has 6.02 x 10²³ molecules of sugar per litre.

Expand the notation above.


                                                                                                     9
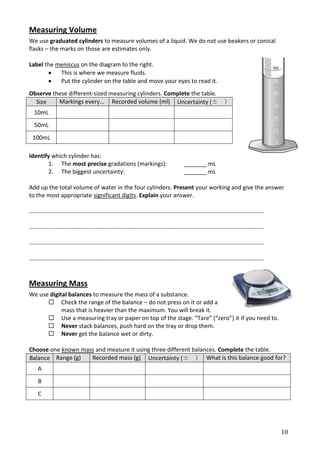
Measuring Volume
We use graduated cylinders to measure volumes of a liquid. We do not use beakers or conical
flasks – the marks on those are estimates only.

Label the meniscus on the diagram to the right.
           This is where we measure fluids.
           Put the cylinder on the table and move your eyes to read it.
Observe these different-sized measuring cylinders. Complete the table.
  Size    Markings every… Recorded volume (ml) Uncertainty (±             )
 10mL
 50mL
 100mL

Identify which cylinder has:
        1. The most precise gradations (markings):        _______ mL
        2. The biggest uncertainty:                       _______ mL

Add up the total volume of water in the four cylinders. Present your working and give the answer
to the most appropriate significant digits. Explain your answer.

…………………………………………………………………………………………………………………………………………..

…………………………………………………………………………………………………………………………………………..

…………………………………………………………………………………………………………………………………………..

…………………………………………………………………………………………………………………………………………..


Measuring Mass
We use digital balances to measure the mass of a substance.
       Check the range of the balance – do not press on it or add a
            mass that is heavier than the maximum. You will break it.
       Use a measuring tray or paper on top of the stage. “Tare” (“zero”) it if you need to.
       Never stack balances, push hard on the tray or drop them.
       Never get the balance wet or dirty.

Choose one known mass and measure it using three different balances. Complete the table.
Balance Range (g)   Recorded mass (g) Uncertainty (± ) What is this balance good for?
   A
   B
   C


                                                                                                10
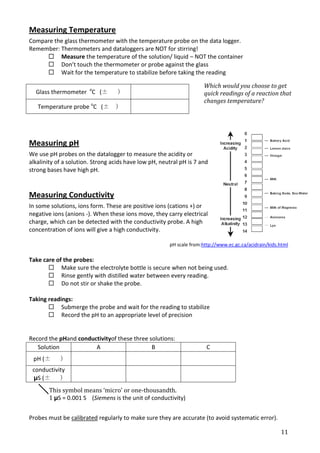
Measuring Temperature
Compare the glass thermometer with the temperature probe on the data logger.
Remember: Thermometers and dataloggers are NOT for stirring!
      Measure the temperature of the solution/ liquid – NOT the container
      Don’t touch the thermometer or probe against the glass
      Wait for the temperature to stabilize before taking the reading

                                                                      Which would you choose to get
  Glass thermometer oC (±          )                                  quick readings of a reaction that
                                                                      changes temperature?
   Temperature probe oC (±        )


Measuring pH
We use pH probes on the datalogger to measure the acidity or
alkalinity of a solution. Strong acids have low pH, neutral pH is 7 and
strong bases have high pH.


Measuring Conductivity
In some solutions, ions form. These are positive ions (cations +) or
negative ions (anions -). When these ions move, they carry electrical
charge, which can be detected with the conductivity probe. A high
concentration of ions will give a high conductivity.

                                                       pH scale from:http://www.ec.gc.ca/acidrain/kids.html

Take care of the probes:
        Make sure the electrolyte bottle is secure when not being used.
        Rinse gently with distilled water between every reading.
        Do not stir or shake the probe.

Taking readings:
        Submerge the probe and wait for the reading to stabilize
        Record the pH to an appropriate level of precision


Record the pHand conductivityof these three solutions:
   Solution            A                     B                         C
 pH (±      )
 conductivity
 μS (± )
       This symbol means ‘micro’ or one-thousandth.
       1 μS = 0.001 S (Siemens is the unit of conductivity)


Probes must be calibrated regularly to make sure they are accurate (to avoid systematic error).

                                                                                                       11
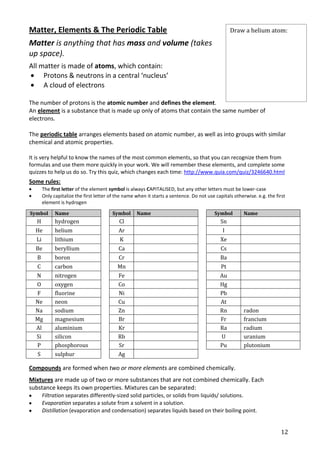
Matter, Elements & The Periodic Table                                                              Draw a helium atom:

Matter is anything that has mass and volume (takes
up space).
All matter is made of atoms, which contain:
     Protons & neutrons in a central ‘nucleus’
     A cloud of electrons

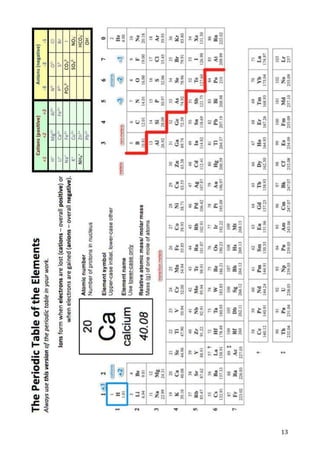
The number of protons is the atomic number and defines the element.
An element is a substance that is made up only of atoms that contain the same number of
electrons.

The periodic table arranges elements based on atomic number, as well as into groups with similar
chemical and atomic properties.

It is very helpful to know the names of the most common elements, so that you can recognize them from
formulas and use them more quickly in your work. We will remember these elements, and complete some
quizzes to help us do so. Try this quiz, which changes each time: http://www.quia.com/quiz/3246640.html
Some rules:
        The first letter of the element symbol is always CAPITALISED, but any other letters must be lower-case
        Only capitalize the first letter of the name when it starts a sentence. Do not use capitals otherwise. e.g. the first
        element is hydrogen

Symbol        Name                       Symbol      Name                                  Symbol        Name
   H          hydrogen                       Cl                                              Sn
  He          helium                        Ar                                                I
   Li         lithium                        K                                               Xe
  Be          beryllium                     Ca                                                Cs
   B          boron                         Cr                                               Ba
   C          carbon                        Mn                                                Pt
  N           nitrogen                      Fe                                               Au
  O           oxygen                        Co                                               Hg
  F           fluorine                      Ni                                               Pb
  Ne          neon                          Cu                                               At
  Na          sodium                        Zn                                               Rn          radon
  Mg          magnesium                     Br                                               Fr          francium
  Al          aluminium                     Kr                                               Ra          radium
  Si          silicon                       Rb                                               U           uranium
  P           phosphorous                   Sr                                               Pu          plutonium
   S          sulphur                       Ag

Compounds are formed when two or more elements are combined chemically.
Mixtures are made up of two or more substances that are not combined chemically. Each
substance keeps its own properties. Mixtures can be separated:
        Filtration separates differently-sized solid particles, or solids from liquids/ solutions.
        Evaporation separates a solute from a solvent in a solution.
        Distillation (evaporation and condensation) separates liquids based on their boiling point.


                                                                                                                           12
13

More Related Content

What's hot

Basic lab safety principles
Basic lab safety principlesBasic lab safety principles
Basic lab safety principlesRania Elsharkawy
 
chemistry : Preparation of solution
chemistry : Preparation of solutionchemistry : Preparation of solution
chemistry : Preparation of solution
Shahriffah Norainy
 
Lab safety
Lab safetyLab safety
Lab safety
menwar
 
Laboratory safety
Laboratory safetyLaboratory safety
Laboratory safety
Dr. Amsavel A
 
Laboratory Hygiene & Saftey
Laboratory Hygiene & SafteyLaboratory Hygiene & Saftey
Laboratory Hygiene & Saftey
geetha T
 
lab safety ppt
lab safety pptlab safety ppt
lab safety ppt
Adrianna Nading
 
Lab safety good ppt
Lab safety   good pptLab safety   good ppt
Lab safety good ppt
Guerillateacher
 
Measurement Of Total alkalinity presentation report
Measurement Of Total alkalinity presentation reportMeasurement Of Total alkalinity presentation report
Measurement Of Total alkalinity presentation report
Devansh Gupta
 
Lab glassware & their uses
Lab glassware & their usesLab glassware & their uses
Lab glassware & their uses
Science Equip
 
Lab 2 the spectrometer &; beer`s law
Lab 2 the spectrometer &; beer`s lawLab 2 the spectrometer &; beer`s law
Lab 2 the spectrometer &; beer`s law
Anas Maghayreh
 
Ion exchange process
Ion exchange processIon exchange process
Ion exchange process
sourabhrana21
 
Unit 1, Lesson 1.6 - Safety in the Laboratory
Unit 1, Lesson 1.6 - Safety in the LaboratoryUnit 1, Lesson 1.6 - Safety in the Laboratory
Unit 1, Lesson 1.6 - Safety in the Laboratory
judan1970
 
LabEquipment.pdf
LabEquipment.pdfLabEquipment.pdf
LabEquipment.pdf
Yokasaranya
 
Lab safety and PPE and Biosafety levels
Lab safety and PPE and Biosafety levelsLab safety and PPE and Biosafety levels
Lab safety and PPE and Biosafety levels
harini challapalli
 
Storage and handling of chemicals
Storage and handling of chemicalsStorage and handling of chemicals
Storage and handling of chemicals
Suresh Selvaraj
 

What's hot (20)

Basic lab safety principles
Basic lab safety principlesBasic lab safety principles
Basic lab safety principles
 
chemistry : Preparation of solution
chemistry : Preparation of solutionchemistry : Preparation of solution
chemistry : Preparation of solution
 
Lab safety
Lab safetyLab safety
Lab safety
 
Lab Safety
Lab SafetyLab Safety
Lab Safety
 
Laboratory safety
Laboratory safetyLaboratory safety
Laboratory safety
 
Laboratory Hygiene & Saftey
Laboratory Hygiene & SafteyLaboratory Hygiene & Saftey
Laboratory Hygiene & Saftey
 
lab safety ppt
lab safety pptlab safety ppt
lab safety ppt
 
Lab safety good ppt
Lab safety   good pptLab safety   good ppt
Lab safety good ppt
 
reagents
reagentsreagents
reagents
 
Measurement Of Total alkalinity presentation report
Measurement Of Total alkalinity presentation reportMeasurement Of Total alkalinity presentation report
Measurement Of Total alkalinity presentation report
 
Lab glassware & their uses
Lab glassware & their usesLab glassware & their uses
Lab glassware & their uses
 
Lab 2 the spectrometer &; beer`s law
Lab 2 the spectrometer &; beer`s lawLab 2 the spectrometer &; beer`s law
Lab 2 the spectrometer &; beer`s law
 
Ion exchange process
Ion exchange processIon exchange process
Ion exchange process
 
Unit 1, Lesson 1.6 - Safety in the Laboratory
Unit 1, Lesson 1.6 - Safety in the LaboratoryUnit 1, Lesson 1.6 - Safety in the Laboratory
Unit 1, Lesson 1.6 - Safety in the Laboratory
 
Laboratory safety
Laboratory safetyLaboratory safety
Laboratory safety
 
My presentation
My presentationMy presentation
My presentation
 
LabEquipment.pdf
LabEquipment.pdfLabEquipment.pdf
LabEquipment.pdf
 
Lab safety rules and symbols Summary
Lab safety rules and symbols SummaryLab safety rules and symbols Summary
Lab safety rules and symbols Summary
 
Lab safety and PPE and Biosafety levels
Lab safety and PPE and Biosafety levelsLab safety and PPE and Biosafety levels
Lab safety and PPE and Biosafety levels
 
Storage and handling of chemicals
Storage and handling of chemicalsStorage and handling of chemicals
Storage and handling of chemicals
 

Viewers also liked

Reactions & Formulas Lab Sequence
Reactions & Formulas Lab SequenceReactions & Formulas Lab Sequence
Reactions & Formulas Lab Sequence
Stephen Taylor
 
Current Electricity: "I used to think... Now I think."
Current Electricity: "I used to think... Now I think."Current Electricity: "I used to think... Now I think."
Current Electricity: "I used to think... Now I think."Stephen Taylor
 
01 Nature of Biology
01 Nature of Biology01 Nature of Biology
01 Nature of Biology
Stephen Taylor
 
How International Is Our School? MA Dissertation
How International Is Our School? MA DissertationHow International Is Our School? MA Dissertation
How International Is Our School? MA Dissertation
Stephen Taylor
 
Human Subject Consent Form
Human Subject Consent FormHuman Subject Consent Form
Human Subject Consent Form
Stephen Taylor
 
Red Bull Stratos: Freefall Physics
Red Bull Stratos: Freefall PhysicsRed Bull Stratos: Freefall Physics
Red Bull Stratos: Freefall Physics
Stephen Taylor
 
Trivium 21C Review in International School Magazine
Trivium 21C Review in International School MagazineTrivium 21C Review in International School Magazine
Trivium 21C Review in International School Magazine
Stephen Taylor
 
Cells Super Crossword
Cells Super CrosswordCells Super Crossword
Cells Super Crossword
Stephen Taylor
 
Chemistry Lab Manual 2012-13
Chemistry Lab Manual 2012-13Chemistry Lab Manual 2012-13
Chemistry Lab Manual 2012-13
Stephen Taylor
 
One World Coversheet, Checklist, Writing Frame
One World Coversheet, Checklist, Writing FrameOne World Coversheet, Checklist, Writing Frame
One World Coversheet, Checklist, Writing Frame
Stephen Taylor
 
One World: Think Global, Act Local
One World: Think Global, Act LocalOne World: Think Global, Act Local
One World: Think Global, Act Local
Stephen Taylor
 
Curriculum Studies Assignment
Curriculum Studies AssignmentCurriculum Studies Assignment
Curriculum Studies Assignment
Stephen Taylor
 
A Pragmatic Approach to Inquiry
A Pragmatic Approach to InquiryA Pragmatic Approach to Inquiry
A Pragmatic Approach to Inquiry
Stephen Taylor
 
How International Is You School?
How International Is You School? How International Is You School?
How International Is You School?
Stephen Taylor
 
MYP: Mind The Gap [MA Assignment]
MYP: Mind The Gap [MA Assignment]MYP: Mind The Gap [MA Assignment]
MYP: Mind The Gap [MA Assignment]
Stephen Taylor
 
Qr Orienteering: Map and QR Codes
Qr Orienteering: Map and QR CodesQr Orienteering: Map and QR Codes
Qr Orienteering: Map and QR Codes
Stephen Taylor
 
Protein Synthesis: 3.5 Transcription & Translation (SL)
Protein Synthesis: 3.5 Transcription & Translation (SL)Protein Synthesis: 3.5 Transcription & Translation (SL)
Protein Synthesis: 3.5 Transcription & Translation (SL)
Stephen Taylor
 
A3 special issues in nutrition
A3 special issues in nutritionA3 special issues in nutrition
A3 special issues in nutritionStephen Taylor
 
Extended Essay Frame
Extended Essay FrameExtended Essay Frame
Extended Essay Frame
Stephen Taylor
 
Assessment Assignment: Bath MA International Education
Assessment Assignment: Bath MA International EducationAssessment Assignment: Bath MA International Education
Assessment Assignment: Bath MA International Education
Stephen Taylor
 

Viewers also liked (20)

Reactions & Formulas Lab Sequence
Reactions & Formulas Lab SequenceReactions & Formulas Lab Sequence
Reactions & Formulas Lab Sequence
 
Current Electricity: "I used to think... Now I think."
Current Electricity: "I used to think... Now I think."Current Electricity: "I used to think... Now I think."
Current Electricity: "I used to think... Now I think."
 
01 Nature of Biology
01 Nature of Biology01 Nature of Biology
01 Nature of Biology
 
How International Is Our School? MA Dissertation
How International Is Our School? MA DissertationHow International Is Our School? MA Dissertation
How International Is Our School? MA Dissertation
 
Human Subject Consent Form
Human Subject Consent FormHuman Subject Consent Form
Human Subject Consent Form
 
Red Bull Stratos: Freefall Physics
Red Bull Stratos: Freefall PhysicsRed Bull Stratos: Freefall Physics
Red Bull Stratos: Freefall Physics
 
Trivium 21C Review in International School Magazine
Trivium 21C Review in International School MagazineTrivium 21C Review in International School Magazine
Trivium 21C Review in International School Magazine
 
Cells Super Crossword
Cells Super CrosswordCells Super Crossword
Cells Super Crossword
 
Chemistry Lab Manual 2012-13
Chemistry Lab Manual 2012-13Chemistry Lab Manual 2012-13
Chemistry Lab Manual 2012-13
 
One World Coversheet, Checklist, Writing Frame
One World Coversheet, Checklist, Writing FrameOne World Coversheet, Checklist, Writing Frame
One World Coversheet, Checklist, Writing Frame
 
One World: Think Global, Act Local
One World: Think Global, Act LocalOne World: Think Global, Act Local
One World: Think Global, Act Local
 
Curriculum Studies Assignment
Curriculum Studies AssignmentCurriculum Studies Assignment
Curriculum Studies Assignment
 
A Pragmatic Approach to Inquiry
A Pragmatic Approach to InquiryA Pragmatic Approach to Inquiry
A Pragmatic Approach to Inquiry
 
How International Is You School?
How International Is You School? How International Is You School?
How International Is You School?
 
MYP: Mind The Gap [MA Assignment]
MYP: Mind The Gap [MA Assignment]MYP: Mind The Gap [MA Assignment]
MYP: Mind The Gap [MA Assignment]
 
Qr Orienteering: Map and QR Codes
Qr Orienteering: Map and QR CodesQr Orienteering: Map and QR Codes
Qr Orienteering: Map and QR Codes
 
Protein Synthesis: 3.5 Transcription & Translation (SL)
Protein Synthesis: 3.5 Transcription & Translation (SL)Protein Synthesis: 3.5 Transcription & Translation (SL)
Protein Synthesis: 3.5 Transcription & Translation (SL)
 
A3 special issues in nutrition
A3 special issues in nutritionA3 special issues in nutrition
A3 special issues in nutrition
 
Extended Essay Frame
Extended Essay FrameExtended Essay Frame
Extended Essay Frame
 
Assessment Assignment: Bath MA International Education
Assessment Assignment: Bath MA International EducationAssessment Assignment: Bath MA International Education
Assessment Assignment: Bath MA International Education
 

Similar to Chemistry Lab Manual

Ch17 lab r_verdu103: Entry level statistics exercise (descriptives)
Ch17 lab r_verdu103: Entry level statistics exercise (descriptives)Ch17 lab r_verdu103: Entry level statistics exercise (descriptives)
Ch17 lab r_verdu103: Entry level statistics exercise (descriptives)Sherri Gunder
 
Experimental design version 4.3
Experimental design version 4.3Experimental design version 4.3
Experimental design version 4.3
jschmied
 
Measurement and scaling
Measurement and scalingMeasurement and scaling
Measurement and scaling
Balaji P
 
Measurementand scaling-10
Measurementand scaling-10Measurementand scaling-10
Measurementand scaling-10
University of Balochistan
 
Chem unit 1 presentation
Chem unit 1 presentationChem unit 1 presentation
Chem unit 1 presentationbobcatchemistry
 
arStarting1.ppt
arStarting1.pptarStarting1.ppt
arStarting1.ppt
AisahHadjiracman2
 
Concept of Measurements in Business Research
Concept of Measurements in Business ResearchConcept of Measurements in Business Research
Concept of Measurements in Business Research
CS PRADHAN
 
How to write a research paper
How to write a research paperHow to write a research paper
How to write a research papertrentg109
 
M08 BiasVarianceTradeoff
M08 BiasVarianceTradeoffM08 BiasVarianceTradeoff
M08 BiasVarianceTradeoff
Raman Kannan
 
Principles of design of experiments (doe)20 5-2014
Principles of  design of experiments (doe)20 5-2014Principles of  design of experiments (doe)20 5-2014
Principles of design of experiments (doe)20 5-2014Awad Albalwi
 
Lecture 07
Lecture 07Lecture 07
Lecture 07
MEHTAB REHMAN
 
Statistics final seminar
Statistics final seminarStatistics final seminar
Statistics final seminar
Tejas Jagtap
 
Analysing & interpreting data.ppt
Analysing & interpreting data.pptAnalysing & interpreting data.ppt
Analysing & interpreting data.ppt
manaswidebbarma1
 
Introduction To Statistics
Introduction To StatisticsIntroduction To Statistics
Introduction To Statisticsalbertlaporte
 
Probability in statistics
Probability in statisticsProbability in statistics
Probability in statistics
Sukirti Garg
 
Review of "Survey Research Methods & Design in Psychology"
Review of "Survey Research Methods & Design in Psychology"Review of "Survey Research Methods & Design in Psychology"
Review of "Survey Research Methods & Design in Psychology"
James Neill
 
LENGUAGE TESTING (II Bimestre Abril Agosto 2011)
LENGUAGE TESTING (II Bimestre Abril Agosto 2011)LENGUAGE TESTING (II Bimestre Abril Agosto 2011)
LENGUAGE TESTING (II Bimestre Abril Agosto 2011)
Videoconferencias UTPL
 

Similar to Chemistry Lab Manual (20)

Ch17 lab r_verdu103: Entry level statistics exercise (descriptives)
Ch17 lab r_verdu103: Entry level statistics exercise (descriptives)Ch17 lab r_verdu103: Entry level statistics exercise (descriptives)
Ch17 lab r_verdu103: Entry level statistics exercise (descriptives)
 
Experimental design version 4.3
Experimental design version 4.3Experimental design version 4.3
Experimental design version 4.3
 
Measurement and scaling
Measurement and scalingMeasurement and scaling
Measurement and scaling
 
Measurementand scaling-10
Measurementand scaling-10Measurementand scaling-10
Measurementand scaling-10
 
Chem unit 1 presentation
Chem unit 1 presentationChem unit 1 presentation
Chem unit 1 presentation
 
arStarting1.ppt
arStarting1.pptarStarting1.ppt
arStarting1.ppt
 
Concept of Measurements in Business Research
Concept of Measurements in Business ResearchConcept of Measurements in Business Research
Concept of Measurements in Business Research
 
How to write a research paper
How to write a research paperHow to write a research paper
How to write a research paper
 
M08 BiasVarianceTradeoff
M08 BiasVarianceTradeoffM08 BiasVarianceTradeoff
M08 BiasVarianceTradeoff
 
Principles of design of experiments (doe)20 5-2014
Principles of  design of experiments (doe)20 5-2014Principles of  design of experiments (doe)20 5-2014
Principles of design of experiments (doe)20 5-2014
 
Lecture 07
Lecture 07Lecture 07
Lecture 07
 
Statistics final seminar
Statistics final seminarStatistics final seminar
Statistics final seminar
 
Analysing & interpreting data.ppt
Analysing & interpreting data.pptAnalysing & interpreting data.ppt
Analysing & interpreting data.ppt
 
Introduction To Statistics
Introduction To StatisticsIntroduction To Statistics
Introduction To Statistics
 
Probability in statistics
Probability in statisticsProbability in statistics
Probability in statistics
 
Measurement scaling
Measurement   scalingMeasurement   scaling
Measurement scaling
 
16497 mgt 252
16497 mgt 25216497 mgt 252
16497 mgt 252
 
Statistics
StatisticsStatistics
Statistics
 
Review of "Survey Research Methods & Design in Psychology"
Review of "Survey Research Methods & Design in Psychology"Review of "Survey Research Methods & Design in Psychology"
Review of "Survey Research Methods & Design in Psychology"
 
LENGUAGE TESTING (II Bimestre Abril Agosto 2011)
LENGUAGE TESTING (II Bimestre Abril Agosto 2011)LENGUAGE TESTING (II Bimestre Abril Agosto 2011)
LENGUAGE TESTING (II Bimestre Abril Agosto 2011)
 

More from Stephen Taylor

Protein synthesis Running Dictation
Protein synthesis Running DictationProtein synthesis Running Dictation
Protein synthesis Running Dictation
Stephen Taylor
 
One Direction Do Physics
One Direction Do PhysicsOne Direction Do Physics
One Direction Do Physics
Stephen Taylor
 
Measurement & Error
Measurement & ErrorMeasurement & Error
Measurement & Error
Stephen Taylor
 
Science Show 2012
Science Show 2012Science Show 2012
Science Show 2012
Stephen Taylor
 
Describing Motion 2012
Describing Motion 2012Describing Motion 2012
Describing Motion 2012
Stephen Taylor
 
Welcome to Chemistry
Welcome to ChemistryWelcome to Chemistry
Welcome to Chemistry
Stephen Taylor
 
Welcome to G10 Science!
Welcome to G10 Science! Welcome to G10 Science!
Welcome to G10 Science!
Stephen Taylor
 
Rubric for Resolving Conflicts
Rubric for Resolving ConflictsRubric for Resolving Conflicts
Rubric for Resolving Conflicts
Stephen Taylor
 
Ideas for integrating inquiry and differentiation with AOI's
Ideas for integrating inquiry and differentiation with AOI'sIdeas for integrating inquiry and differentiation with AOI's
Ideas for integrating inquiry and differentiation with AOI's
Stephen Taylor
 
One World: Scientific Solutions to Global Issues
One World: Scientific Solutions to Global IssuesOne World: Scientific Solutions to Global Issues
One World: Scientific Solutions to Global Issues
Stephen Taylor
 
Concept Cartoons in Science Class
Concept Cartoons in Science ClassConcept Cartoons in Science Class
Concept Cartoons in Science Class
Stephen Taylor
 

More from Stephen Taylor (11)

Protein synthesis Running Dictation
Protein synthesis Running DictationProtein synthesis Running Dictation
Protein synthesis Running Dictation
 
One Direction Do Physics
One Direction Do PhysicsOne Direction Do Physics
One Direction Do Physics
 
Measurement & Error
Measurement & ErrorMeasurement & Error
Measurement & Error
 
Science Show 2012
Science Show 2012Science Show 2012
Science Show 2012
 
Describing Motion 2012
Describing Motion 2012Describing Motion 2012
Describing Motion 2012
 
Welcome to Chemistry
Welcome to ChemistryWelcome to Chemistry
Welcome to Chemistry
 
Welcome to G10 Science!
Welcome to G10 Science! Welcome to G10 Science!
Welcome to G10 Science!
 
Rubric for Resolving Conflicts
Rubric for Resolving ConflictsRubric for Resolving Conflicts
Rubric for Resolving Conflicts
 
Ideas for integrating inquiry and differentiation with AOI's
Ideas for integrating inquiry and differentiation with AOI'sIdeas for integrating inquiry and differentiation with AOI's
Ideas for integrating inquiry and differentiation with AOI's
 
One World: Scientific Solutions to Global Issues
One World: Scientific Solutions to Global IssuesOne World: Scientific Solutions to Global Issues
One World: Scientific Solutions to Global Issues
 
Concept Cartoons in Science Class
Concept Cartoons in Science ClassConcept Cartoons in Science Class
Concept Cartoons in Science Class
 

Recently uploaded

The Accursed House by Émile Gaboriau.pptx
The Accursed House by Émile Gaboriau.pptxThe Accursed House by Émile Gaboriau.pptx
The Accursed House by Émile Gaboriau.pptx
DhatriParmar
 
Model Attribute Check Company Auto Property
Model Attribute  Check Company Auto PropertyModel Attribute  Check Company Auto Property
Model Attribute Check Company Auto Property
Celine George
 
Sha'Carri Richardson Presentation 202345
Sha'Carri Richardson Presentation 202345Sha'Carri Richardson Presentation 202345
Sha'Carri Richardson Presentation 202345
beazzy04
 
Biological Screening of Herbal Drugs in detailed.
Biological Screening of Herbal Drugs in detailed.Biological Screening of Herbal Drugs in detailed.
Biological Screening of Herbal Drugs in detailed.
Ashokrao Mane college of Pharmacy Peth-Vadgaon
 
The approach at University of Liverpool.pptx
The approach at University of Liverpool.pptxThe approach at University of Liverpool.pptx
The approach at University of Liverpool.pptx
Jisc
 
Overview on Edible Vaccine: Pros & Cons with Mechanism
Overview on Edible Vaccine: Pros & Cons with MechanismOverview on Edible Vaccine: Pros & Cons with Mechanism
Overview on Edible Vaccine: Pros & Cons with Mechanism
DeeptiGupta154
 
Phrasal Verbs.XXXXXXXXXXXXXXXXXXXXXXXXXX
Phrasal Verbs.XXXXXXXXXXXXXXXXXXXXXXXXXXPhrasal Verbs.XXXXXXXXXXXXXXXXXXXXXXXXXX
Phrasal Verbs.XXXXXXXXXXXXXXXXXXXXXXXXXX
MIRIAMSALINAS13
 
Palestine last event orientationfvgnh .pptx
Palestine last event orientationfvgnh .pptxPalestine last event orientationfvgnh .pptx
Palestine last event orientationfvgnh .pptx
RaedMohamed3
 
Polish students' mobility in the Czech Republic
Polish students' mobility in the Czech RepublicPolish students' mobility in the Czech Republic
Polish students' mobility in the Czech Republic
Anna Sz.
 
Adversarial Attention Modeling for Multi-dimensional Emotion Regression.pdf
Adversarial Attention Modeling for Multi-dimensional Emotion Regression.pdfAdversarial Attention Modeling for Multi-dimensional Emotion Regression.pdf
Adversarial Attention Modeling for Multi-dimensional Emotion Regression.pdf
Po-Chuan Chen
 
Home assignment II on Spectroscopy 2024 Answers.pdf
Home assignment II on Spectroscopy 2024 Answers.pdfHome assignment II on Spectroscopy 2024 Answers.pdf
Home assignment II on Spectroscopy 2024 Answers.pdf
Tamralipta Mahavidyalaya
 
A Strategic Approach: GenAI in Education
A Strategic Approach: GenAI in EducationA Strategic Approach: GenAI in Education
A Strategic Approach: GenAI in Education
Peter Windle
 
Unit 2- Research Aptitude (UGC NET Paper I).pdf
Unit 2- Research Aptitude (UGC NET Paper I).pdfUnit 2- Research Aptitude (UGC NET Paper I).pdf
Unit 2- Research Aptitude (UGC NET Paper I).pdf
Thiyagu K
 
CLASS 11 CBSE B.St Project AIDS TO TRADE - INSURANCE
CLASS 11 CBSE B.St Project AIDS TO TRADE - INSURANCECLASS 11 CBSE B.St Project AIDS TO TRADE - INSURANCE
CLASS 11 CBSE B.St Project AIDS TO TRADE - INSURANCE
BhavyaRajput3
 
2024.06.01 Introducing a competency framework for languag learning materials ...
2024.06.01 Introducing a competency framework for languag learning materials ...2024.06.01 Introducing a competency framework for languag learning materials ...
2024.06.01 Introducing a competency framework for languag learning materials ...
Sandy Millin
 
678020731-Sumas-y-Restas-Para-Colorear.pdf
678020731-Sumas-y-Restas-Para-Colorear.pdf678020731-Sumas-y-Restas-Para-Colorear.pdf
678020731-Sumas-y-Restas-Para-Colorear.pdf
CarlosHernanMontoyab2
 
Thesis Statement for students diagnonsed withADHD.ppt
Thesis Statement for students diagnonsed withADHD.pptThesis Statement for students diagnonsed withADHD.ppt
Thesis Statement for students diagnonsed withADHD.ppt
EverAndrsGuerraGuerr
 
The French Revolution Class 9 Study Material pdf free download
The French Revolution Class 9 Study Material pdf free downloadThe French Revolution Class 9 Study Material pdf free download
The French Revolution Class 9 Study Material pdf free download
Vivekanand Anglo Vedic Academy
 
June 3, 2024 Anti-Semitism Letter Sent to MIT President Kornbluth and MIT Cor...
June 3, 2024 Anti-Semitism Letter Sent to MIT President Kornbluth and MIT Cor...June 3, 2024 Anti-Semitism Letter Sent to MIT President Kornbluth and MIT Cor...
June 3, 2024 Anti-Semitism Letter Sent to MIT President Kornbluth and MIT Cor...
Levi Shapiro
 
Synthetic Fiber Construction in lab .pptx
Synthetic Fiber Construction in lab .pptxSynthetic Fiber Construction in lab .pptx
Synthetic Fiber Construction in lab .pptx
Pavel ( NSTU)
 

Recently uploaded (20)

The Accursed House by Émile Gaboriau.pptx
The Accursed House by Émile Gaboriau.pptxThe Accursed House by Émile Gaboriau.pptx
The Accursed House by Émile Gaboriau.pptx
 
Model Attribute Check Company Auto Property
Model Attribute  Check Company Auto PropertyModel Attribute  Check Company Auto Property
Model Attribute Check Company Auto Property
 
Sha'Carri Richardson Presentation 202345
Sha'Carri Richardson Presentation 202345Sha'Carri Richardson Presentation 202345
Sha'Carri Richardson Presentation 202345
 
Biological Screening of Herbal Drugs in detailed.
Biological Screening of Herbal Drugs in detailed.Biological Screening of Herbal Drugs in detailed.
Biological Screening of Herbal Drugs in detailed.
 
The approach at University of Liverpool.pptx
The approach at University of Liverpool.pptxThe approach at University of Liverpool.pptx
The approach at University of Liverpool.pptx
 
Overview on Edible Vaccine: Pros & Cons with Mechanism
Overview on Edible Vaccine: Pros & Cons with MechanismOverview on Edible Vaccine: Pros & Cons with Mechanism
Overview on Edible Vaccine: Pros & Cons with Mechanism
 
Phrasal Verbs.XXXXXXXXXXXXXXXXXXXXXXXXXX
Phrasal Verbs.XXXXXXXXXXXXXXXXXXXXXXXXXXPhrasal Verbs.XXXXXXXXXXXXXXXXXXXXXXXXXX
Phrasal Verbs.XXXXXXXXXXXXXXXXXXXXXXXXXX
 
Palestine last event orientationfvgnh .pptx
Palestine last event orientationfvgnh .pptxPalestine last event orientationfvgnh .pptx
Palestine last event orientationfvgnh .pptx
 
Polish students' mobility in the Czech Republic
Polish students' mobility in the Czech RepublicPolish students' mobility in the Czech Republic
Polish students' mobility in the Czech Republic
 
Adversarial Attention Modeling for Multi-dimensional Emotion Regression.pdf
Adversarial Attention Modeling for Multi-dimensional Emotion Regression.pdfAdversarial Attention Modeling for Multi-dimensional Emotion Regression.pdf
Adversarial Attention Modeling for Multi-dimensional Emotion Regression.pdf
 
Home assignment II on Spectroscopy 2024 Answers.pdf
Home assignment II on Spectroscopy 2024 Answers.pdfHome assignment II on Spectroscopy 2024 Answers.pdf
Home assignment II on Spectroscopy 2024 Answers.pdf
 
A Strategic Approach: GenAI in Education
A Strategic Approach: GenAI in EducationA Strategic Approach: GenAI in Education
A Strategic Approach: GenAI in Education
 
Unit 2- Research Aptitude (UGC NET Paper I).pdf
Unit 2- Research Aptitude (UGC NET Paper I).pdfUnit 2- Research Aptitude (UGC NET Paper I).pdf
Unit 2- Research Aptitude (UGC NET Paper I).pdf
 
CLASS 11 CBSE B.St Project AIDS TO TRADE - INSURANCE
CLASS 11 CBSE B.St Project AIDS TO TRADE - INSURANCECLASS 11 CBSE B.St Project AIDS TO TRADE - INSURANCE
CLASS 11 CBSE B.St Project AIDS TO TRADE - INSURANCE
 
2024.06.01 Introducing a competency framework for languag learning materials ...
2024.06.01 Introducing a competency framework for languag learning materials ...2024.06.01 Introducing a competency framework for languag learning materials ...
2024.06.01 Introducing a competency framework for languag learning materials ...
 
678020731-Sumas-y-Restas-Para-Colorear.pdf
678020731-Sumas-y-Restas-Para-Colorear.pdf678020731-Sumas-y-Restas-Para-Colorear.pdf
678020731-Sumas-y-Restas-Para-Colorear.pdf
 
Thesis Statement for students diagnonsed withADHD.ppt
Thesis Statement for students diagnonsed withADHD.pptThesis Statement for students diagnonsed withADHD.ppt
Thesis Statement for students diagnonsed withADHD.ppt
 
The French Revolution Class 9 Study Material pdf free download
The French Revolution Class 9 Study Material pdf free downloadThe French Revolution Class 9 Study Material pdf free download
The French Revolution Class 9 Study Material pdf free download
 
June 3, 2024 Anti-Semitism Letter Sent to MIT President Kornbluth and MIT Cor...
June 3, 2024 Anti-Semitism Letter Sent to MIT President Kornbluth and MIT Cor...June 3, 2024 Anti-Semitism Letter Sent to MIT President Kornbluth and MIT Cor...
June 3, 2024 Anti-Semitism Letter Sent to MIT President Kornbluth and MIT Cor...
 
Synthetic Fiber Construction in lab .pptx
Synthetic Fiber Construction in lab .pptxSynthetic Fiber Construction in lab .pptx
Synthetic Fiber Construction in lab .pptx
 

Chemistry Lab Manual

  • 1. Chemistry Lab ManualName: _____________ Introduction to working as a Chemist. Use a highlighter as you work through this booklet. ESL students, make vocab lists of the terminology that is defined or described here. Assessment Statements  Outline the Scientific Method  State SI units of measurement for  Identify independent, dependent & controlled  Mass: grams (g) variables.  Length: Metres (m), millimeters (mm)  Demonstrate correct and safe use of laboratory  Concentration: molarity (M) o equipment.  Temperature: Degrees Celsius ( C)  Distinguish between quantitative and qualitative  Volume: Litres (L) or millitres (mL) data  Density: grams per cubic centimeter 3  Qualitative is descriptive, not using (g/cm ) numbers, e.g. properties, colour, gas  Conductivity: Siemens (S) production, sound, odor.  Acidity or alkalinity (pH)  Quantitative is mathematical, including  Energy: Joules (J or kJ)Determine the  Raw data (as recorded ) uncertainty of digital and analog measuring tools  Processed (after calculations)  Usually ± 1 of the smallest division  Distinguish between accuracy and precision  Calculate the % error of a given or recorded set  Accuracy describes the correctness of a of values set of measurements  ((Measured – True) / True) x 100  Precision describes the repeatability of a  State values to appropriate numbers of set of measurements significant figures  Calculate values to appropriate numbers of significant figures Related Concepts:  01.1 Element symbols (Quia quiz: http://www.quia.com/quiz/3246640.html)  01.2 Accuracy, Precision, Error, Uncertainty (Quia quiz: http://www.quia.com/quiz/3507626.html)  01.3 SigDigs and Notation (Quia quiz: http://www.quia.com/quiz/3504378.html) Command Terms: Be sure you understand what is being asked of you Analyse Break down to identify key parts. Interpret information to reach conclusions. Apply Use knowledge & understanding in response to a real situation or given circumstances. Calculate Obtain a numerical answer, showing relevant stages in the working. Define Give the precise meaning of a word, phrase, concept or physical quantity. Describe Give a detailed account or picture of an event, pattern, process or pattern. Design Produce a plan, simulation or model. Determine Obtain the only possible answer. Discuss Offer a considered and balanced review that includes a range of arguments, factors or hypotheses. Opinions or conclusions should be presented clearly and supported by appropriate evidence. Distinguish Make clear the differences between two or more concepts or items. Evaluate Assess the implications and limitations; make judgments about the ideas, works, solutions or ideas in relation to selected criteria. Explain Give a detailed account including reasons or causes. Identify Provide an answers from a number of possibilities. Recognise and state briefly a distinguishing fact or feature. Label Add title, labels or brief explanation(s) to a diagram or graph. List Give a sequence of answers with no explanation. Outline Give a brief account. Recall Remember or recognize from prior learning experiences. State Give a specific name, value or other brief answer without explanation or calculation. Suggest Propose a solution, hypothesis or other possible answer. 1
  • 2. Use Apply knowledge or rules to put theory into practice. 2
  • 3. AssessmentSubmit for checking once complete. Ask for help when needed. Criterion F: Attitudes in Science(Highlight the statements that best fit your effort) Level Level descriptor 0 The student does not reach a standard described by any of the descriptors below. 1–2 The student requires some guidance to work safely and some assistance when using material and equipment. The student requires some guidance to work responsibly with regards to the living and non-living environment. When working as part of a group, the student needs frequent reminders to cooperate with others. 3–4 The student requires little guidance to work safely and little assistance when using material and equipment. The student works responsibly with regards to the living and non-living environment. When working as part of a group the student cooperates with others on most occasions. 5–6 The student requires no guidance to work safely and uses material and equipment competently. The student works responsibly with regards to the living and non-living environment. When working as part of a group, the student cooperates with others. Expectations:  Your working area and personal space are kept clean and neat at all times.  You work safely with regard to chemicals, equipment and others.  You are sensible and precise in your use of science equipment and materials.  All equipment is properly cleaned and returned to the proper place.  You show cooperation and respect for others in your group work. Comments: Criterion E: Processing Data (Formative) (Highlight the statements that best fit your effort) Level Level descriptor 0 The student does not reach a standard described by any of the descriptors below. 1–2 The student collects some data and attempts to record it in a suitable format. The student organizes and presents data using simple numerical or visual forms. The student attempts to identify a trend, pattern or relationship in the data. The student attempts to draw a conclusion but this is not consistent with the interpretation of the data. 3–4 The student collects sufficient relevant data and records it in a suitable format. The student organizes, transforms and presents data in numerical and/or visual forms, with a few errors or omissions. The student states a trend, pattern or relationship shown in the data. The student draws a conclusion consistent with the interpretation of the data. 5–6 The student collects sufficient relevant data and records it in a suitable format. The student organizes, transforms and presents data in numerical and/or visual forms logically and correctly. The student describes a trend, pattern or relationship in the data and comments on the reliability of the data. The student draws a clear conclusion based on the correct interpretation of the data and explains it using scientific reasoning. Comments: 3
  • 4. The Scientific Method Science is never about proving something right or wrong. It is about making observations, forming hypotheses and developing methods to test those hypotheses. If the data support our hypothesis, we can try to explain why. If not, we develop a new hypothesis and a new method to test that. Use the correct language! A FACT is something that is observable and true. It is a fact that the Sun shines. It is a fact that reacting HCl and Mg produces a gas. A LAW is something that always happens in defined conditions, following “if.. then…” rules. The Law of Conservation of Mass states that atoms (matter) can neither be created nor destroyed. If a reaction occurs, then all the atoms involved as reactants must be accounted for in the products. The Law of Diffusion states that molecules in fluids (liquid, solution or gas) will diffuse from areas of high concentration to areas of low concentration. If the concentration gradient is high, the rate of diffusion will be faster. A HYPOTHESIS is a scientific prediction that is testable and can be explained with a reason. A NULL Hypothesis is the standard against which we compare the outcome.  “There is no significant difference/ effect of... on…” The ALTERNATE Hypothesis is your prediction:  It makes clear the independent and dependent variables  Independent Variable (IV): The variable that is being changed - Usually requires at least five increments (different values) - Usually plotted as the x-axis on a graph  Dependent Variable (DV): The variable that is being measure in response to the IV - Usually plotted as the y-axis on a graph It predicts how incremental changes in the independent variable could affect the magnitude of the dependent variable. It can be testable under Controlled Conditions  Controlled Variables: all the factors that might impact the outcome of the investigation must be kept at the same value to ensure the results are reliable. HYPOTHESIS TESTING Good scientists design reliable experiments to test the validity of the hypothesis  RELIABILITY:  Is the method easily repeated? Is it free of random and systematic error?  Are the results reliable? This is indicated by the variability of the data.  VALIDITY:  To what extent does the method allow the RQ to be addressed?  To what extent is do the results support the hypothesis? A THEORY is the highest level of certainty in science. It is supported by lots of empirical evidence. It has been tested over and over again and can be explained scientifically. It has not been disproven… yet. Atomic theory states that all matter is composed of atoms, made up of a nucleus containing protons and neutrons, outside which is a cloud of electrons. Kinetic theory of gases state that particles (atoms and molecules) in gases are moving randomly, colliding with each other. They move more rapidly at high temperature. Cell theory states that all living things are made of cells; cells are the smallest units of life; cells come only from other cells. 4
  • 5. What is/areDATA? “Not everything that can be counted counts. Not everything that counts can be counted.” Albert Einstein. QUANTITATIVE DATA (EMPIRICAL DATA) Can be measured and compared using numbers Can be continuous or non-continuous.  Continuous: on a scale, such as time, temperature, concentration  Non-continuous: not scaled, such as categories, groups. Includes the values of the increments of the IV Includes raw and processed data of the DV  Raw data includes all numbers recorded during the experiment.  Processing shows how transformations work with the data: calculations  Processed data are the the final results, after calculations  Presented data are the tables and graphs that are produced QUALITATIVE DATA (OBSERVATIONAL DATA) Descriptive, not numerical Provides important insights that might help explanations Both types of data are essential in lab reports. ……….o0O0o……….. There’s no such word as ‘amount’! What do you really mean when you say “amount”? Matter is anything that has mass and volume(takes up space): We measure mass in kilograms (kg), or grams (g). We measure volume in litres (L) or millilitres (mL) (sometimes cm3). We also describe other quantities: Time in seconds (s) Length or distance in metres (m) Energy in joules (J) or kilojoules (kJ) Heat/temperature in degrees Celcius (oC) (the SI* unit is Kelvin, K) Quantity of a substance in moles (mol) Concentration of a solution in moles per litre (M) Acidity or alkalinity in pH (0 is a strong acid, 7 is neutral, 14 a strong base) Electrical conductivity of a solutionin Siemens (S) *Standard International (SI)units are based on the metric system – numbers that divide easily into tens and hundreds. Most countries in the world use these units and it makes calculations more straightforward. In this activity, we’ll learn how to measure some of these physical quantities using the appropriate tools in the lab. Complete this lab manual as you go along – you will use it as a tool throughout the course. 5
  • 6. Safety First We must be safe in the lab at all times. Check that you can find these:  Goggles What should you do if there is an accident in the lab?  Fire blanket   Fire extinguisher  Phone Do not try to clean up broken glass – MrT will do it. Safe Bunsen ‘driving license’  How do you turn on the Bunsen? …………………………………………………………………………………………………… ……………………………………………………………………………………………………  What is the ‘safety flame’? ………………………………………………………………………………………………… …………………………………………………………………………………………………  What is the ‘roaring flame’ and which part is the hottest? ………………………………………………………………………………………………… ………………………………………………………………………………………………… NEVER point a hot container towards yourself or others. ALWAYS be careful in the Chemistry Lab! Visual guide to Chemistry Lab equipment As you work through the tasks, draw some simple diagrams of the lab equipment to help you remember the names. Beaker Conical flask Test tube Tripod & Gauze mat Test tube tongs Wash bottle Pasteur (dropping) pipette Filter funnel Spatula 6
  • 7. Units and Uncertainty (Quia quiz: http://www.quia.com/quiz/3507626.html) All measurements have uncertainties – a range of values in which the true measurement could lie. More precise measuring tools have a smaller degree of uncertainty. Significant Digits (or Significant Figures) Tutorial:http://is.gd/sigfigs We use significant digits to communicate how precise a measurement is – how certain we are in our measurement. In the example above, there are 4 significant digits. Significant digits are: All non-zero digits (and all the zeroes in-between non-zeroes!) Any digits after a decimal point But they are NOT: Leading zeroes, e.g. 0.000345 has only 3 sigdigs: 345 Trailing zeroes with no decimal, e.g. 10,000 has only 1 sigdig (we can’t tell if it is exactly 10,000 or a number that is close and has been rounded). How many significant digits in these numbers? Write these numbers to 3 sigdigs:  123.45 _________ sig digits  12420 = _______________  123000 _________ sig digits  1.008 _________ sig digits  0.03209 = _______________  01.67 _________ sig digits  4050.0 = _______________  1000 _________ sig digits  1000.0 _________ sig digits  0.0101010 = ______________ Calculating Significant Digits We can only report values to the minimum degree of certainty, so: When adding or subtracting, use the number of decimal places of the weakest value. When multiplying or dividing, use the number of sigdigs of the weakest value. 1. 2.01 - 1.0 = 5. 3.44–4.0 = 2. 123 + 456.789 = 6. 1.23 + 45.6 = 3. 1.2 x 3.45 = 7. 0.66 x 1.34 = 4. 34.678 /3.33 = 8. 1.34 / 0.66 = 7
  • 8. Accuracy, Precision & Errors (Quia quiz: http://www.quia.com/quiz/3507626.html) There is always an element of error in our measurements. The accuracy of a measurement is how close it lies to the true value (“correct answer”). The precision of a measurement is how repeatable that measurement is. Identify which of the dartboards shows (Circle): 1. High precision and high accuracy? Top - Middle - Bottom 2. Low precision and low accuracy? Top - Middle - Bottom 3. High precision but low accuracy? Top - Middle - Bottom Systematic error is an error that is the same for all measurements and can be adjusted. For example, a digital balance that is poorly calibrated might measure 0.5g too much each time. Random error is not consistent between measurements and cannot be adjusted. For example, errors introduced by using different recording tools or people. Identify which of the dartboards shows: 4. Random error: Top - Middle – Bottom 5. Systematic error: Top - Middle - Bottom Dartboard diagrams from http://preparatorychemistry.com/Bishop_Book_1_eBook.pdf Scientific Notation (Quia quiz: http://www.quia.com/quiz/3504378.html) Often we produce measurements or readings with a large number of zeroes. We use scientific notation to present these numbers in a clear, standard format. Simple rules:  There is alwaysone digit before the decimal  It always ends x 10x(“times ten to the power of x”)  Significant digits are important. The examples below have 3sigdigs (1.23)  The value of x tells us how many places the decimal has been moved.  If you are making a large number small, x is positive.  If you are making a small number (less than zero) larger, X is negative. e.g. 1230000000000 can be written as 1.23 x 10¹² The decimal has moved 12 places to the left. e.g. 0.000000000123 can be written as 1.23 x 10⁻¹⁰ The decimal has moved 10 places to the right. Expand the following notations: 1.0 X 103= ______________________ 4.56 X 105= _____________________________ 1.0 X 10-6= ______________________ 7.01 X 10-4= _____________________________ 8
  • 9. Statethe following in scientific notation to 3 significant digits: • 12340000 = _____________________________ • 00012340 = _____________________________ • 10101010 = _____________________________ Compare the following measurements: 3.04 x 10⁴ kJ 3.040 x 10⁴ kJ 3.0400 x 10⁴ kJ What is a Solution? A solution is a homogenous* mixture of a substance in a liquid. The solvent is the liquid, e.g. water or alcohol, which dissolves the… Solute, which is the solid, e.g. salt or sugar.  Label the solventand the solute in the beaker to the right. -----------> *mixtures can be: Homogenous = evenly distributed, like solutions Heterogeneous = unevenly distributed, like soup, oceans, mixtures of solids. Beaker from: http://www.wpclipart.com/science/beaker/beaker.png.html Concentration of a Solution A more concentrated solution contains more molecules per unit volume. We measure the concentration of a solution by the number of moles of solute it contains per litre. This is called molarity, and uses the unit ‘M’. A 1M solution contains 1mole of solute per litre. One ‘mole’ of a substance is 6.02 x 10²³ units (atoms or molecules). So a 1M solution of sugar has 6.02 x 10²³ molecules of sugar per litre. Expand the notation above. 9
  • 10. Measuring Volume We use graduated cylinders to measure volumes of a liquid. We do not use beakers or conical flasks – the marks on those are estimates only. Label the meniscus on the diagram to the right. This is where we measure fluids. Put the cylinder on the table and move your eyes to read it. Observe these different-sized measuring cylinders. Complete the table. Size Markings every… Recorded volume (ml) Uncertainty (± ) 10mL 50mL 100mL Identify which cylinder has: 1. The most precise gradations (markings): _______ mL 2. The biggest uncertainty: _______ mL Add up the total volume of water in the four cylinders. Present your working and give the answer to the most appropriate significant digits. Explain your answer. ………………………………………………………………………………………………………………………………………….. ………………………………………………………………………………………………………………………………………….. ………………………………………………………………………………………………………………………………………….. ………………………………………………………………………………………………………………………………………….. Measuring Mass We use digital balances to measure the mass of a substance.  Check the range of the balance – do not press on it or add a mass that is heavier than the maximum. You will break it.  Use a measuring tray or paper on top of the stage. “Tare” (“zero”) it if you need to.  Never stack balances, push hard on the tray or drop them.  Never get the balance wet or dirty. Choose one known mass and measure it using three different balances. Complete the table. Balance Range (g) Recorded mass (g) Uncertainty (± ) What is this balance good for? A B C 10
  • 11. Measuring Temperature Compare the glass thermometer with the temperature probe on the data logger. Remember: Thermometers and dataloggers are NOT for stirring!  Measure the temperature of the solution/ liquid – NOT the container  Don’t touch the thermometer or probe against the glass  Wait for the temperature to stabilize before taking the reading Which would you choose to get Glass thermometer oC (± ) quick readings of a reaction that changes temperature? Temperature probe oC (± ) Measuring pH We use pH probes on the datalogger to measure the acidity or alkalinity of a solution. Strong acids have low pH, neutral pH is 7 and strong bases have high pH. Measuring Conductivity In some solutions, ions form. These are positive ions (cations +) or negative ions (anions -). When these ions move, they carry electrical charge, which can be detected with the conductivity probe. A high concentration of ions will give a high conductivity. pH scale from:http://www.ec.gc.ca/acidrain/kids.html Take care of the probes:  Make sure the electrolyte bottle is secure when not being used.  Rinse gently with distilled water between every reading.  Do not stir or shake the probe. Taking readings:  Submerge the probe and wait for the reading to stabilize  Record the pH to an appropriate level of precision Record the pHand conductivityof these three solutions: Solution A B C pH (± ) conductivity μS (± ) This symbol means ‘micro’ or one-thousandth. 1 μS = 0.001 S (Siemens is the unit of conductivity) Probes must be calibrated regularly to make sure they are accurate (to avoid systematic error). 11
  • 12. Matter, Elements & The Periodic Table Draw a helium atom: Matter is anything that has mass and volume (takes up space). All matter is made of atoms, which contain: Protons & neutrons in a central ‘nucleus’ A cloud of electrons The number of protons is the atomic number and defines the element. An element is a substance that is made up only of atoms that contain the same number of electrons. The periodic table arranges elements based on atomic number, as well as into groups with similar chemical and atomic properties. It is very helpful to know the names of the most common elements, so that you can recognize them from formulas and use them more quickly in your work. We will remember these elements, and complete some quizzes to help us do so. Try this quiz, which changes each time: http://www.quia.com/quiz/3246640.html Some rules: The first letter of the element symbol is always CAPITALISED, but any other letters must be lower-case Only capitalize the first letter of the name when it starts a sentence. Do not use capitals otherwise. e.g. the first element is hydrogen Symbol Name Symbol Name Symbol Name H hydrogen Cl Sn He helium Ar I Li lithium K Xe Be beryllium Ca Cs B boron Cr Ba C carbon Mn Pt N nitrogen Fe Au O oxygen Co Hg F fluorine Ni Pb Ne neon Cu At Na sodium Zn Rn radon Mg magnesium Br Fr francium Al aluminium Kr Ra radium Si silicon Rb U uranium P phosphorous Sr Pu plutonium S sulphur Ag Compounds are formed when two or more elements are combined chemically. Mixtures are made up of two or more substances that are not combined chemically. Each substance keeps its own properties. Mixtures can be separated: Filtration separates differently-sized solid particles, or solids from liquids/ solutions. Evaporation separates a solute from a solvent in a solution. Distillation (evaporation and condensation) separates liquids based on their boiling point. 12
  • 13. 13