![IB Environmental Systems and Societies p. 3
Topic 2: Ecosystems and Ecology (25 hours)
2.5.4 Measurements should
be repeated to increase
reliability of data. The
number of repetitions
required depends on the
factor being measured.
Using the targets below as a metaphor for experimental data, use the terms
valid/invalid and reliable/not reliable to describe each set of “data”. [hint: valid
is how close the data comes to the true value (also called accuracy) and reliable
is how repeatable each data point is (also called precision)]
2.5.5 Methods for
estimating the biomass and
energy of trophic levels in a
community include
measurement of dry mass,
controlled combustion and
extrapolation from samples.
Data from these methods
can be used to construct
ecological pyramids.
Explain the reason behind the inverted biomass pyramid from the English
Channel.
Original Source: International School of Prague
https://sites.google.com/site/environmentalsystemssocieties/home
Modified by Brad Kremer, May 2017](https://image.slidesharecdn.com/2-170608085259/85/2-5-investigating-ecosystems-notes-3-320.jpg)

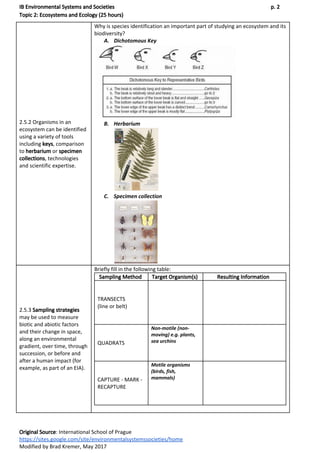
The document discusses methods for investigating ecosystems, including naming and locating the ecosystem, identifying organisms using keys and collections, using sampling strategies to measure biotic and abiotic factors over time and space, and estimating biomass and populations of organisms. It also covers calculating species richness, diversity, and evenness to compare ecosystems.