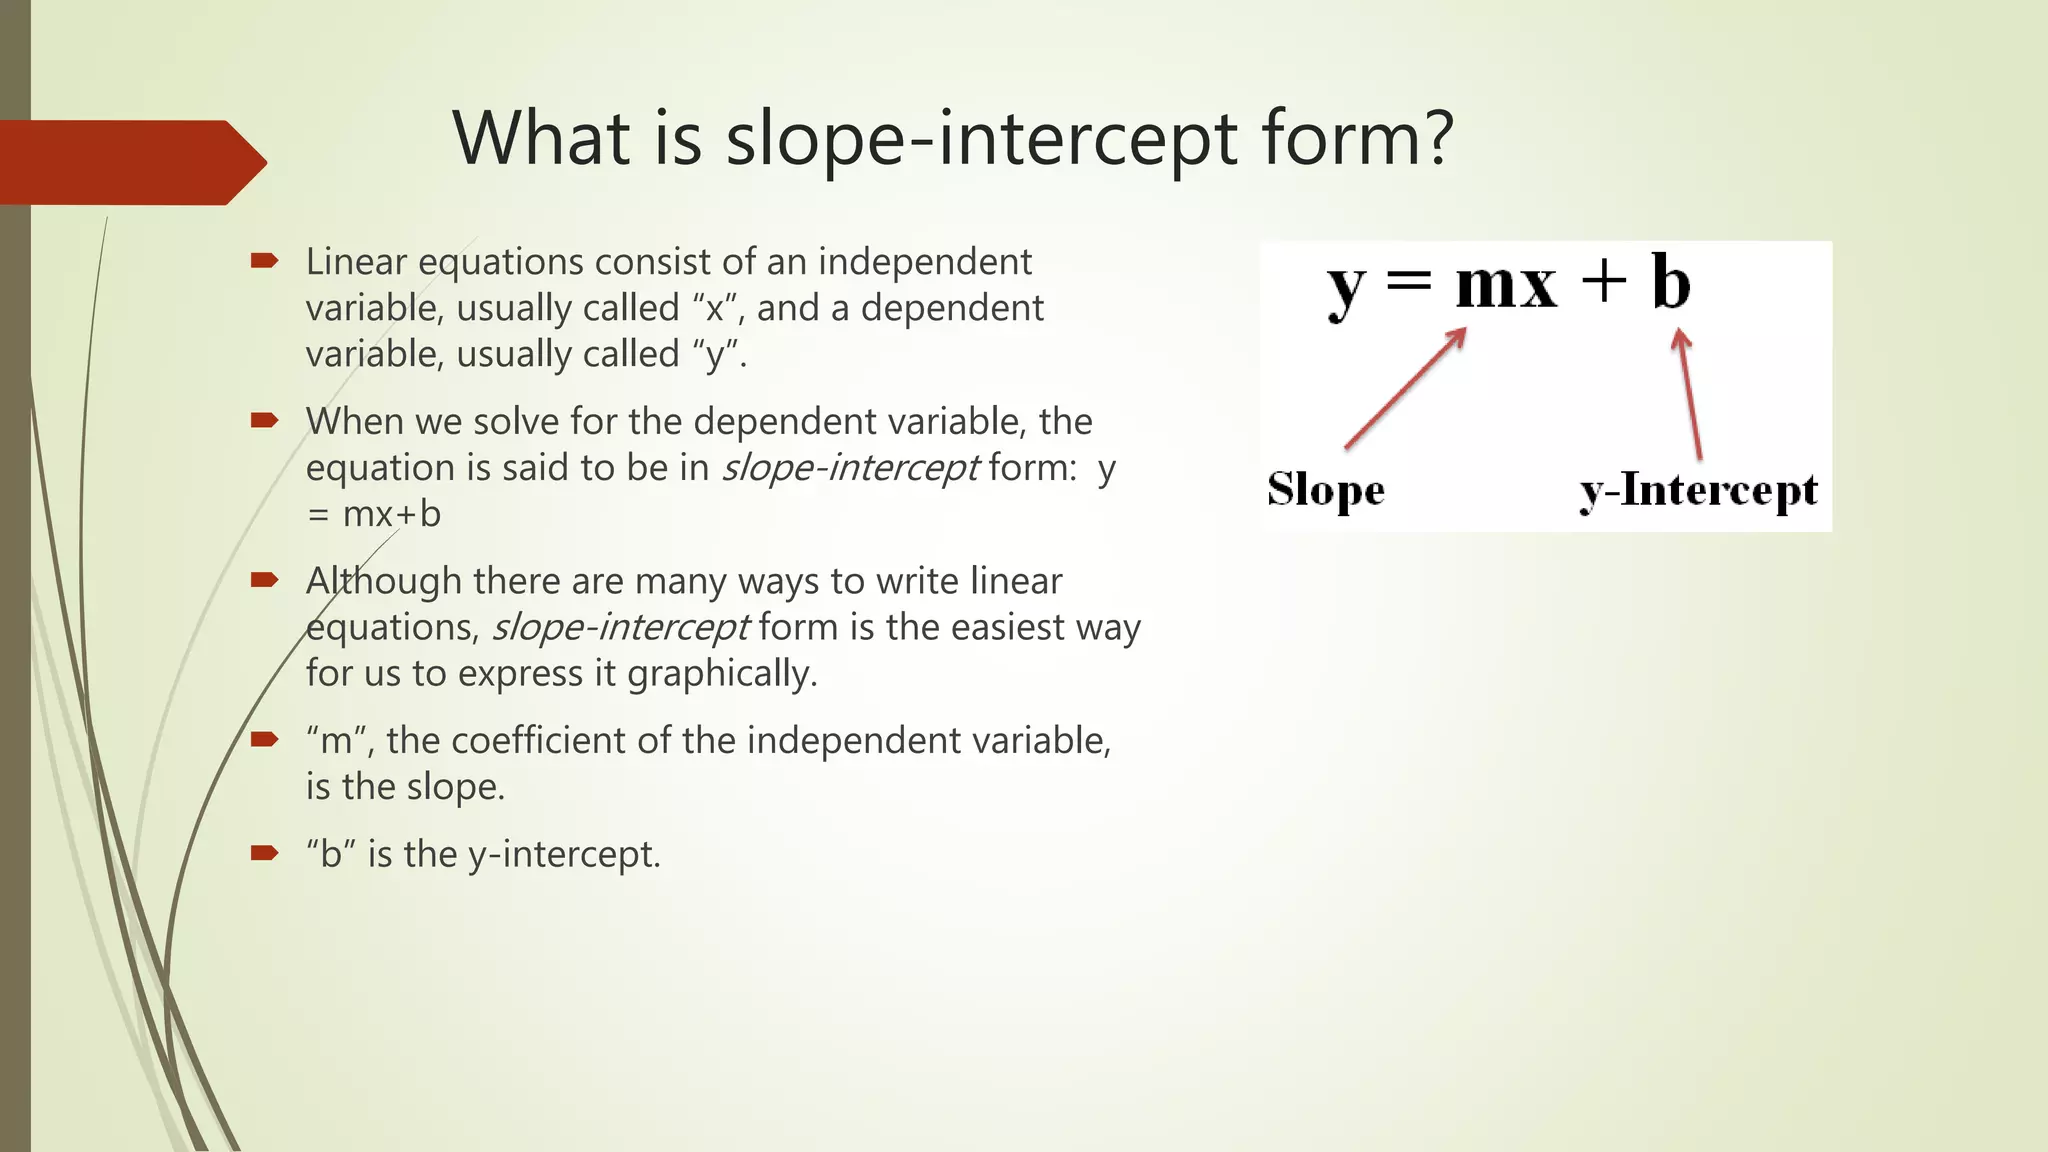
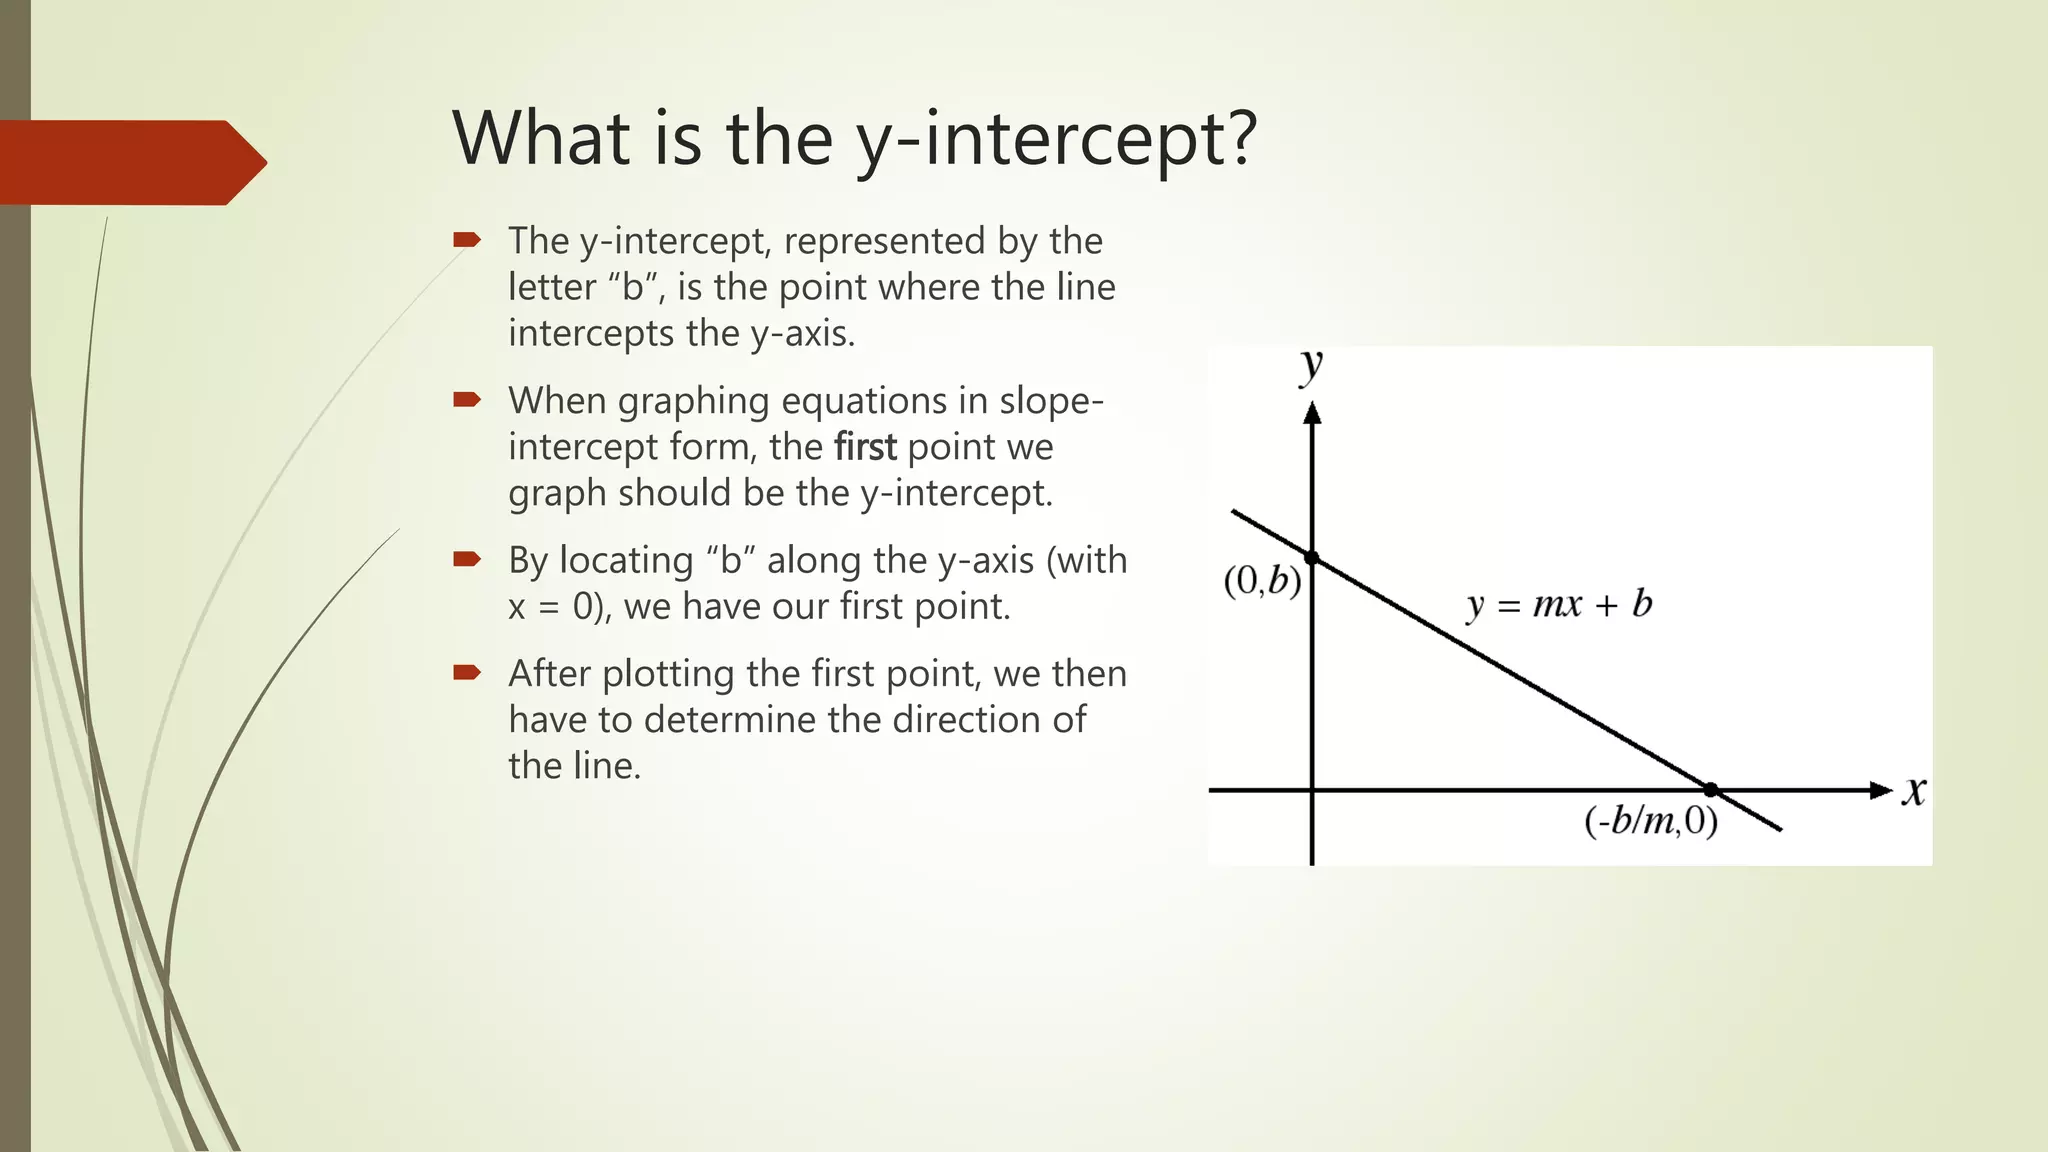
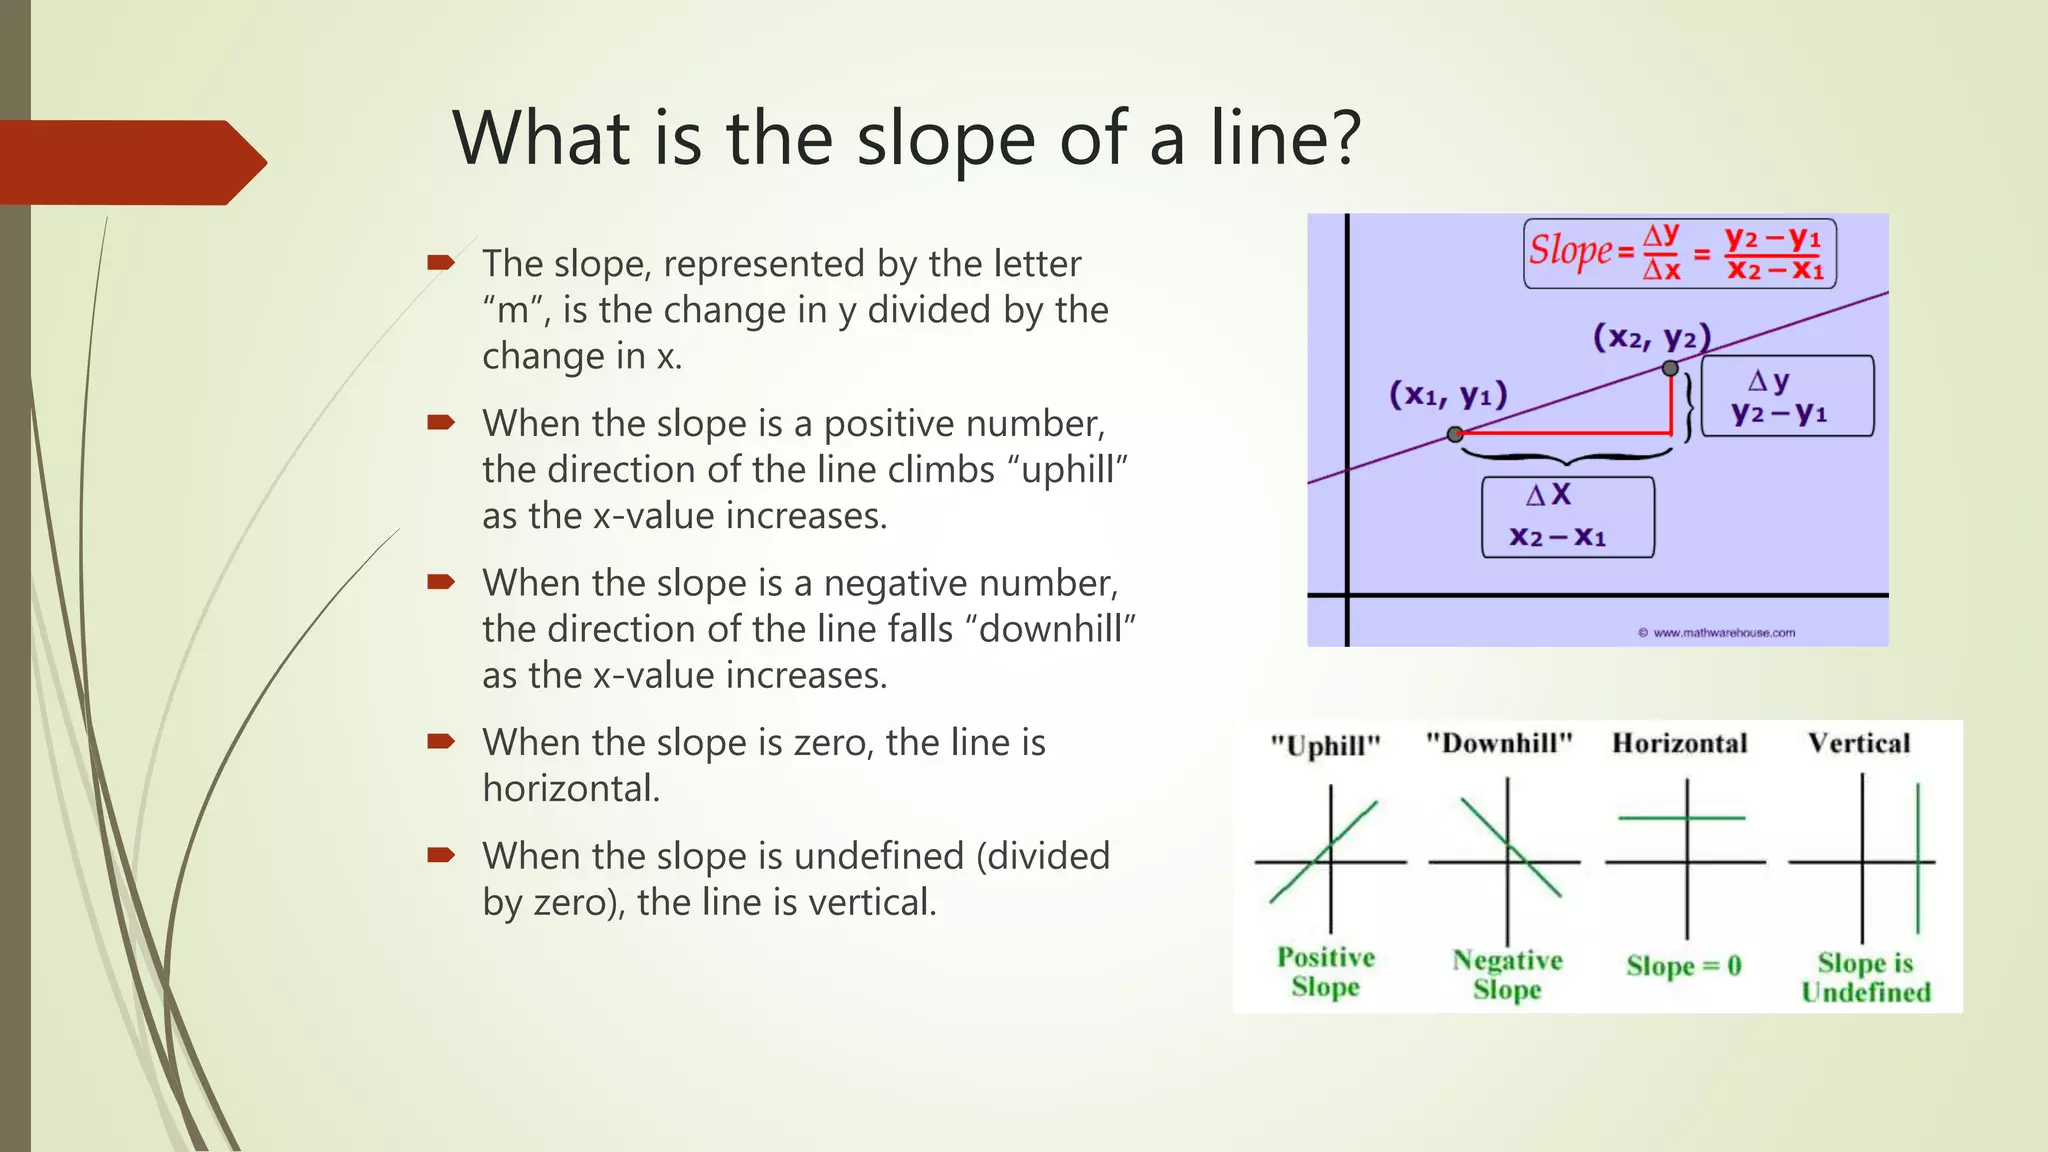
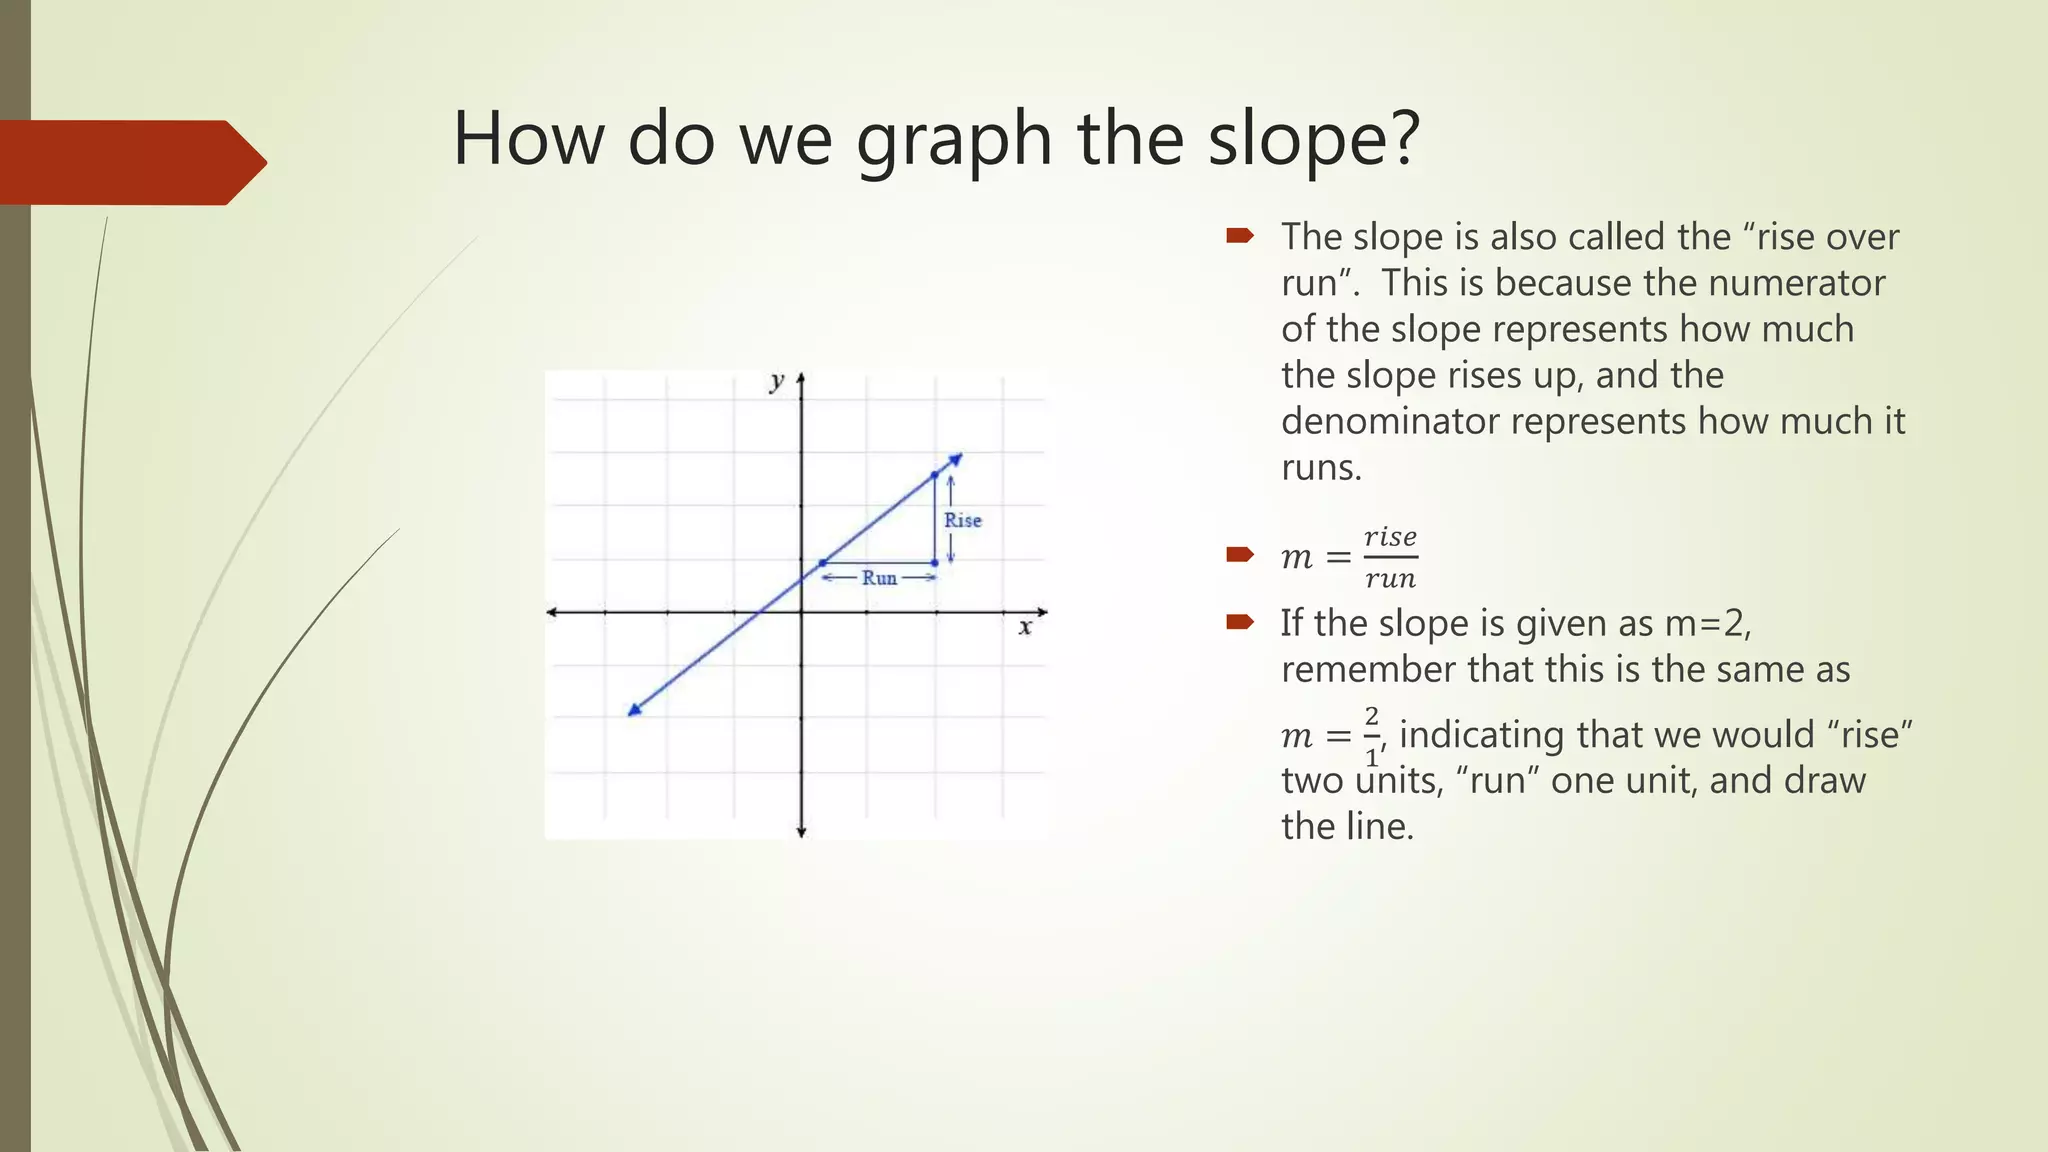
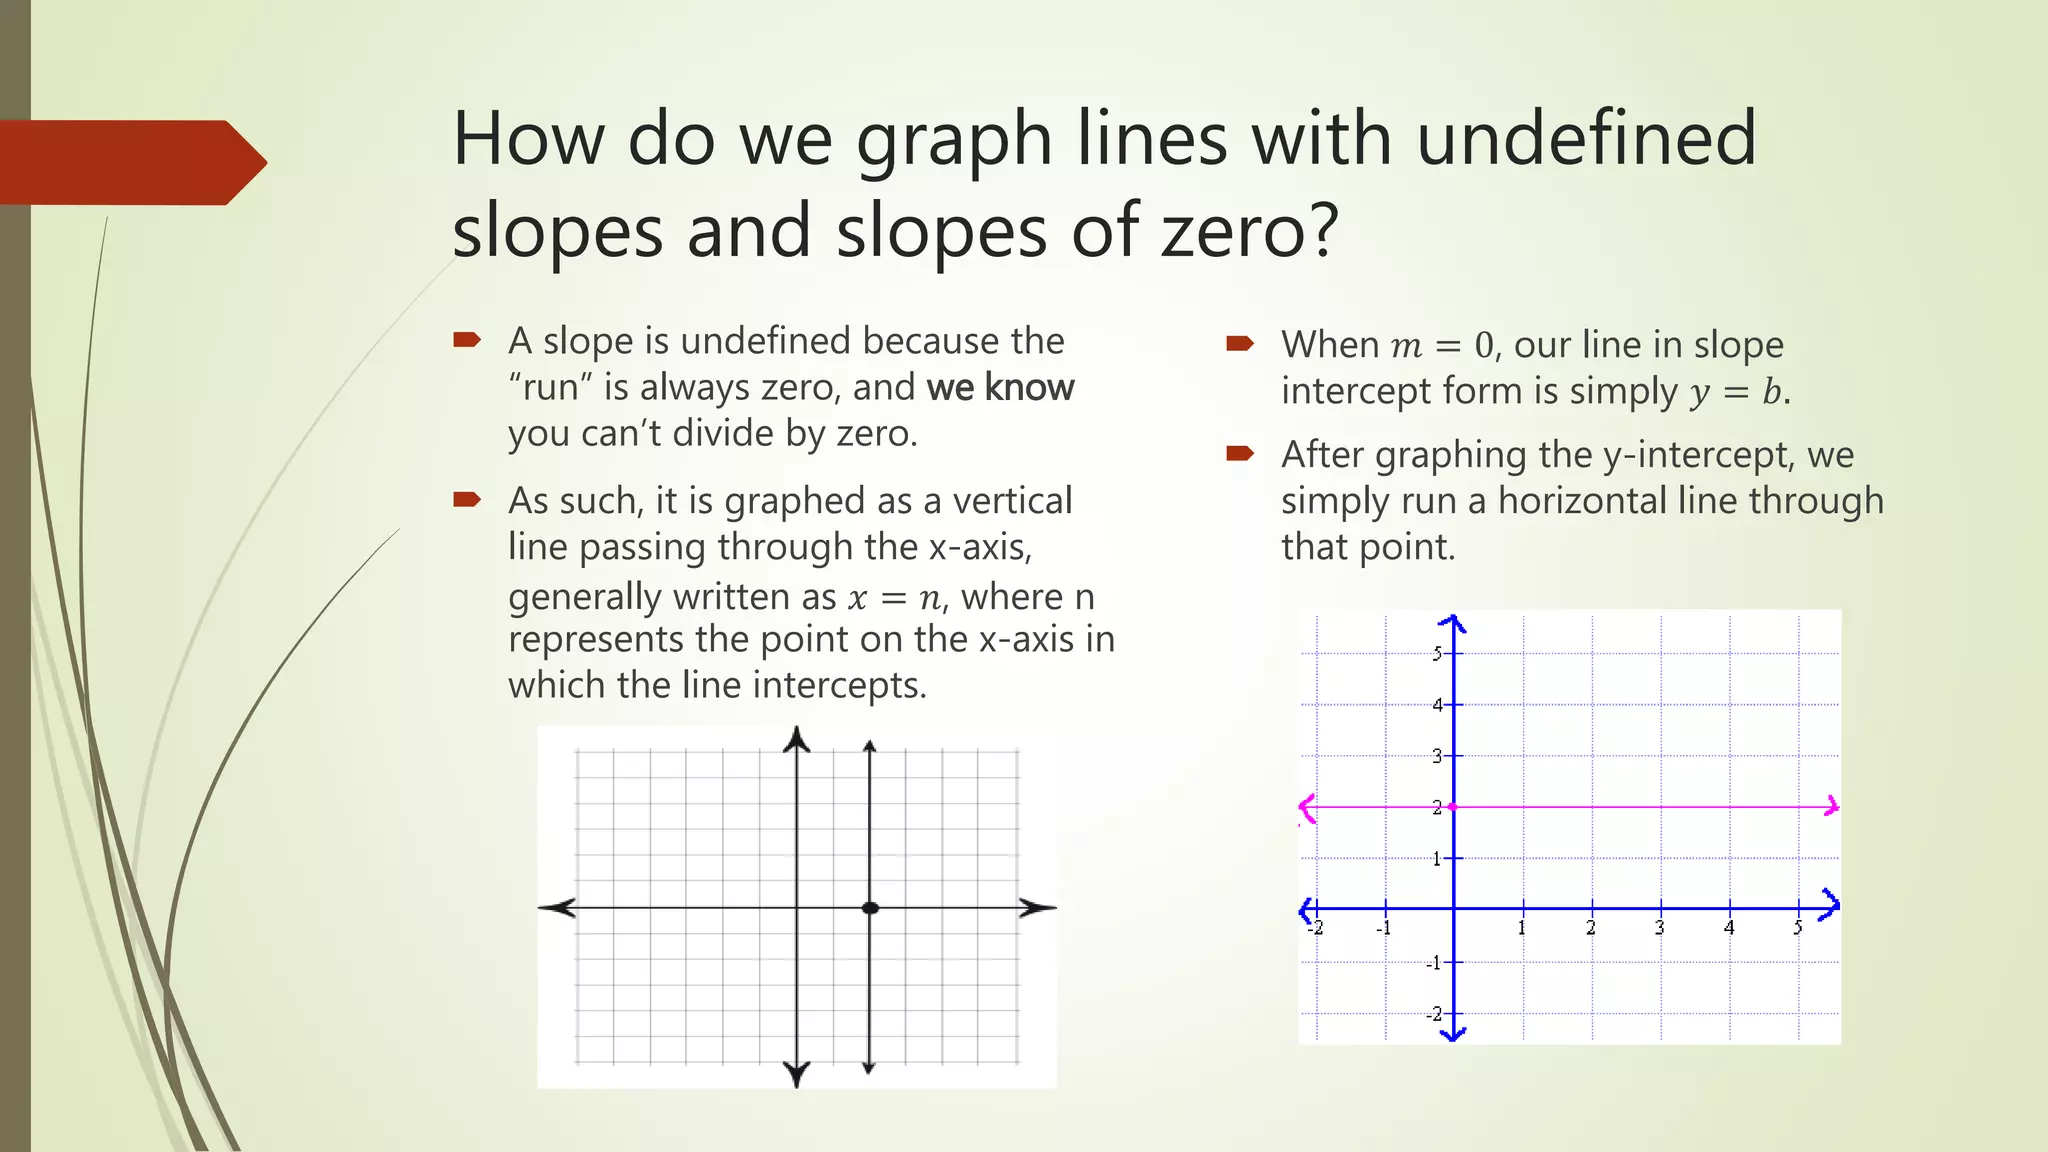
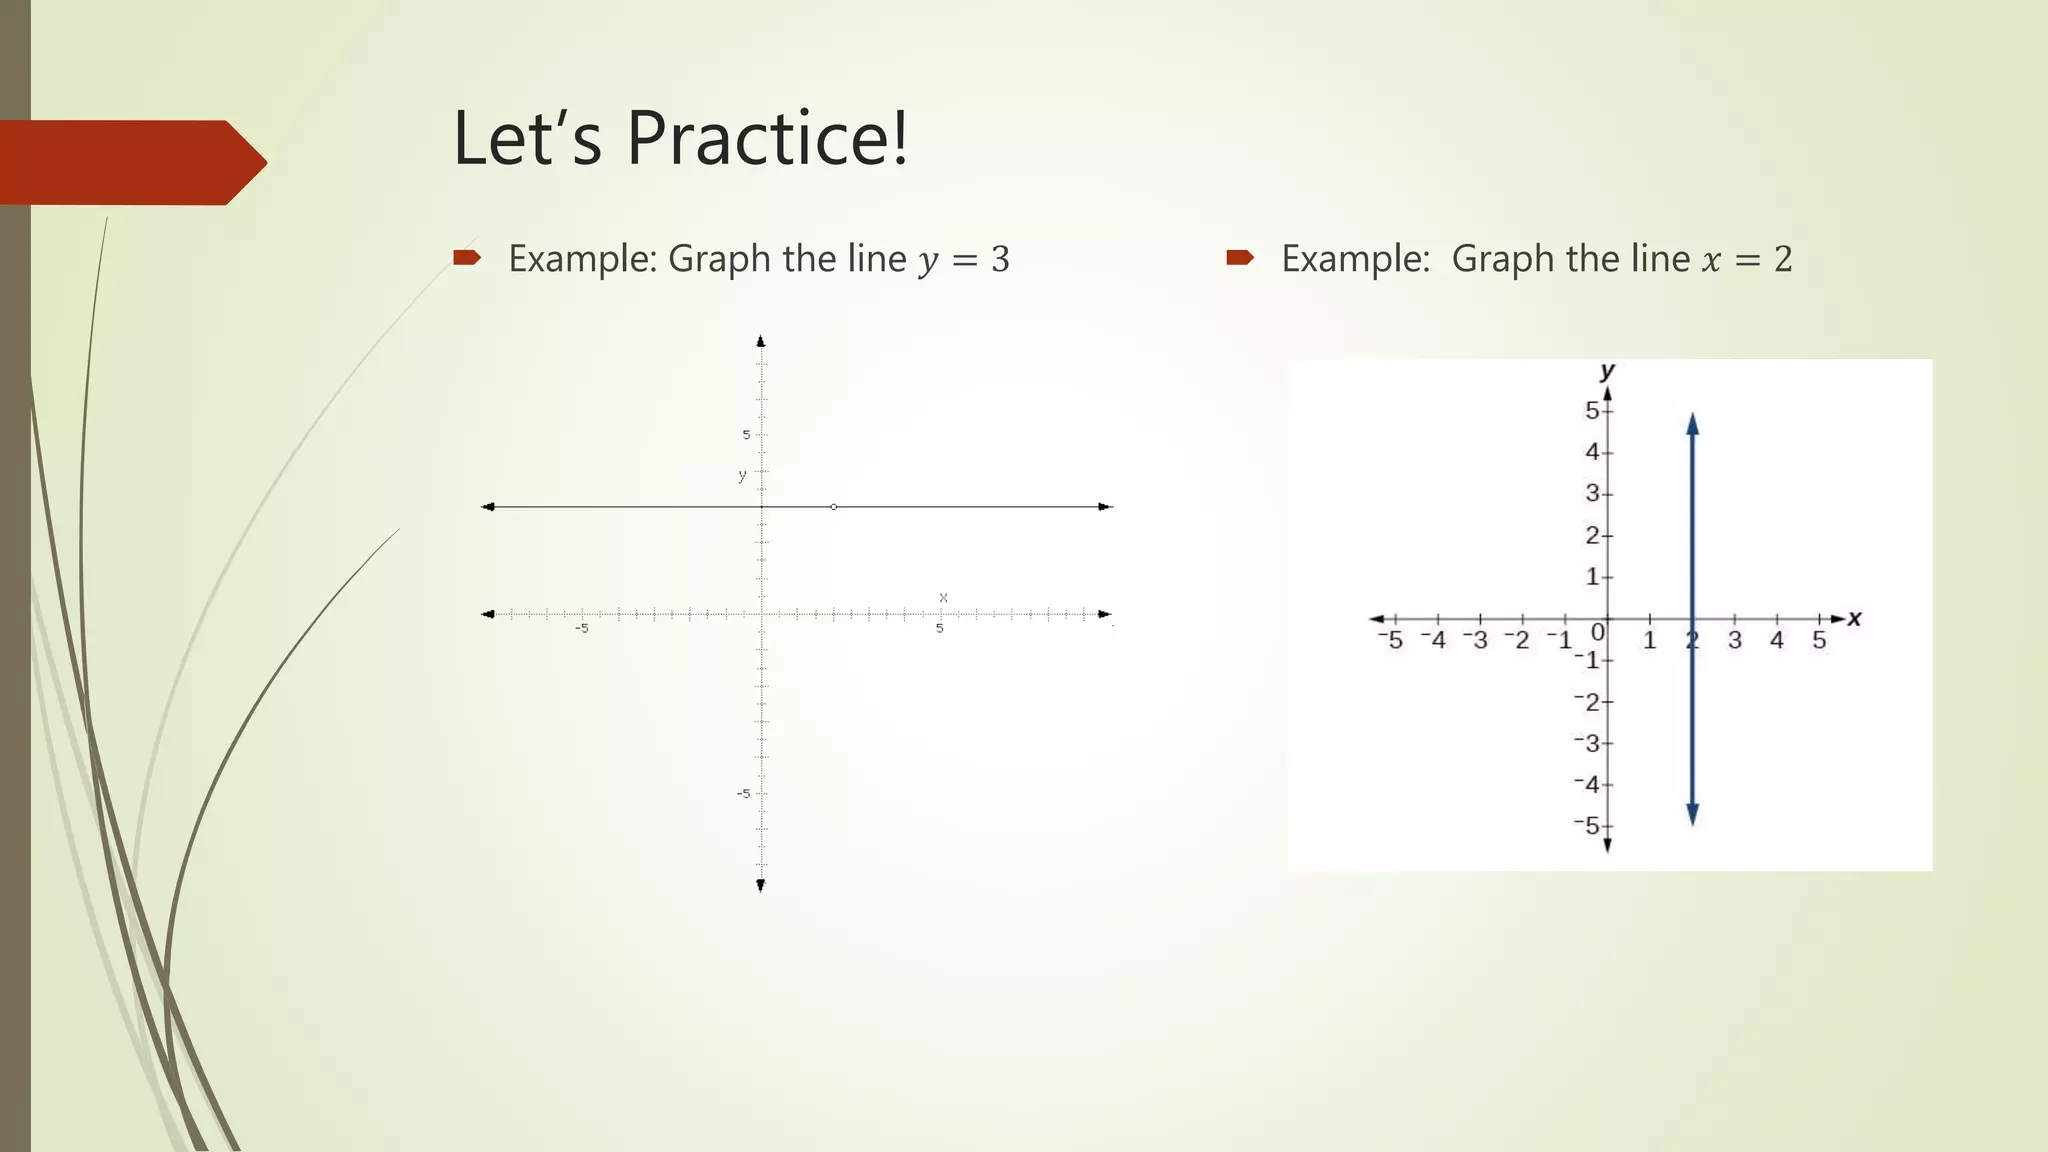
Graphing Linear Equations
By Mr. Adam Jackson
What is slope-intercept form?
 Linear equations consist of an independent
variable, usually called “x”, and a dependent
variable, usually called “y”.
 When we solve for the dependent variable, the
equation is said to be in slope-intercept form: y
= mx+b
 Although there are many ways to write linear
equations, slope-intercept form is the easiest way
for us to express it graphically.
 “m”, the coefficient of the independent variable,
is the slope.
 “b” is the y-intercept.
What is the y-intercept?
 The y-intercept, represented by the
letter “b”, is the point where the line
intercepts the y-axis.
 When graphing equations in slope-
intercept form, the first point we
graph should be the y-intercept.
 By locating “b” along the y-axis (with
x = 0), we have our first point.
 After plotting the first point, we then
have to determine the direction of
the line.
Let’s Review…
 Question:
What is the first point we graph when plotting a linear equation?
Let’s Review…
 Question:
What is the first point we graph when plotting a linear equation?
 Answer:
The y-intercept: (0, 𝑏)
What is the slope of a line?
 The slope, represented by the letter
“m”, is the change in y divided by the
change in x.
 When the slope is a positive number,
the direction of the line climbs “uphill”
as the x-value increases.
 When the slope is a negative number,
the direction of the line falls “downhill”
as the x-value increases.
 When the slope is zero, the line is
horizontal.
 When the slope is undefined (divided
by zero), the line is vertical.
How do we graph the slope?
 The slope is also called the “rise over
run”. This is because the numerator
of the slope represents how much
the slope rises up, and the
denominator represents how much it
runs.
 𝑚 =
𝑟𝑖𝑠𝑒
𝑟𝑢𝑛
 If the slope is given as m=2,
remember that this is the same as
𝑚 =
2
1
, indicating that we would “rise”
two units, “run” one unit, and draw
the line.
Let’s Review…
 Question:
How do we graph the equation 𝑦 =
1
3
𝑥 − 3?
Let’s Review…
 Question:
How do we graph the equation 𝑦 =
1
3
𝑥 − 3?
 Answer:
How do we graph lines with undefined
slopes and slopes of zero?
How do we graph lines with undefined
slopes and slopes of zero?
 A slope is undefined because the
“run” is always zero, and we know
you can’t divide by zero.
 As such, it is graphed as a vertical
line passing through the x-axis,
generally written as 𝑥 = 𝑛, where n
represents the point on the x-axis in
which the line intercepts.
 When 𝑚 = 0, our line in slope
intercept form is simply 𝑦 = 𝑏.
 After graphing the y-intercept, we
simply run a horizontal line through
that point.
Let’s Practice!
 Example: Graph the line 𝑦 = 3  Example: Graph the line 𝑥 = 2
Let’s Practice!
 Example: Graph the line 𝑦 = 3  Example: Graph the line 𝑥 = 2
Let’s Review…
 Question: What are the steps for graphing an equation in slope
intercept form?
Let’s Review…
 Question: What are the steps for graphing an equation in slope
intercept form?
1. Find the slope and y-intercept. Lines of the form 𝑦 = 𝑚𝑥 + 𝑏 have a
slope of “m” and a y-intercept of “b”. Make sure to express “m” as a
fraction.
2. Plot the y-intercept on the graph. Locate b along the y-axis at the
point (0, 𝑏) and mark the point.
3. Extend the line from the point using rise over run. When “m” is written
as a fraction, “rise” the line up by the numerator and “run” the line by
the denominator.

Graphing Linear Equations Teacher Lecture

  • 1.
  • 2.
  • 3.
    What is slope-interceptform?  Linear equations consist of an independent variable, usually called “x”, and a dependent variable, usually called “y”.  When we solve for the dependent variable, the equation is said to be in slope-intercept form: y = mx+b  Although there are many ways to write linear equations, slope-intercept form is the easiest way for us to express it graphically.  “m”, the coefficient of the independent variable, is the slope.  “b” is the y-intercept.
  • 4.
    What is they-intercept?
  • 5.
    What is they-intercept?  The y-intercept, represented by the letter “b”, is the point where the line intercepts the y-axis.  When graphing equations in slope- intercept form, the first point we graph should be the y-intercept.  By locating “b” along the y-axis (with x = 0), we have our first point.  After plotting the first point, we then have to determine the direction of the line.
  • 6.
    Let’s Review…  Question: Whatis the first point we graph when plotting a linear equation?
  • 7.
    Let’s Review…  Question: Whatis the first point we graph when plotting a linear equation?  Answer: The y-intercept: (0, 𝑏)
  • 8.
    What is theslope of a line?
  • 9.
    What is theslope of a line?  The slope, represented by the letter “m”, is the change in y divided by the change in x.  When the slope is a positive number, the direction of the line climbs “uphill” as the x-value increases.  When the slope is a negative number, the direction of the line falls “downhill” as the x-value increases.  When the slope is zero, the line is horizontal.  When the slope is undefined (divided by zero), the line is vertical.
  • 10.
    How do wegraph the slope?
  • 11.
    How do wegraph the slope?  The slope is also called the “rise over run”. This is because the numerator of the slope represents how much the slope rises up, and the denominator represents how much it runs.  𝑚 = 𝑟𝑖𝑠𝑒 𝑟𝑢𝑛  If the slope is given as m=2, remember that this is the same as 𝑚 = 2 1 , indicating that we would “rise” two units, “run” one unit, and draw the line.
  • 12.
    Let’s Review…  Question: Howdo we graph the equation 𝑦 = 1 3 𝑥 − 3?
  • 13.
    Let’s Review…  Question: Howdo we graph the equation 𝑦 = 1 3 𝑥 − 3?  Answer:
  • 14.
    How do wegraph lines with undefined slopes and slopes of zero?
  • 15.
    How do wegraph lines with undefined slopes and slopes of zero?  A slope is undefined because the “run” is always zero, and we know you can’t divide by zero.  As such, it is graphed as a vertical line passing through the x-axis, generally written as 𝑥 = 𝑛, where n represents the point on the x-axis in which the line intercepts.  When 𝑚 = 0, our line in slope intercept form is simply 𝑦 = 𝑏.  After graphing the y-intercept, we simply run a horizontal line through that point.
  • 16.
    Let’s Practice!  Example:Graph the line 𝑦 = 3  Example: Graph the line 𝑥 = 2
  • 17.
    Let’s Practice!  Example:Graph the line 𝑦 = 3  Example: Graph the line 𝑥 = 2
  • 18.
    Let’s Review…  Question:What are the steps for graphing an equation in slope intercept form?
  • 19.
    Let’s Review…  Question:What are the steps for graphing an equation in slope intercept form? 1. Find the slope and y-intercept. Lines of the form 𝑦 = 𝑚𝑥 + 𝑏 have a slope of “m” and a y-intercept of “b”. Make sure to express “m” as a fraction. 2. Plot the y-intercept on the graph. Locate b along the y-axis at the point (0, 𝑏) and mark the point. 3. Extend the line from the point using rise over run. When “m” is written as a fraction, “rise” the line up by the numerator and “run” the line by the denominator.