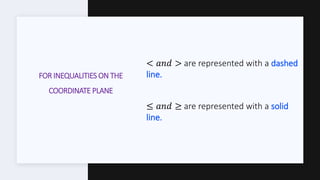
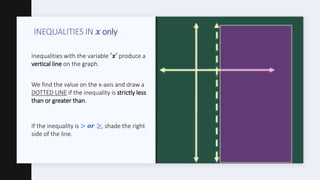
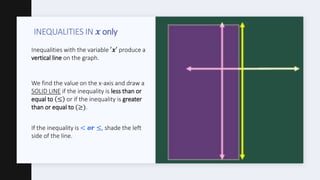
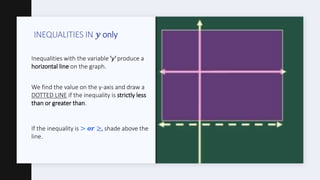
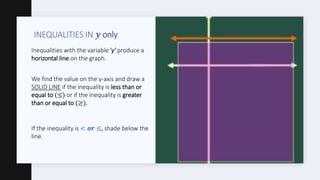
LINEAR INEQUALITIES
SOLUTION ON A GRAPH
FOR INEQUALITIES ON THE
COORDINATE PLANE
< 𝑎𝑛𝑑 > are represented with a dashed
line.
≤ 𝑎𝑛𝑑 ≥ are represented with a solid
line.
INEQUALITIES IN 𝒙 only
Inequalities with the variable ′𝒙′ produce a
vertical line on the graph.
We find the value on the x-axis and draw a
DOTTED LINE if the inequality is strictly less
than or greater than.
If the inequality is > 𝒐𝒓 ≥, shade the right
side of the line.
INEQUALITIES IN 𝒙 only
Inequalities with the variable ′𝒙′ produce a
vertical line on the graph.
We find the value on the x-axis and draw a
SOLID LINE if the inequality is less than or
equal to ≤ or if the inequality is greater
than or equal to (≥).
If the inequality is < 𝒐𝒓 ≤, shade the left
side of the line.
INEQUALITIES IN 𝒚 only
Inequalities with the variable 'y' produce a
horizontal line on the graph.
We find the value on the y-axis and draw a
DOTTED LINE if the inequality is strictly less
than or greater than.
If the inequality is > 𝒐𝒓 ≥, shade above the
line.
INEQUALITIES IN 𝒚 only
Inequalities with the variable 'y' produce a
horizontal line on the graph.
We find the value on the y-axis and draw a
SOLID LINE if the inequality is less than or
equal to (≤) or if the inequality is greater
than or equal to (≥).
If the inequality is < 𝒐𝒓 ≤, shade below the
line.
THE END.

Linear inequalities in one variable

  • 1.
  • 2.
    FOR INEQUALITIES ONTHE COORDINATE PLANE < 𝑎𝑛𝑑 > are represented with a dashed line. ≤ 𝑎𝑛𝑑 ≥ are represented with a solid line.
  • 3.
    INEQUALITIES IN 𝒙only Inequalities with the variable ′𝒙′ produce a vertical line on the graph. We find the value on the x-axis and draw a DOTTED LINE if the inequality is strictly less than or greater than. If the inequality is > 𝒐𝒓 ≥, shade the right side of the line.
  • 4.
    INEQUALITIES IN 𝒙only Inequalities with the variable ′𝒙′ produce a vertical line on the graph. We find the value on the x-axis and draw a SOLID LINE if the inequality is less than or equal to ≤ or if the inequality is greater than or equal to (≥). If the inequality is < 𝒐𝒓 ≤, shade the left side of the line.
  • 5.
    INEQUALITIES IN 𝒚only Inequalities with the variable 'y' produce a horizontal line on the graph. We find the value on the y-axis and draw a DOTTED LINE if the inequality is strictly less than or greater than. If the inequality is > 𝒐𝒓 ≥, shade above the line.
  • 6.
    INEQUALITIES IN 𝒚only Inequalities with the variable 'y' produce a horizontal line on the graph. We find the value on the y-axis and draw a SOLID LINE if the inequality is less than or equal to (≤) or if the inequality is greater than or equal to (≥). If the inequality is < 𝒐𝒓 ≤, shade below the line.
  • 7.