Downloaded 99 times

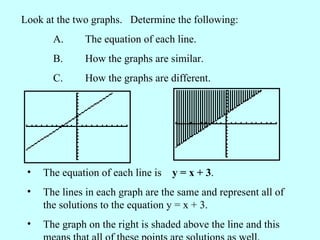


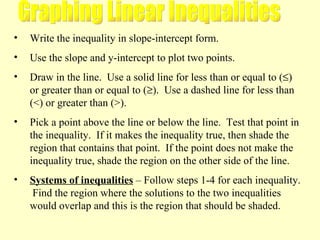
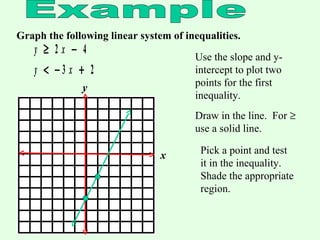
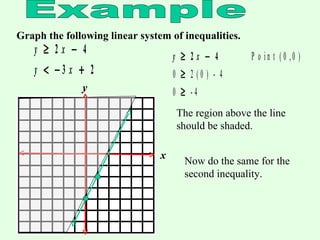
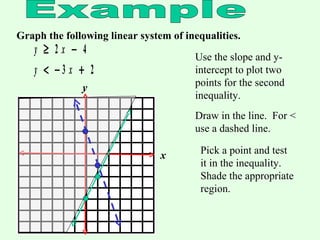
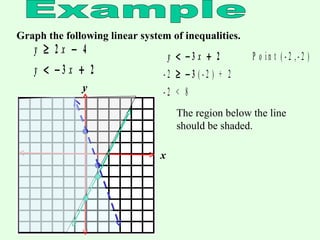
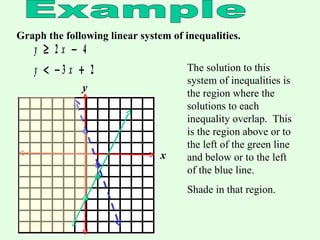

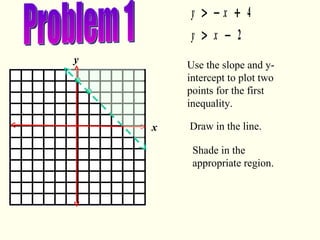


This document provides instructions for graphing systems of linear inequalities. It explains how to write inequalities in slope-intercept form, plot points to draw the line, and shade the appropriate region based on whether it is <, ≤, >, or ≥. An example problem is worked through step-by-step to demonstrate how to graph two inequalities and find the overlapping region that satisfies both inequalities. Practice problems are then provided for the reader to work through on their own.


![Checklist for practicals[1]](https://cdn.slidesharecdn.com/ss_thumbnails/checklistforpracticals1-110206102018-phpapp02-thumbnail.jpg?width=640&height=640&fit=bounds)


![7.9 notes[1]](https://cdn.slidesharecdn.com/ss_thumbnails/7-9notes1-130121125633-phpapp02-thumbnail.jpg?width=640&height=640&fit=bounds)