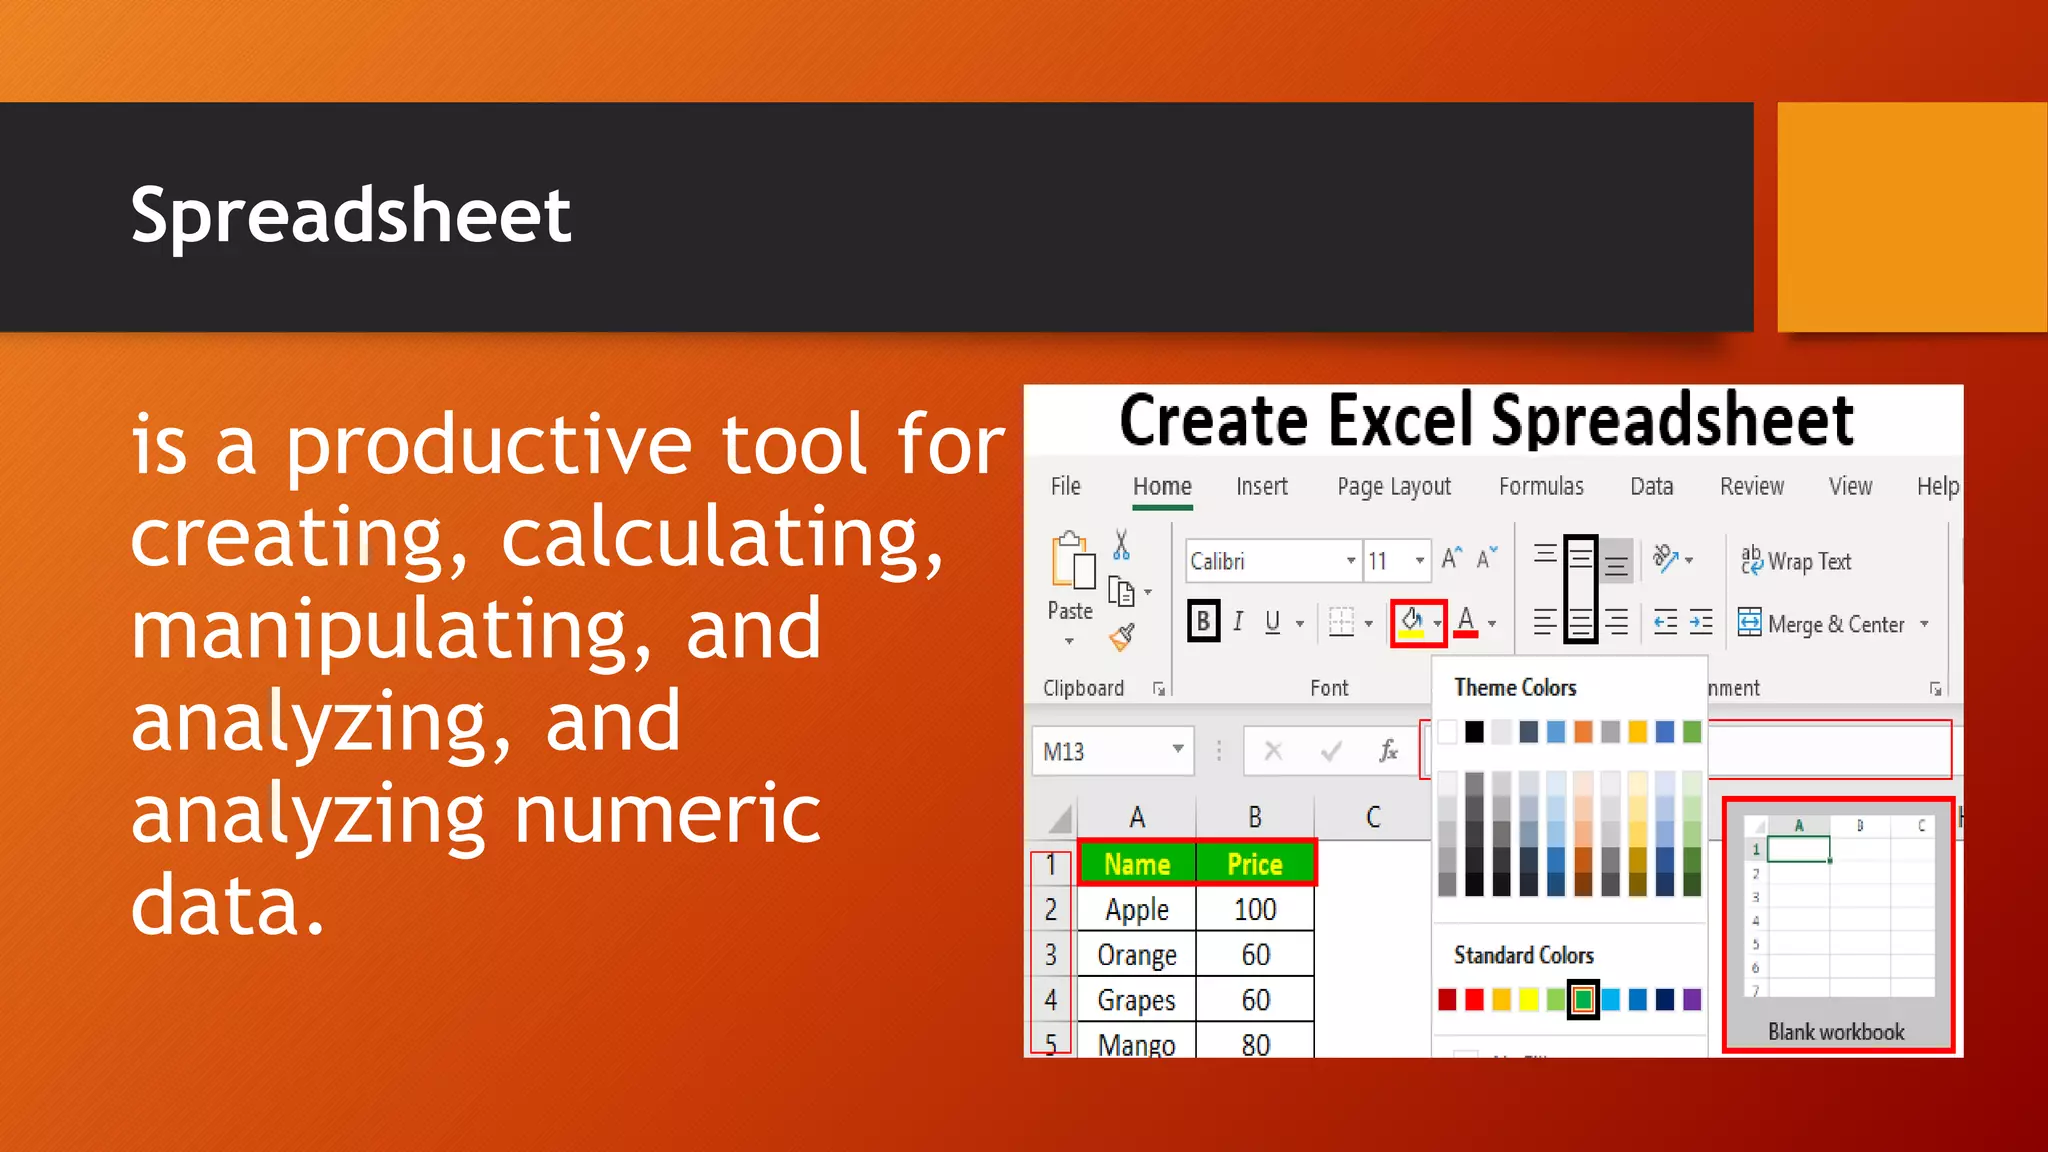
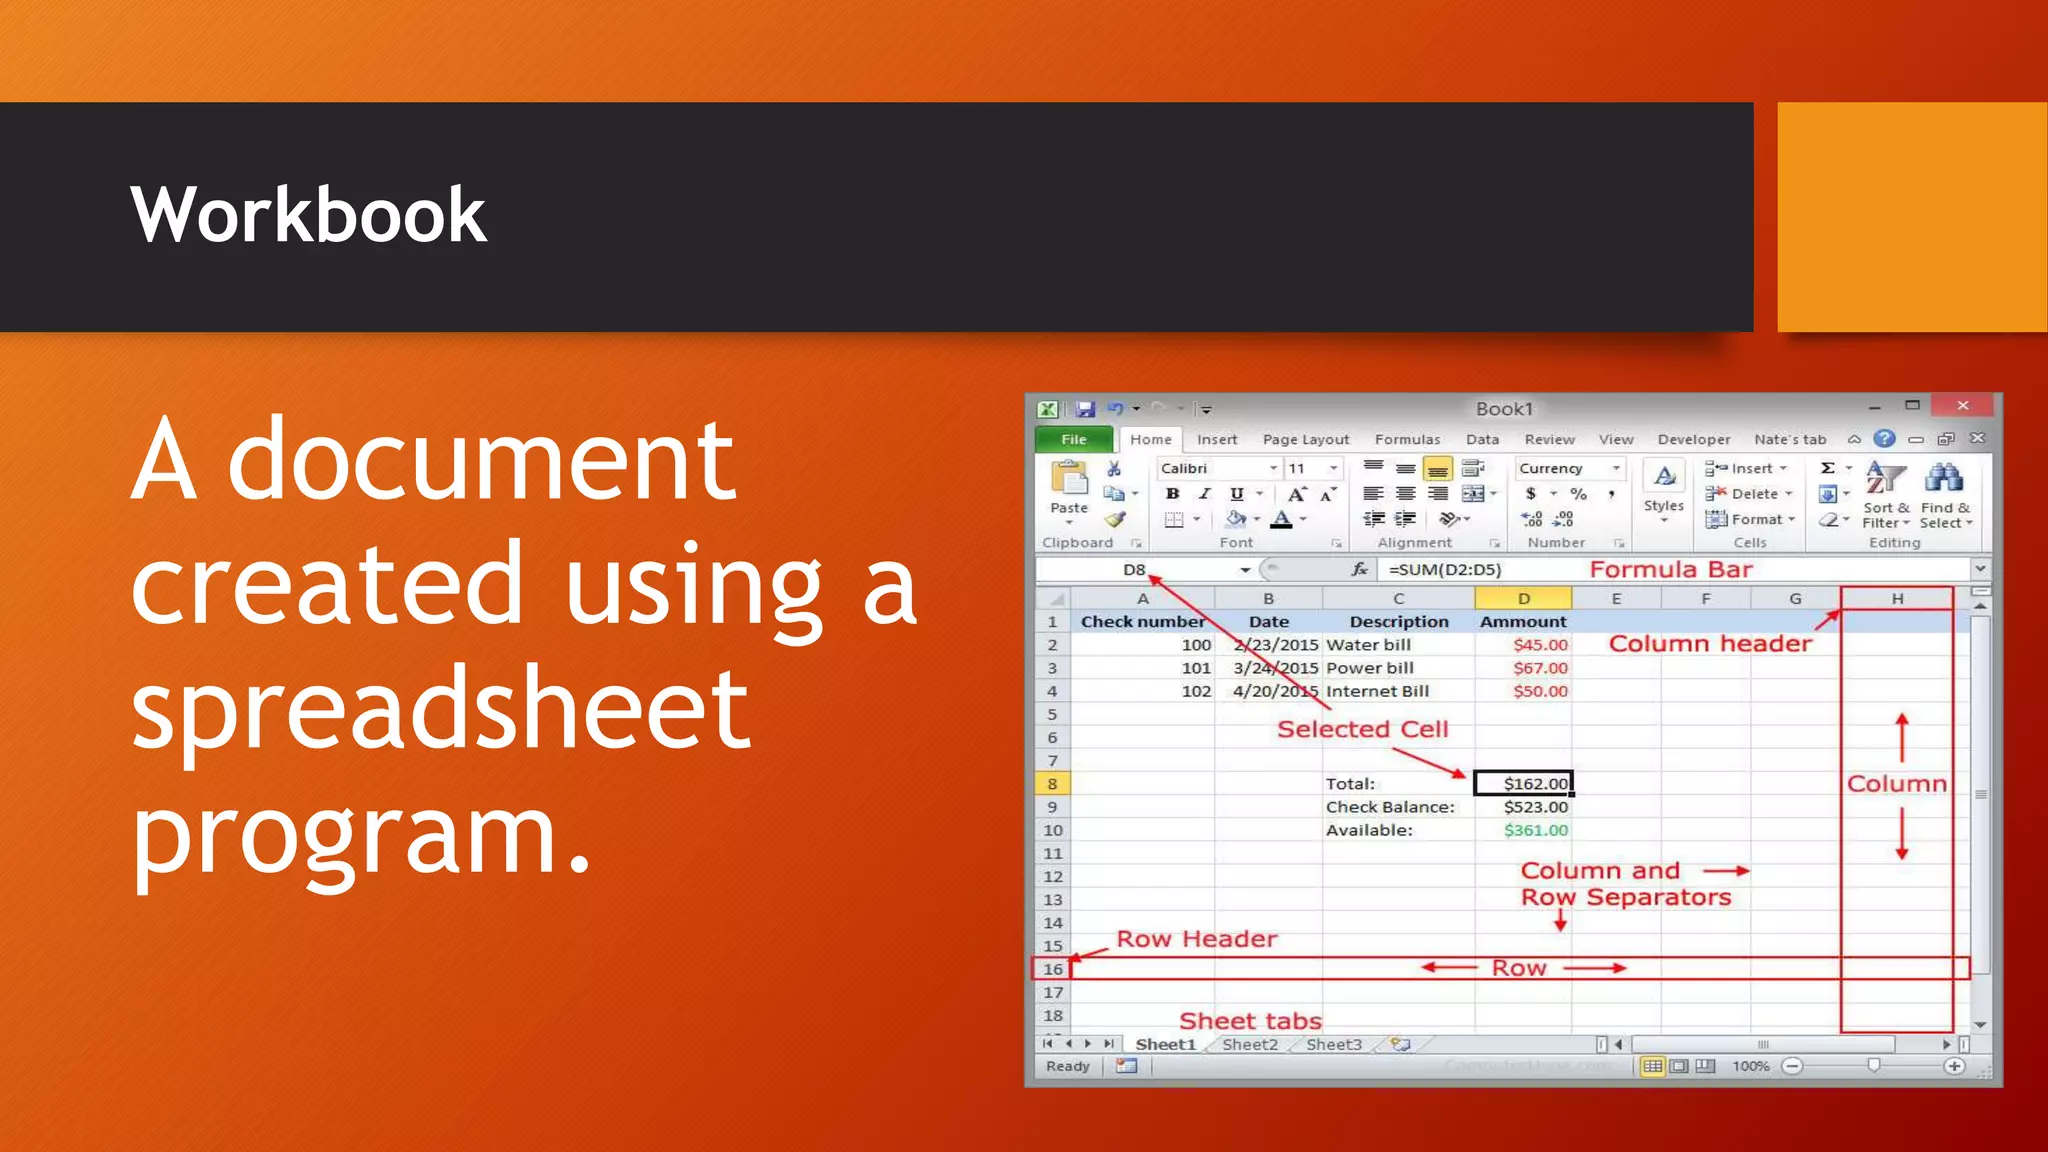
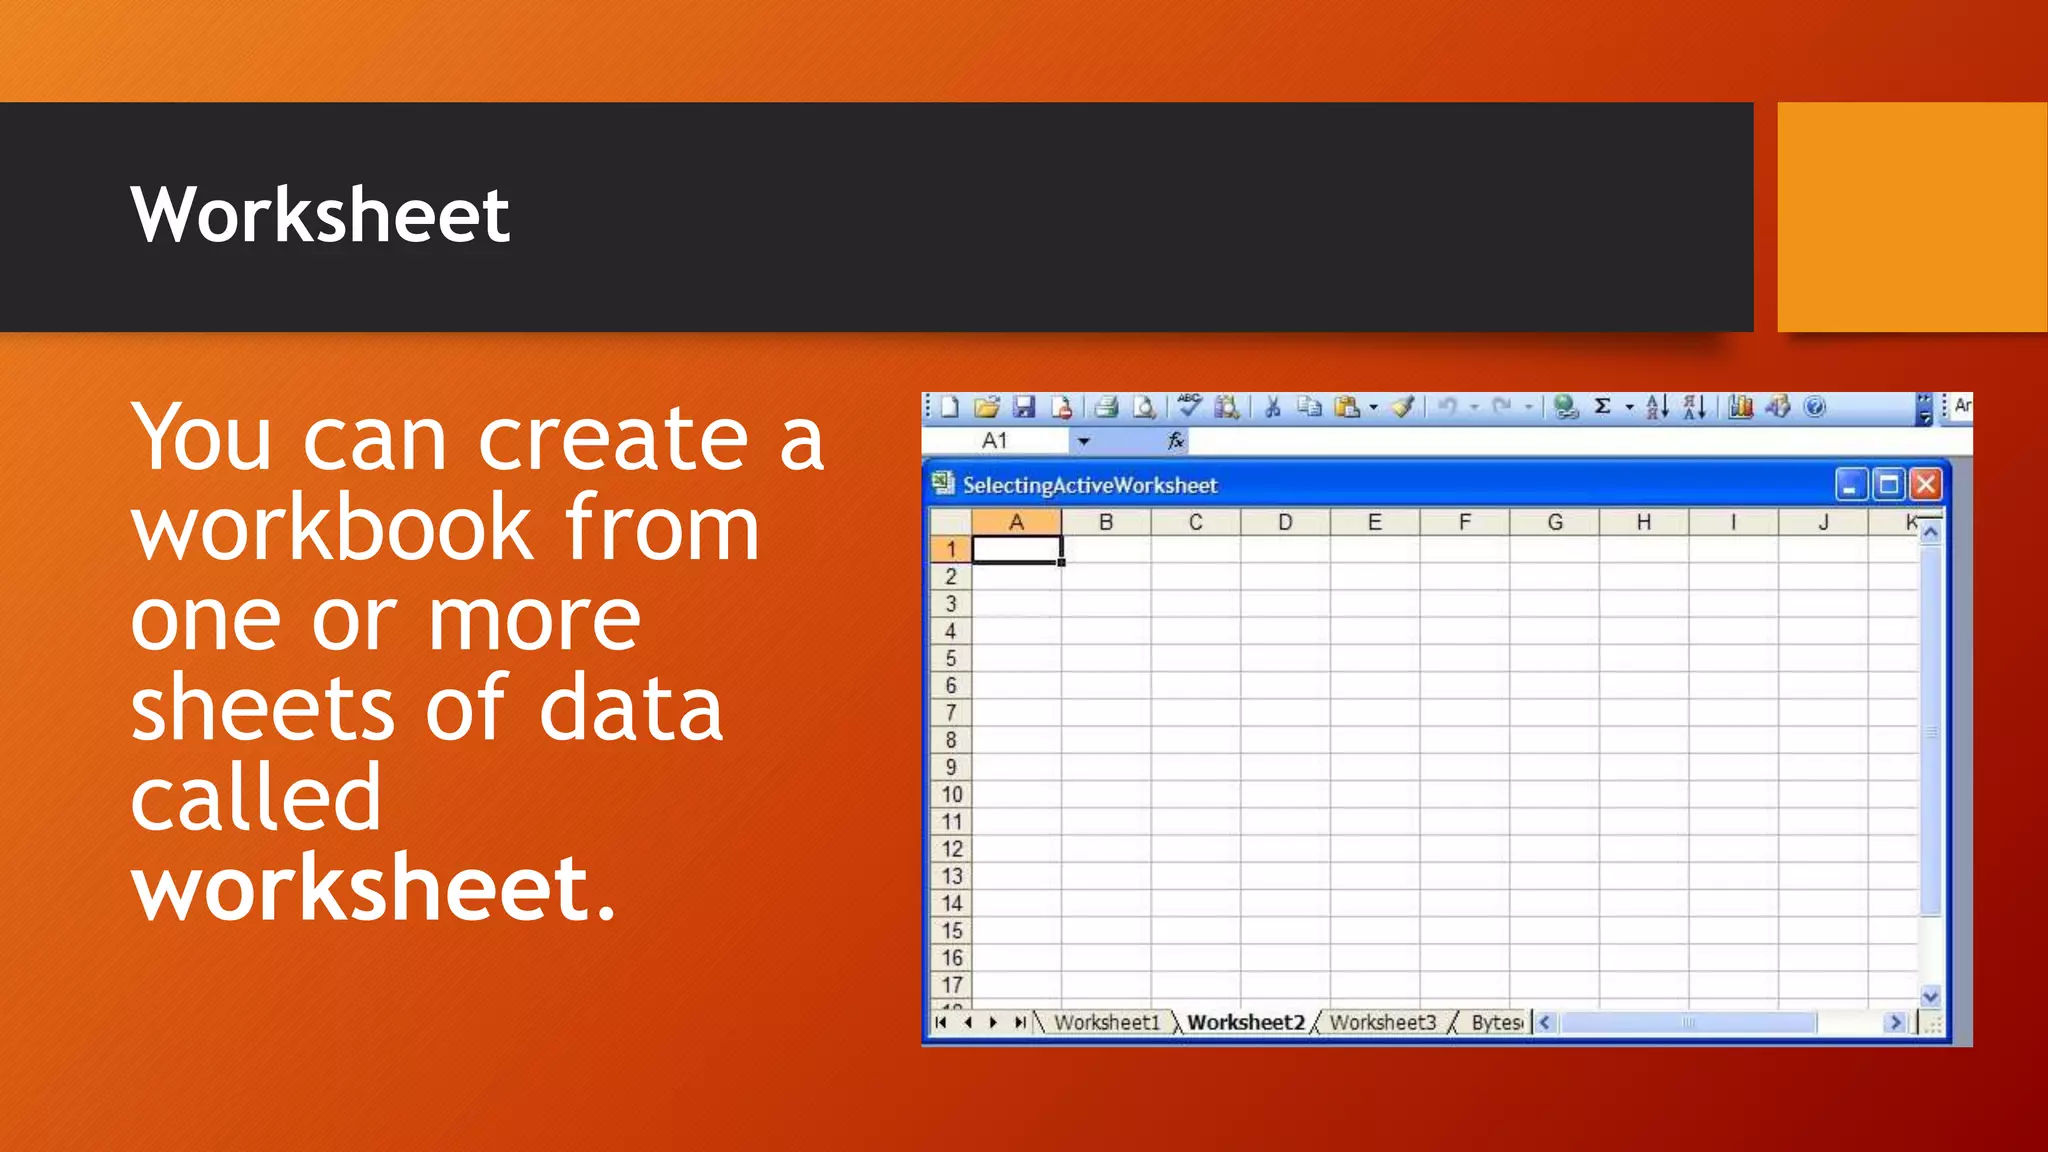
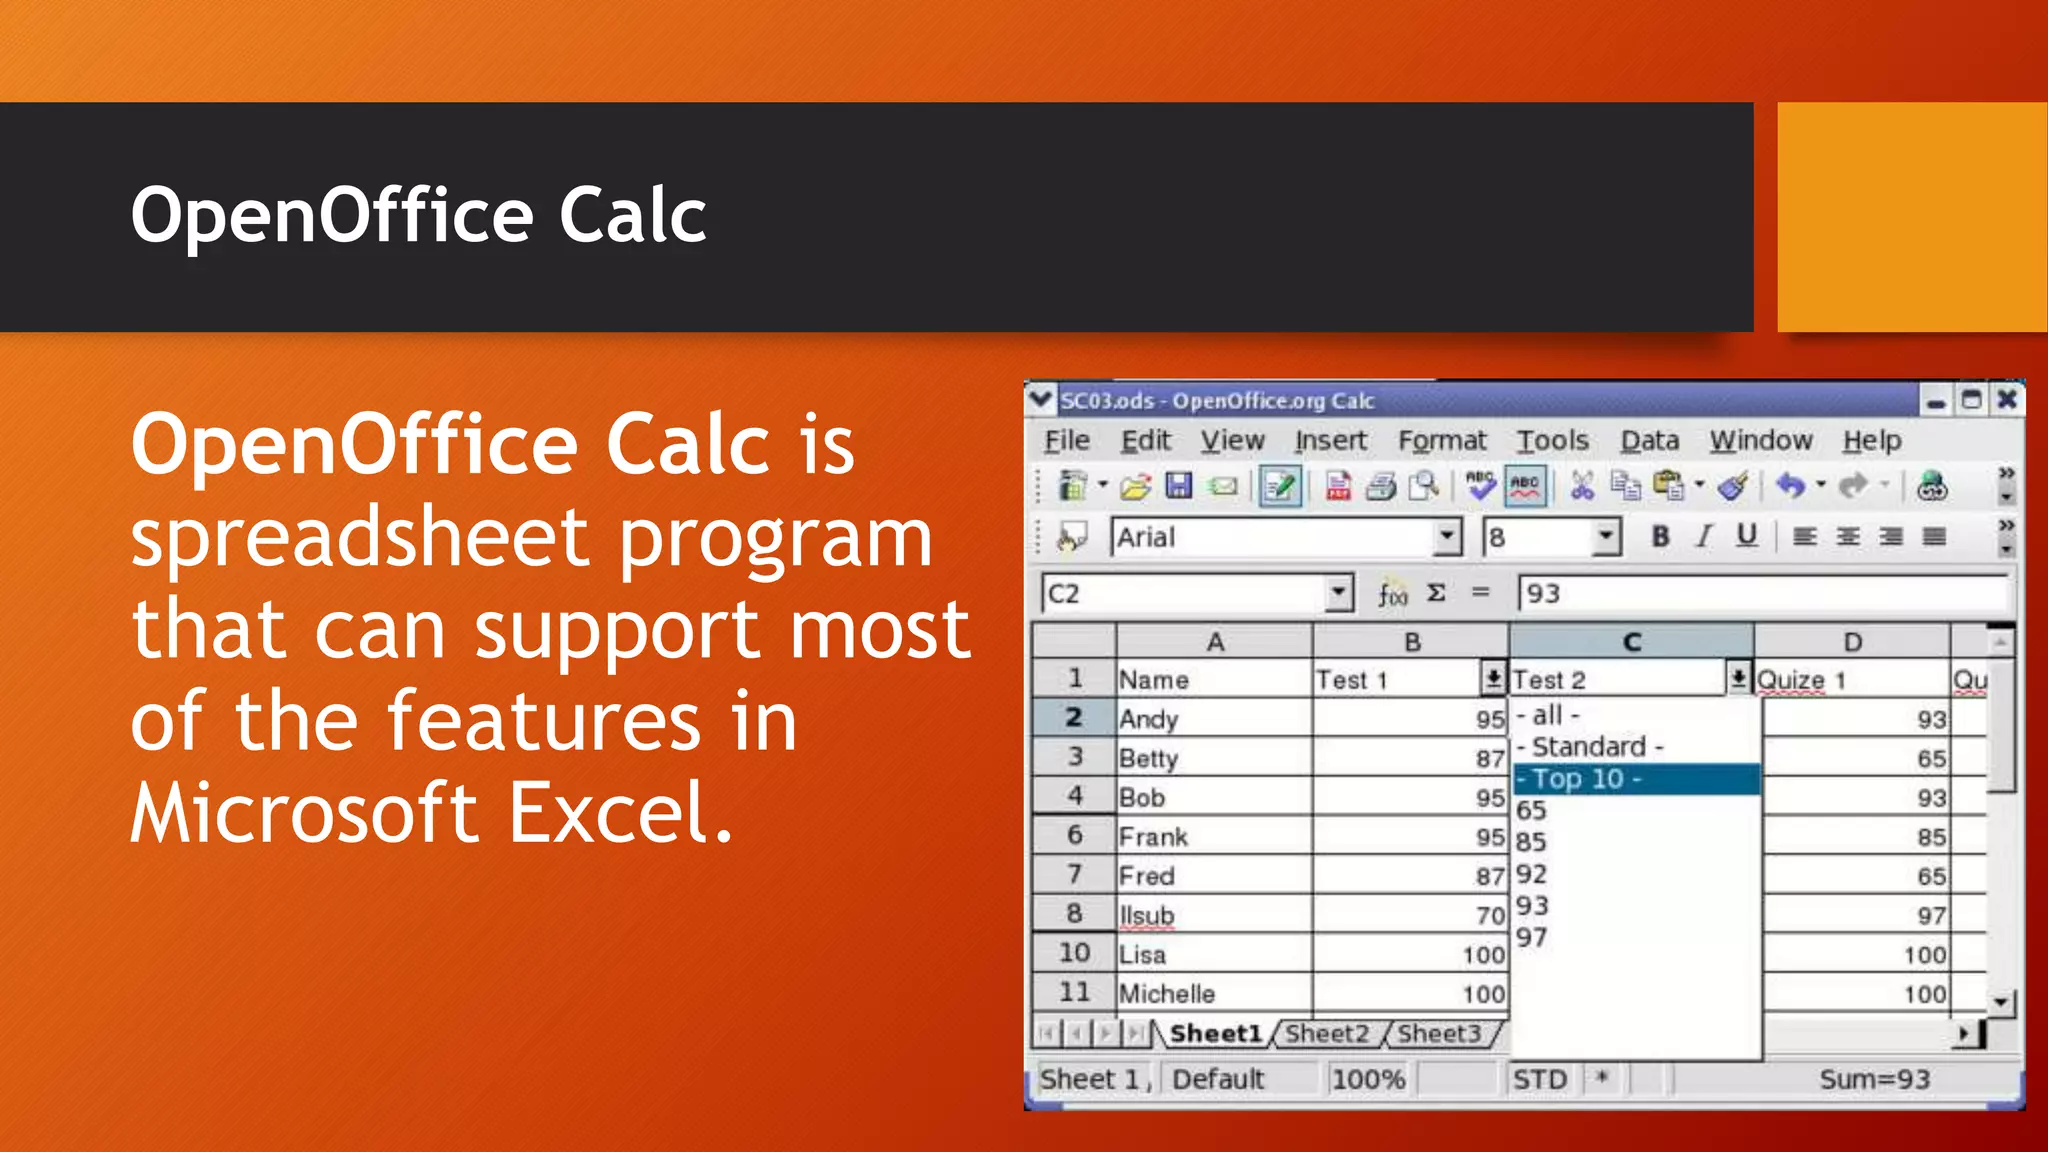
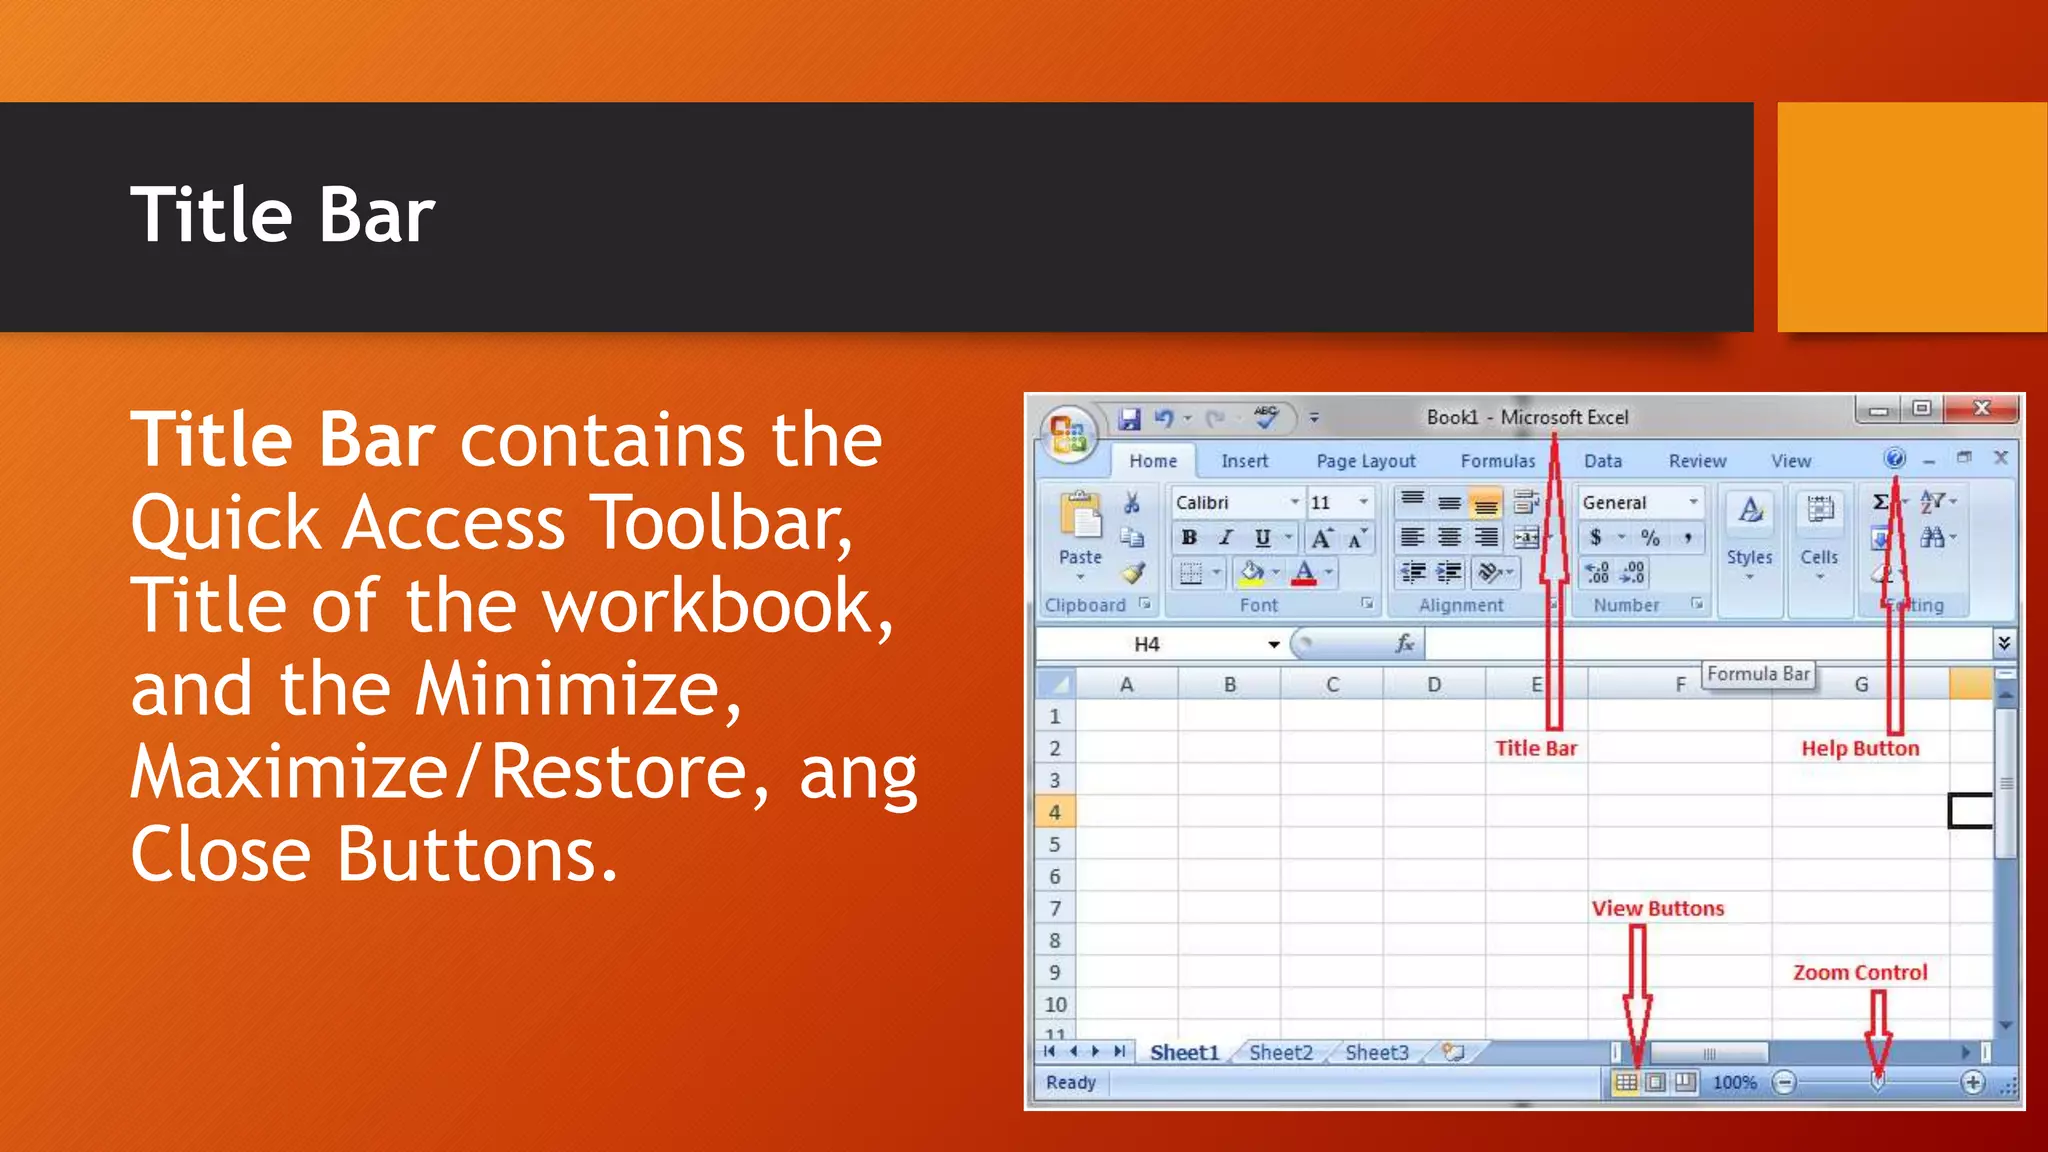
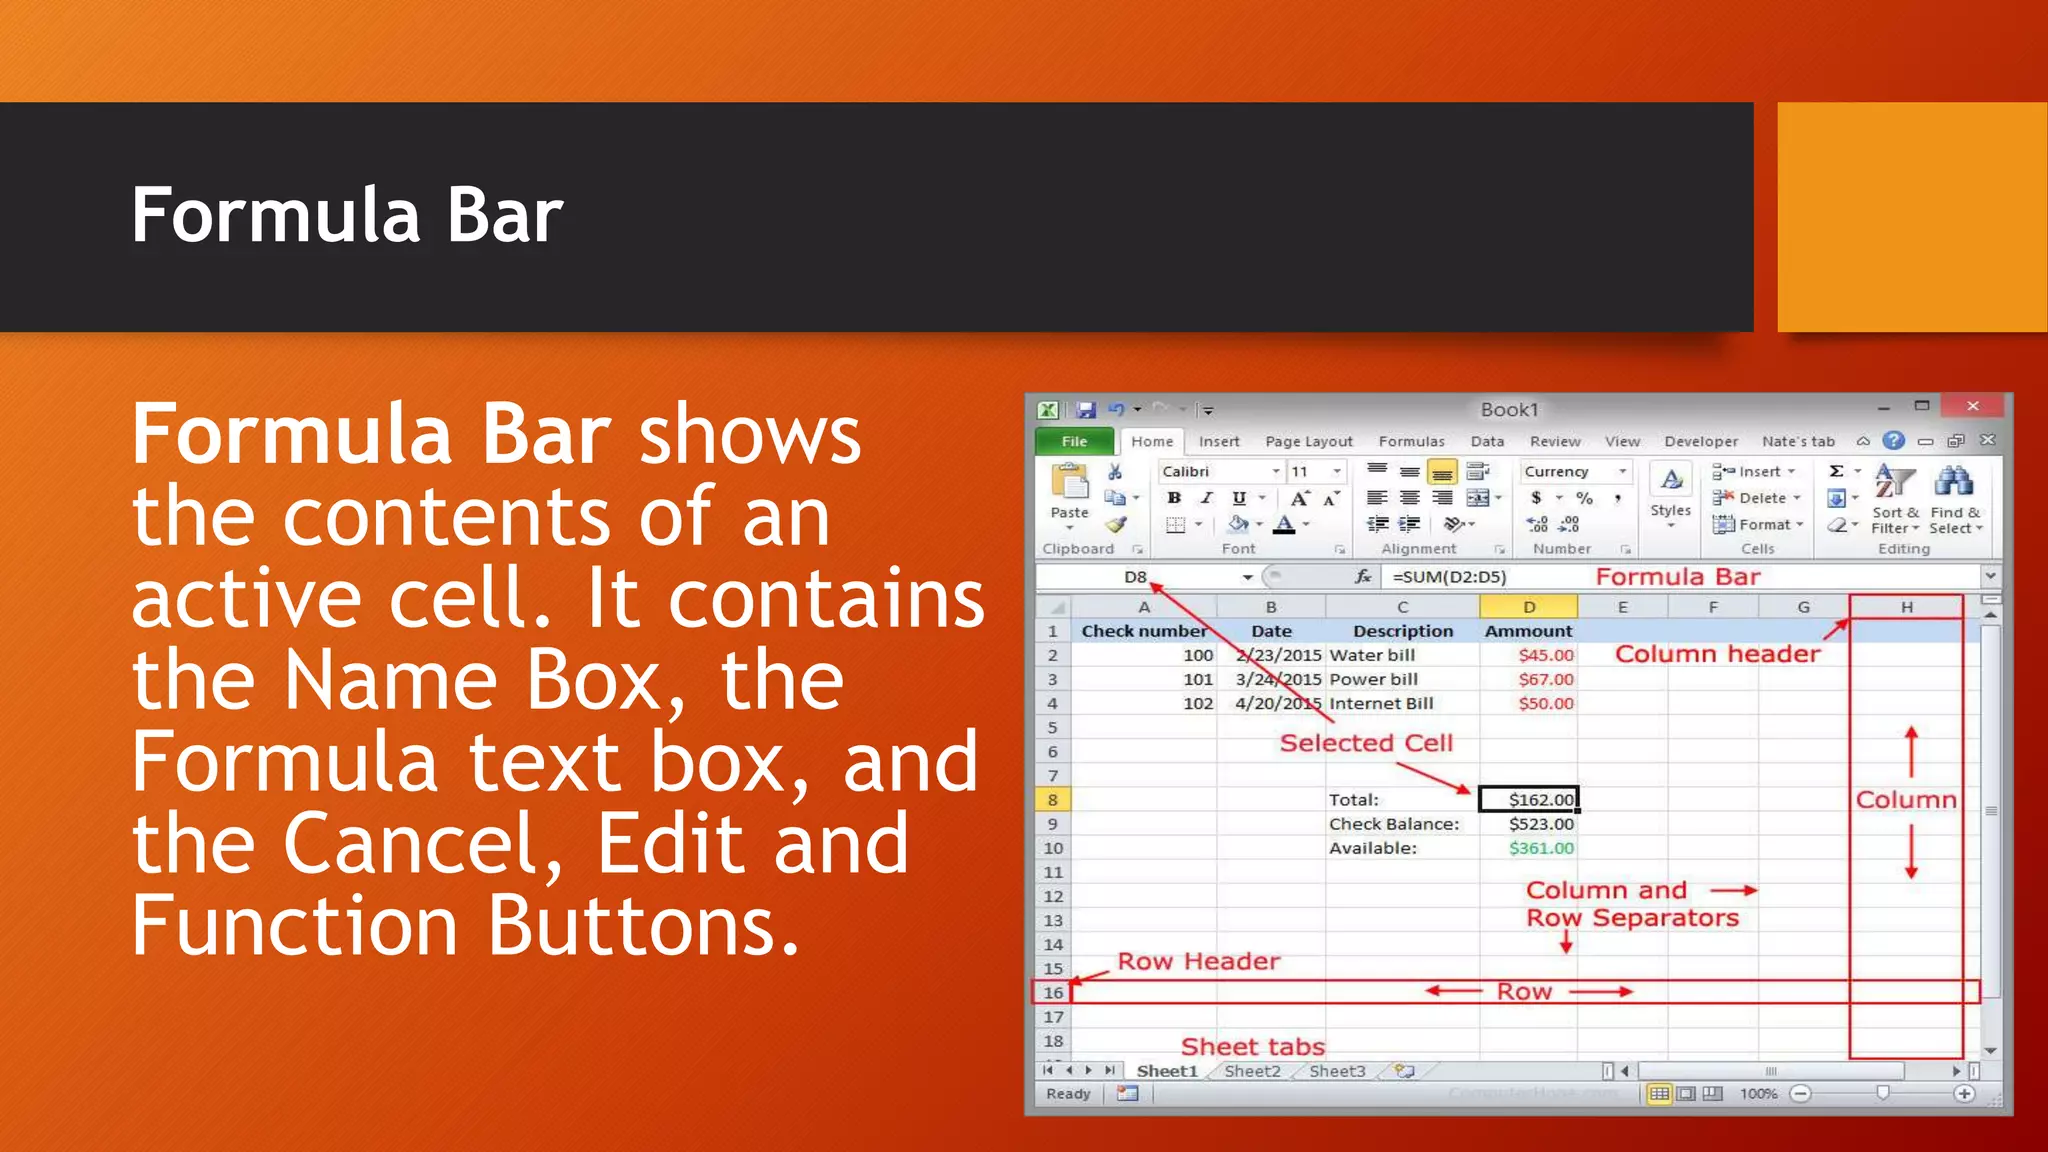
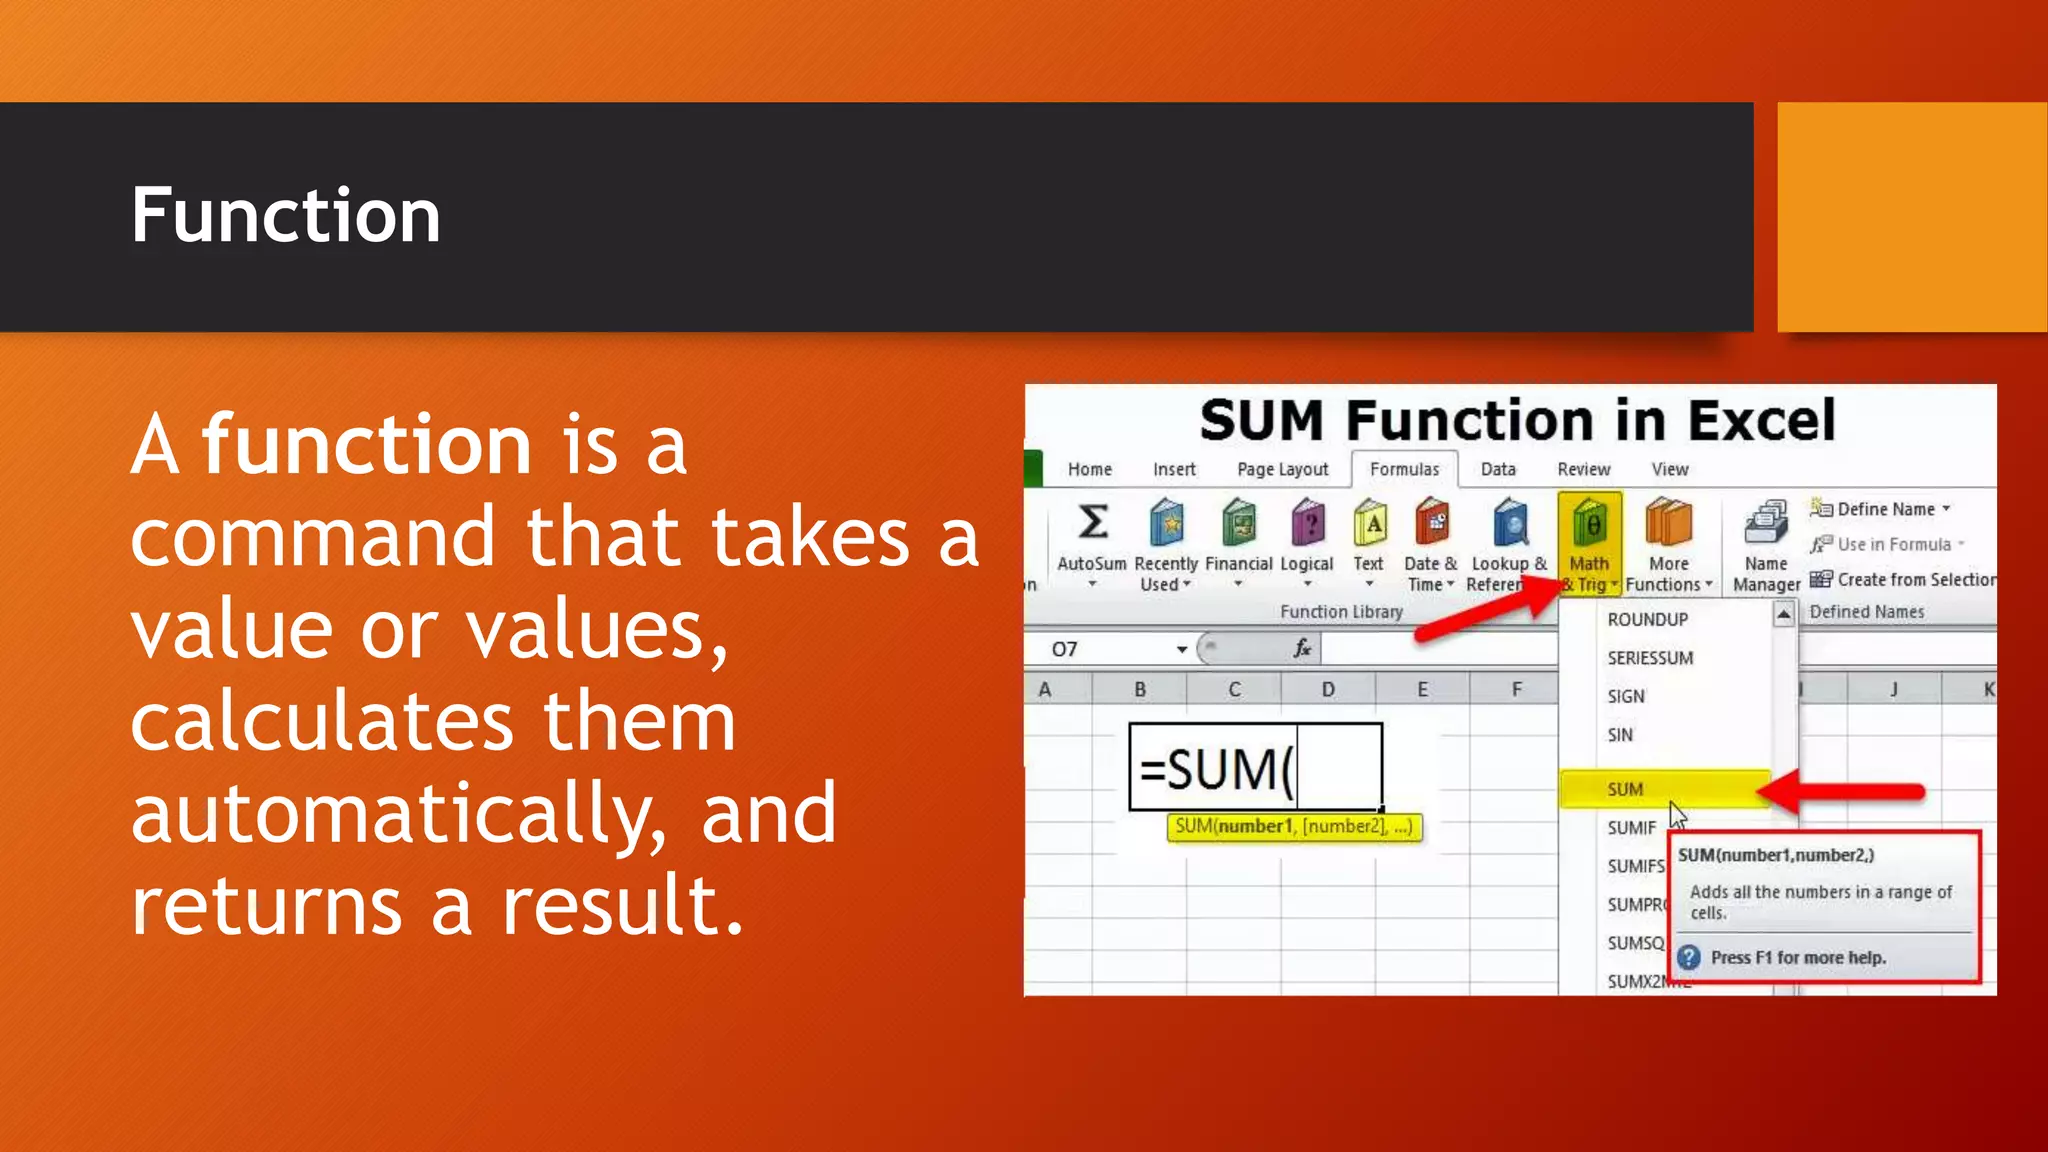
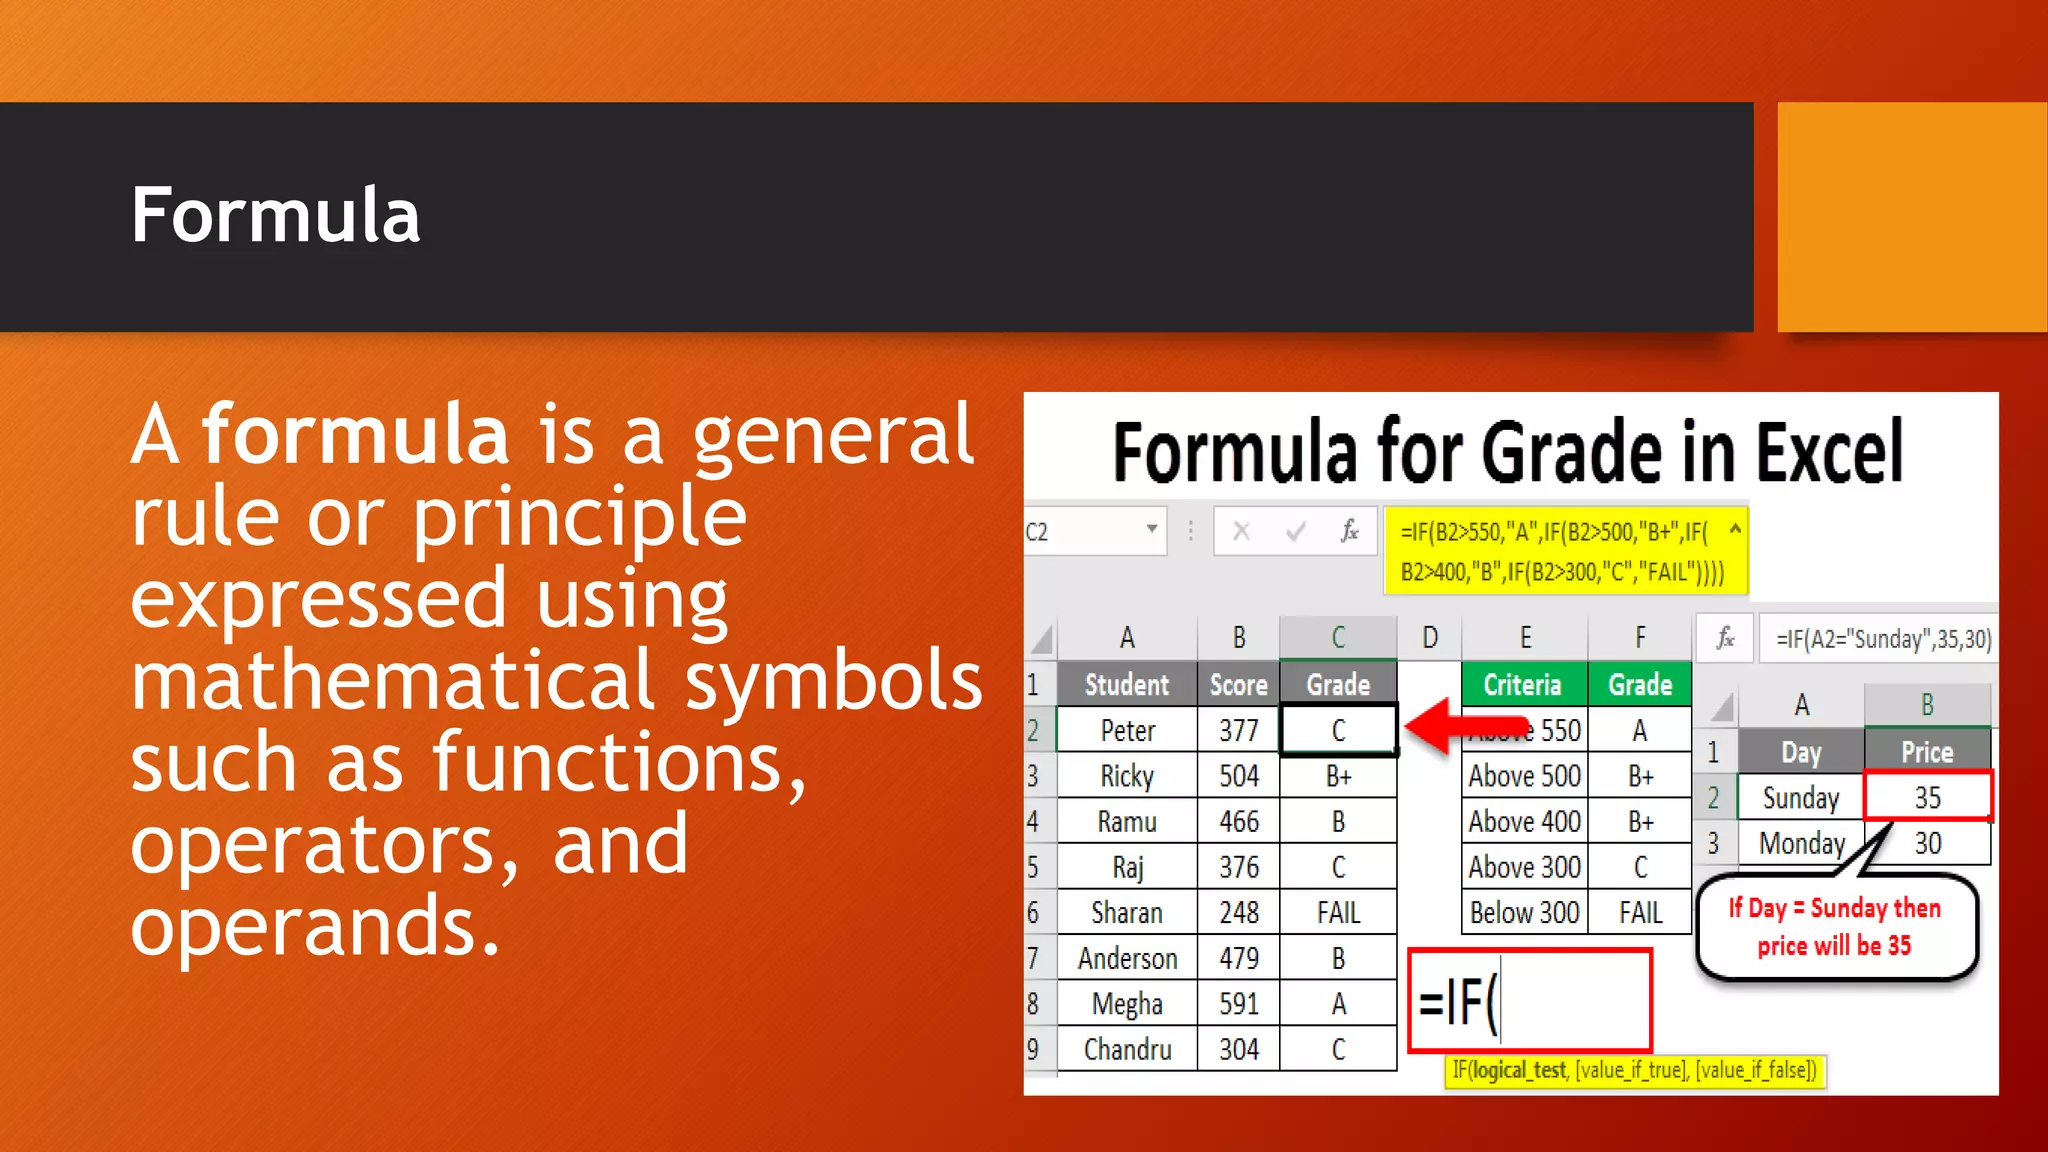
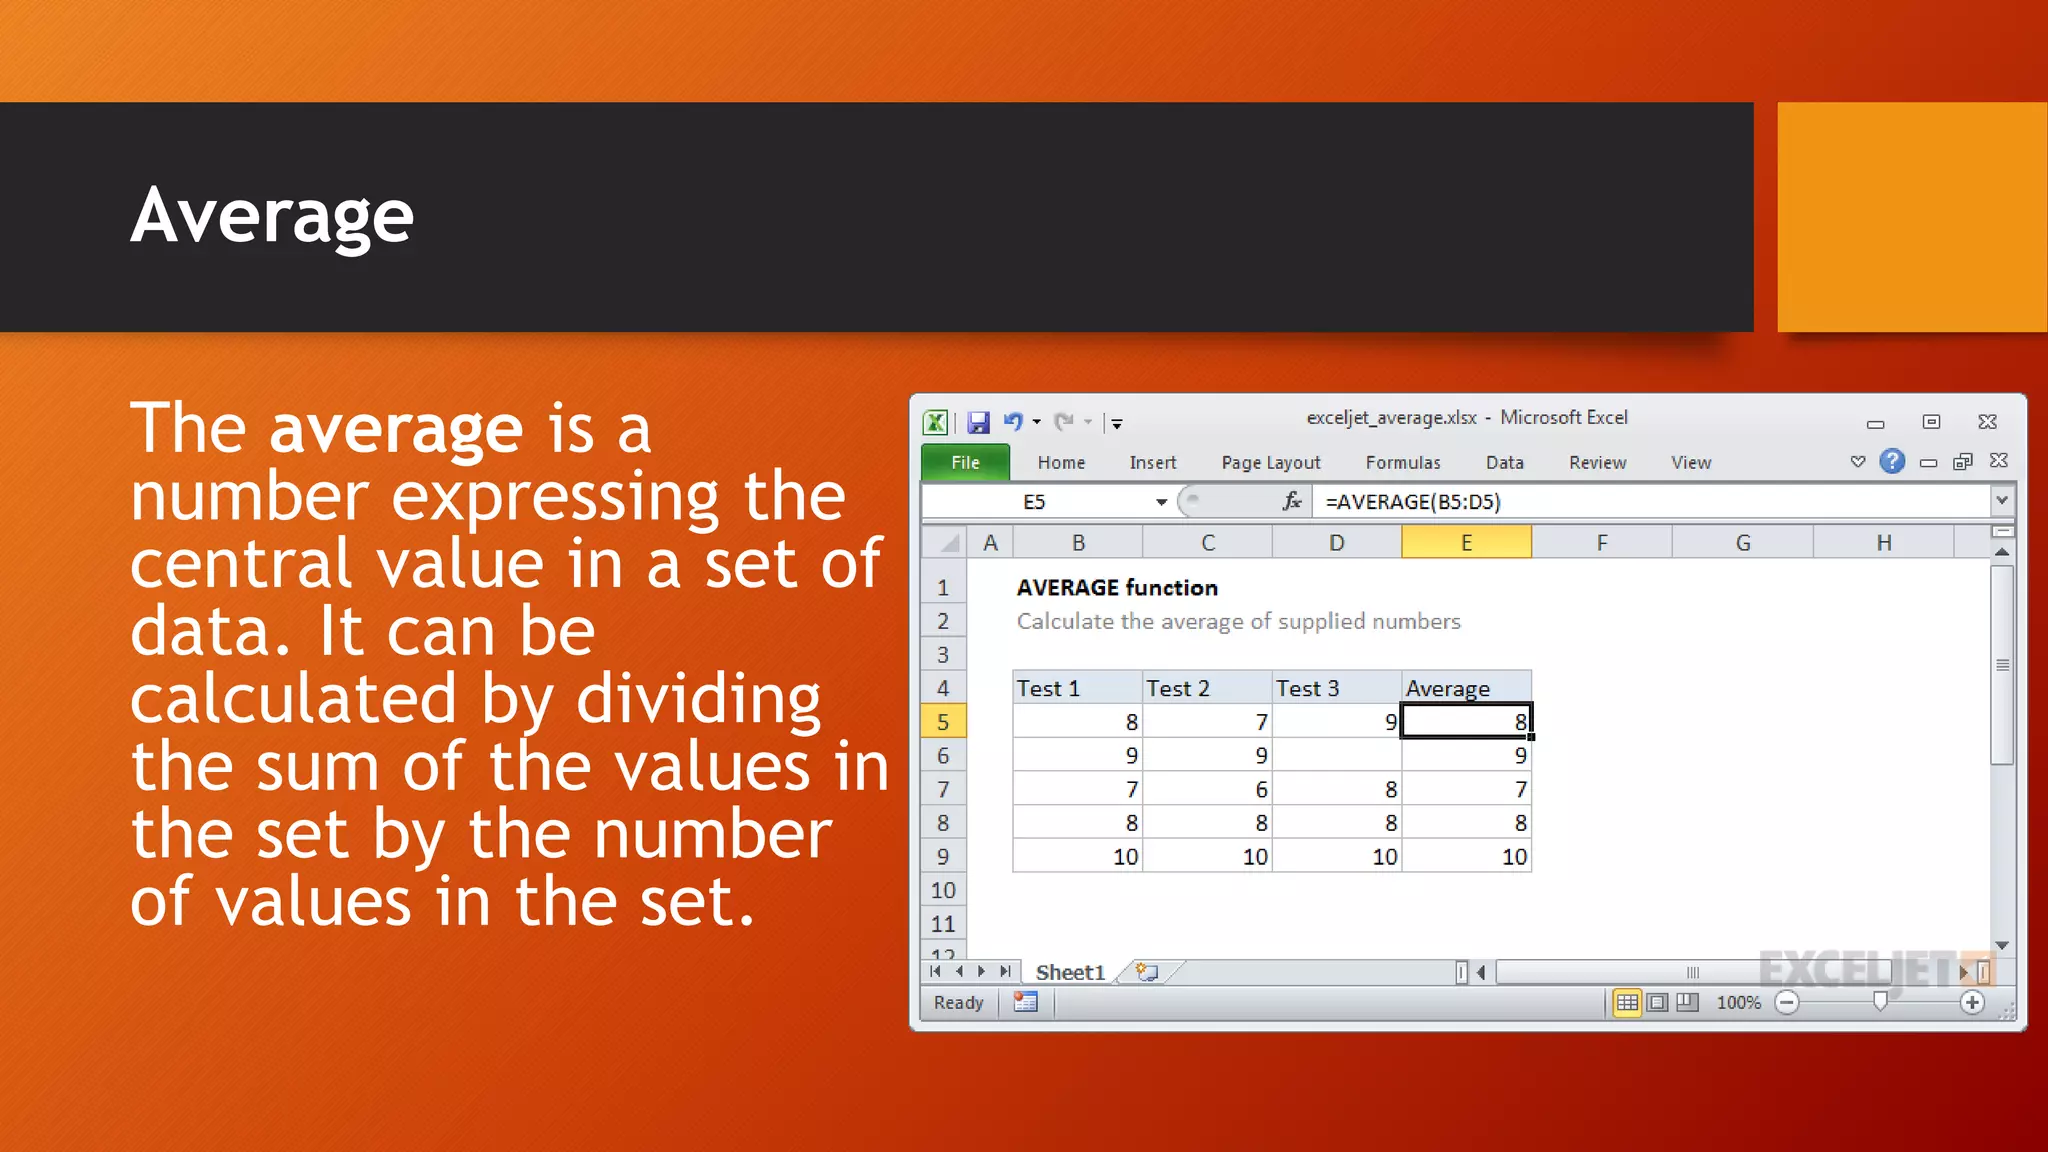
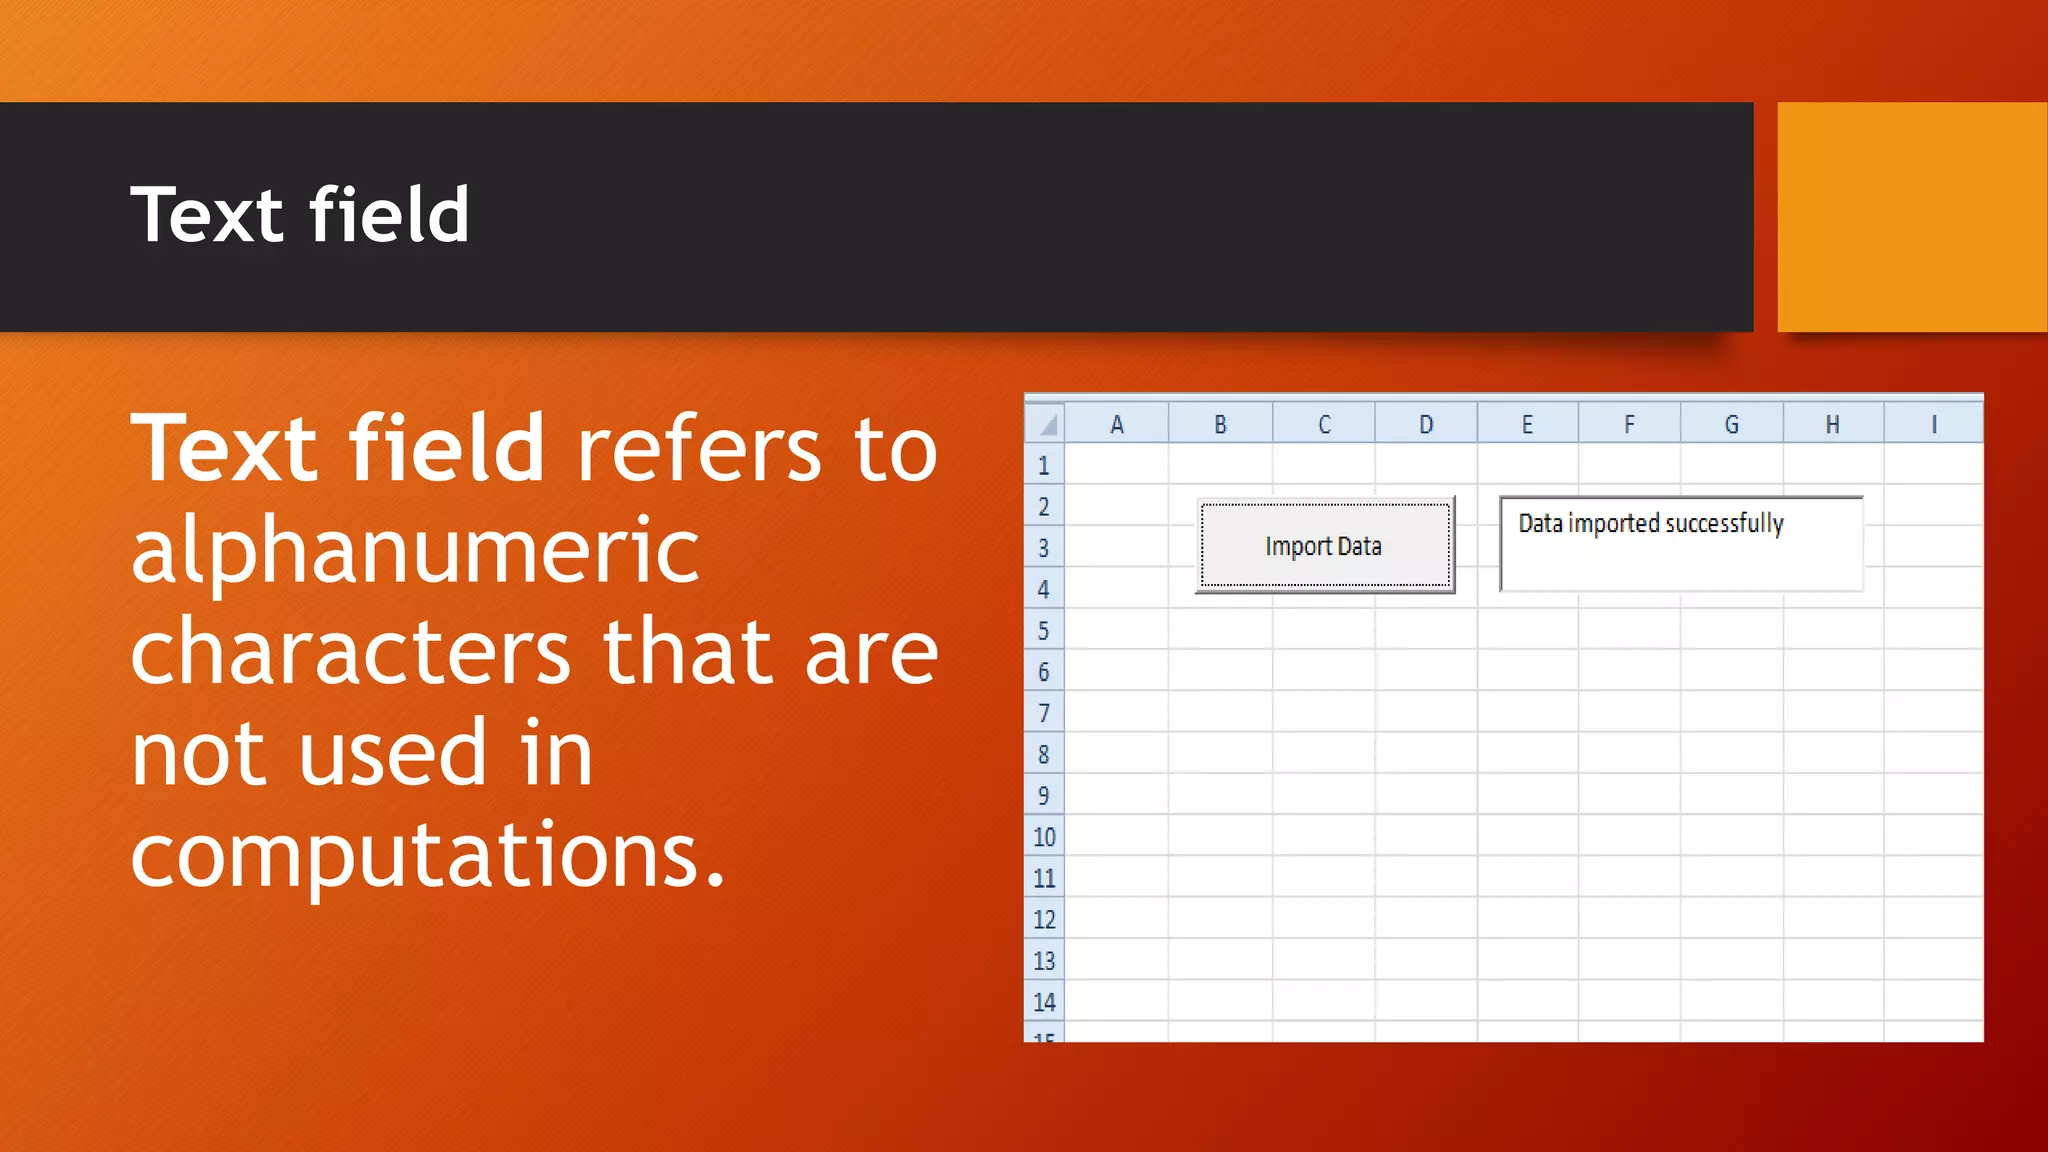
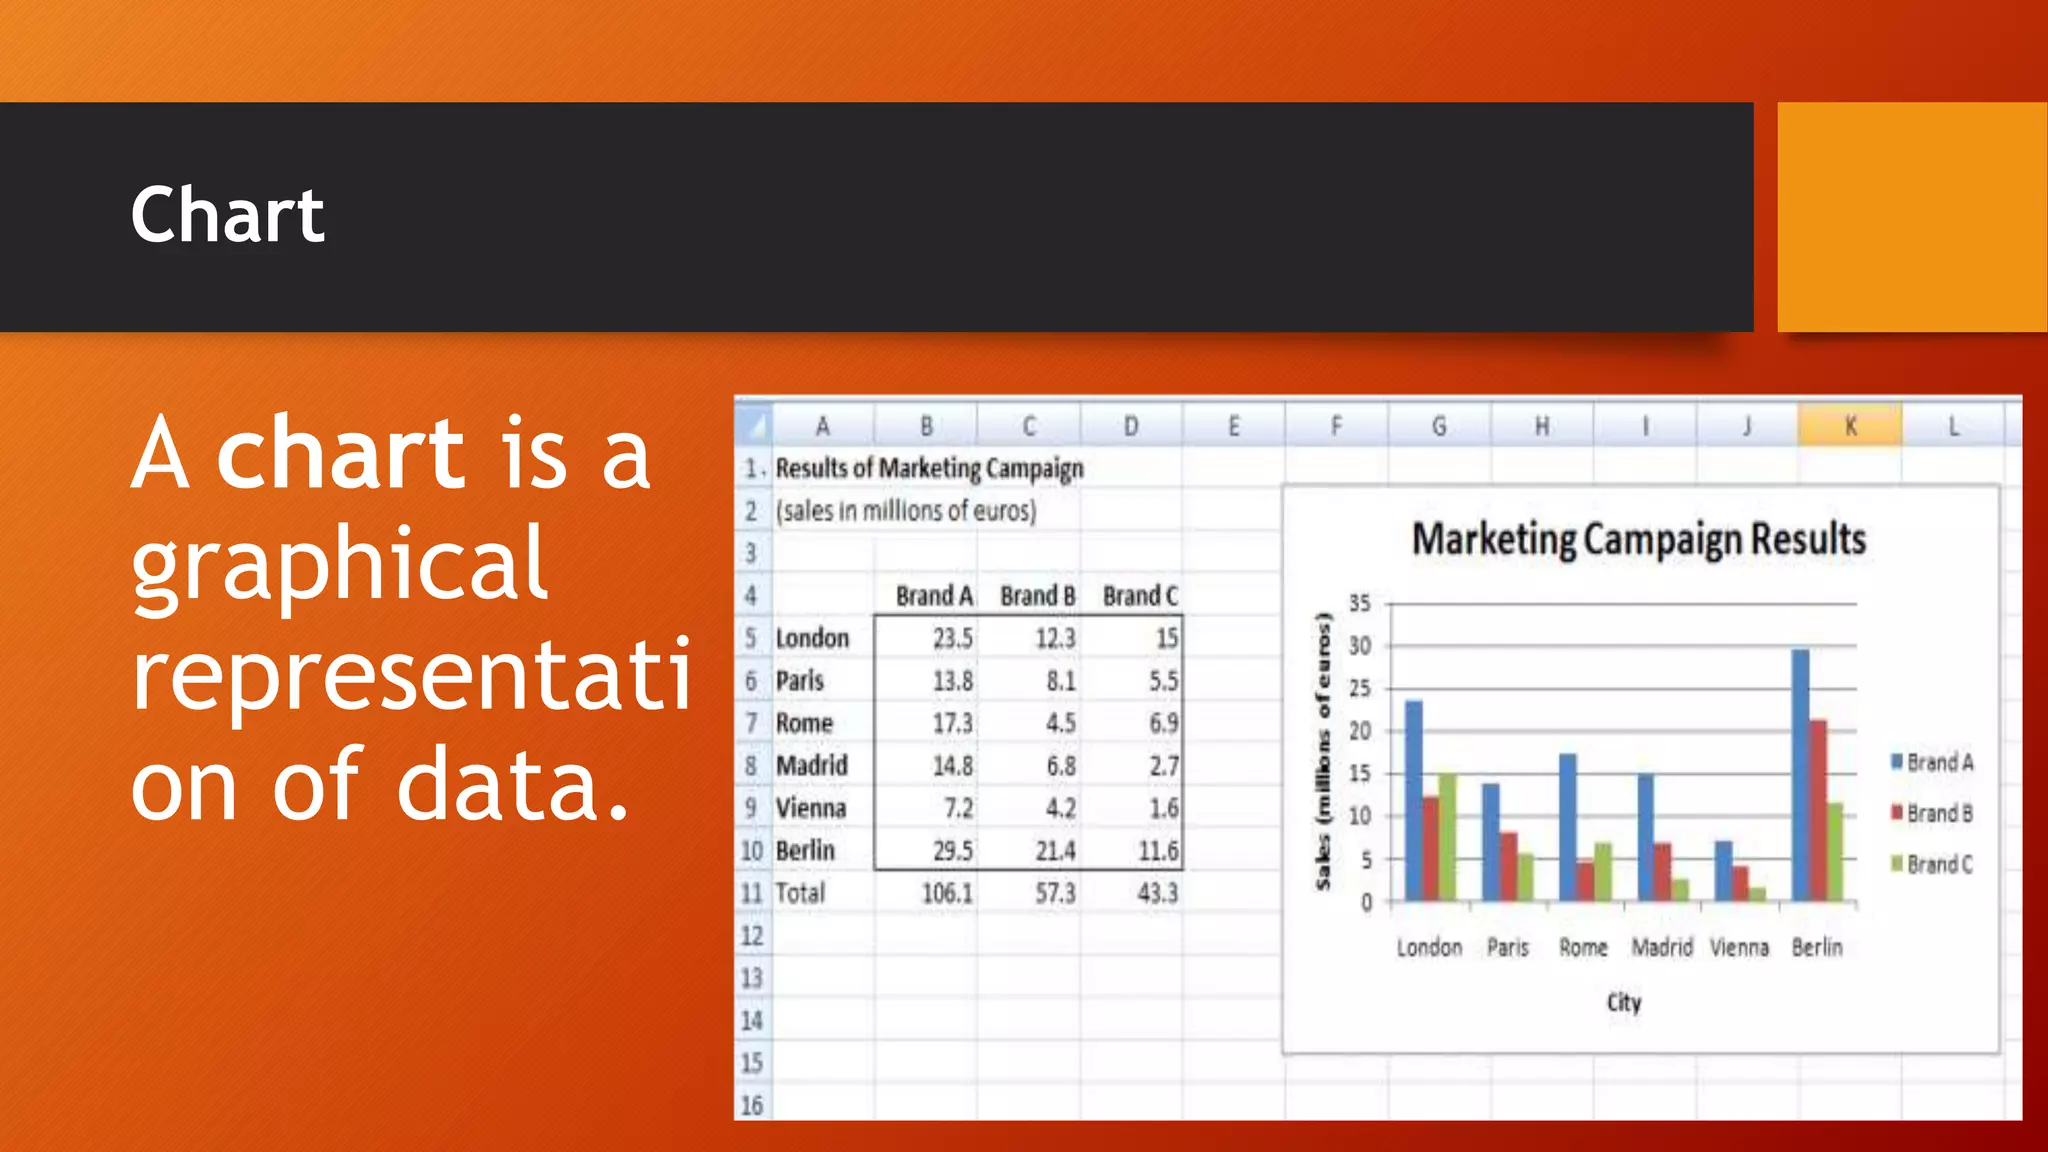
Microsoft Excel
Grade 5 Computer
Microsoft Excel
Microsoft Excel is part of the Microsoft Office Suite that can do
more than you create a table.
Spreadsheet
is a productive tool for
creating, calculating,
manipulating, and
analyzing, and
analyzing numeric
data.
Workbook
A document
created using a
spreadsheet
program.
Worksheet
You can create a
workbook from
one or more
sheets of data
called
worksheet.
Google Sheets
Google Sheets is a
spreadsheet
program that uses
colorful charts and
graphs.
OpenOffice Calc
OpenOffice Calc is
spreadsheet program
that can support most
of the features in
Microsoft Excel.
Title Bar
Title Bar contains the
Quick Access Toolbar,
Title of the workbook,
and the Minimize,
Maximize/Restore, ang
Close Buttons.
Menu Bar
Menu Bar displays the sets of commands or menu categories.
Toolbars
Toolbars
displays the sets
of commands
for a menu
button.
Worksheet Area
Worksheet Area is the
area that holds your
document. It contains
rows (numbered) and
columns (lettered)
where you can type
your data.
Cell
The
intersection of
a row and a
column is
called cell.
Gridlines
Each cell is labeled
using the format
<column><row>. The
worksheet area
contains gridlines
instead of rules.
Formula Bar
Formula Bar shows
the contents of an
active cell. It contains
the Name Box, the
Formula text box, and
the Cancel, Edit and
Function Buttons.
Status Bar
Status Bar is found at
the bottom part of the
worksheet. It contains
the zoom level and view
options. It shows when it
is ready to take
commands.
Budgeting
Budgeting is a
process of
creating a plan
to spend your
money.
Function
A function is a
command that takes a
value or values,
calculates them
automatically, and
returns a result.
Formula
A formula is a general
rule or principle
expressed using
mathematical symbols
such as functions,
operators, and
operands.
Range of cells
A range of cells is
a series of cells
starting at one cell
and ending at
another.
AutoSum
The AutoSum command
uses the Greek letter ∑.
If this icon is clicked, the
computer will add up all
the numbers above the
cell where you placed
the cursor.
Average
The average is a
number expressing the
central value in a set of
data. It can be
calculated by dividing
the sum of the values in
the set by the number
of values in the set.
Table
A table is a
complete
collection of
information.
Field
Each piece
of
information
in a table is
called field.
Text field
Text field refers to
alphanumeric
characters that are
not used in
computations.
Numeric field
Numeric field refers
to numeric data used
in computations. It
includes percentages,
currency,
measurement, and
quantities.
Date fields or time field
Date fields or
time field
refers to date
or time entries.
Filtering
You can use Filtering
for selected cells to
sort or narrow down
the data. To do this,
click the Filter button
and choose how you
would like to sort or
narrow down your
data.
Chart
A chart is a
graphical
representati
on of data.
Insert menu
In the Insert
menu, there are
different kinds
of charts under
the Charts
toolbar.
Horizontal axis
A chart has the
x-axis along the
bottom called
the horizontal
axis.
Vertical Axis
The y-axis
that runs up
and down is
called the
vertical axis.
END

Grade 5 COMPUTER