Downloaded 784 times

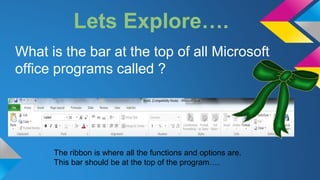


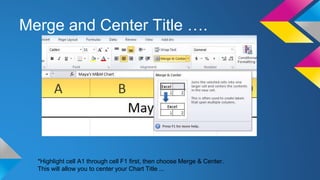

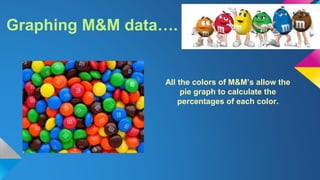
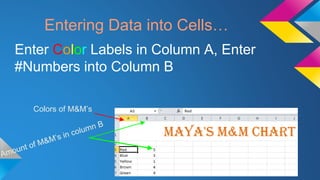


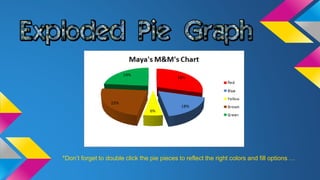

This document introduces Microsoft Excel using M&M's as a practical example to engage users. It explains basic functions like creating charts, entering data, and using the ribbon to manipulate the spreadsheet. The guide includes detailed steps for creating a pie chart to visualize the distribution of M&M colors.