1. 1QCY2010 Result Update I Pharmaceutical
May 12, 2010
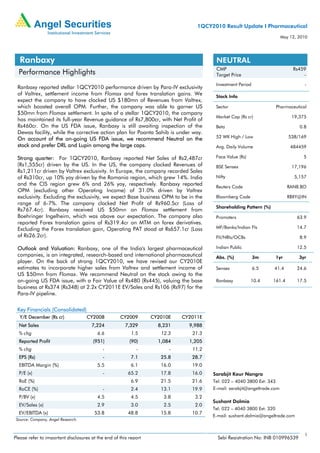
Ranbaxy NEUTRAL
CMP Rs459
Performance Highlights Target Price -
Investment Period -
Ranbaxy reported stellar 1QCY2010 performance driven by Para-IV exclusivity
of Valtrex, settlement income from Flomax and forex translation gains. We Stock Info
expect the company to have clocked US $180mn of Revenues from Valtrex,
which boosted overall OPM. Further, the company was able to garner US Sector Pharmaceutical
$50mn from Flomax settlement. In spite of a stellar 1QCY2010, the company
Market Cap (Rs cr) 19,375
has maintained its full-year Revenue guidance of Rs7,800cr, with Net Profit of
Rs460cr. On the US FDA issue, Ranbaxy is still awaiting inspection of the Beta 0.8
Dewas facility, while the corrective action plan for Poanta Sahib is under way.
On account of the on-going US FDA issue, we recommend Neutral on the 52 WK High / Low 538/169
stock and prefer DRL and Lupin among the large caps. Avg. Daily Volume 484459
Strong quarter: For 1QCY2010, Ranbaxy reported Net Sales of Rs2,487cr Face Value (Rs) 5
(Rs1,555cr) driven by the US. In the US, the company clocked Revenues of BSE Sensex 17,196
Rs1,211cr driven by Valtrex exclusivity. In Europe, the company recorded Sales
of Rs310cr, up 10% yoy driven by the Romania region, which grew 14%. India Nifty 5,157
and the CIS region grew 6% and 26% yoy, respectively. Ranbaxy reported Reuters Code RANB.BO
OPM (excluding other Operating Income) of 31.0% driven by Valtrex
exclusivity. Excluding the exclusivity, we expect Base business OPM to be in the Bloomberg Code RBXY@IN
range of 6-7%. The company clocked Net Profit of Rs960.5cr (Loss of
Shareholding Pattern (%)
Rs767.4cr). Ranbaxy received US $50mn on Flomax settlement from
Boehringer Ingelheim, which was above our expectation. The company also Promoters 63.9
reported Forex translation gains of Rs319.4cr on MTM on forex derivatives.
Excluding the Forex translation gain, Operating PAT stood at Rs657.1cr (Loss MF/Banks/Indian FIs 14.7
of Rs26.2cr). FII/NRIs/OCBs 8.9
Outlook and Valuation: Ranbaxy, one of the India's largest pharmaceutical Indian Public 12.5
companies, is an integrated, research-based and international pharmaceutical Abs. (%) 3m 1yr 3yr
player. On the back of strong 1QCY2010, we have revised our CY2010E
estimates to incorporate higher sales from Valtrex and settlement income of Sensex 6.5 41.4 24.6
US $50mn from Flomax. We recommend Neutral on the stock owing to the
on-going US FDA issue, with a Fair Value of Rs480 (Rs445), valuing the base Ranbaxy 10.4 161.4 17.5
business at Rs374 (Rs348) at 2.2x CY2011E EV/Sales and Rs106 (Rs97) for the
Para-IV pipeline.
Key Financials (Consolidated)
Y/E December (Rs cr) CY2008 CY2009 CY2010E CY2011E
Net Sales 7,224 7,329 8,231 9,988
% chg 6.6 1.5 12.3 21.3
Reported Profit (951) (90) 1,084 1,205
% chg - - - 11.2
EPS (Rs) - 7.1 25.8 28.7
EBITDA Margin (%) 5.5 6.1 16.0 19.0
P/E (x) - 65.2 17.8 16.0 Sarabjit Kour Nangra
RoE (%) 6.9 21.5 21.6 Tel: 022 – 4040 3800 Ext: 343
RoCE (%) - 2.4 13.1 19.9 E-mail: sarabjit@angeltrade.com
P/BV (x) 4.5 4.5 3.8 3.2
Sushant Dalmia
EV/Sales (x) 2.9 3.0 2.5 2.0
Tel: 022 – 4040 3800 Ext: 320
EV/EBITDA (x) 53.8 48.8 15.8 10.7
E-mail: sushant.dalmia@angeltrade.com
Source: Company, Angel Research.
1
Please refer to important disclosures at the end of this report Sebi Registration No: INB 010996539
2. Ranbaxy I 1QCY2010 Result Update
Exhibit 1: 1QCY2010 Performance
Y/E Dec (Rs cr) 1QCY10 1QCY09 % chg. CY09 CY08 % chg.
Net Sales 2,487 1,555 59.9 7,329 7,224 1.5
Other Income 450.0 (59.3) 710.5 (300.0) (336.8)
Total Income 2,937 1,496 96.4 8,040 6,924 16.1
Core PBIDT 771.3 (20.0) - 444.8 394.3 -
Core Operating Margin 31.0 (1.3) - 6.1 5.5 -
Interest 24.8 24.6 0.8 71.0 205.5 (65.4)
Depreciation & Amortisation 100.5 63.9 57.3 267.6 282.5 (5.3)
PBT & Exceptional Items 1,096 (168) - 817 (394) -
Forex gain/(Loss) 319 (1,003) - 193 1,106 (82.5)
Profit before tax 1,415 (1,171) - 624 (1,500) -
Provision for Taxation 452.4 (410.1) - 699.1 (565.1) -
Minority & Share of Associate (2.6) (6.3) - 14.2 16.3 -
Net Profit 960.5 (767.4) - (89.8) (951.2) (90.6)
EPS (Rs) 22.8 - 7.1 -
Source: Company, Angel Research
Key Highlights
Revenue beats expectation, driven by Valtrex: For 1QCY2010, Ranbaxy reported
Net Sales of Rs2,487cr (Rs1,555cr), up 59.9% driven by the US region. In the US,
the company clocked Revenues of Rs1,211cr driven by Valtrex exclusivity. We expect
Valtrex to have contributed US $180mn during the quarter as there was no
Authorised Generic (AG) competition in the market. The product is expected to
continue to contribute significantly in 2QCY2010 as well, as exclusivity for the
product ends in May 2010. The company also launched the AG version of
Oxycodone ER tablets during the quarter, which is likely to be a limited opportunity
for the company. In Europe, the company recorded Sales of Rs310cr, up 10% yoy
driven by the Romania region, which grew 14%. The company expects Romania to
be on growth trajectory following the cost rationalisation exercise taken last year and
strong growth in the OTC Segment. Ranbaxy also stated that they are profitable in
most of the EU region including Germany.
In India, the company booked Revenues of Rs345.2cr, up 6.0% yoy. However,
excluding the one-ff tender sales in 1QCY2009, Revenues grew 15%. For project
‘Viraat’, the company increased the field force and entered into new therapeutic
segments, which will result in 15-20% growth in the Domestic Formulations Segment
from 3QCY2010 onwards. In CIS, Revenues came in at Rs110cr, up 26% yoy. The
company indicated that the pricing issue in Russia has partly played out without
significantly affecting the company’s Revenues.
On the APAC (excl India) front, the company clocked Revenue of Rs66.2cr, which
de-grew by 38.0% yoy following the restructuring done in the Vietnam and China
region. The company expects the Japan market to be one of its key growth drivers in
the long term and would develop, manufacture and supply product to the newly
formed company by Daiichi Sankyo, viz. Daiichi Sankyo Espha Co. Ltd, to market
generic products.
May 12, 2010 2
3. Ranbaxy I 1QCY2010 Result Update
Exhibit 2: 1QFY2010 Sales buoyed by US region
2,500
267
2,000 176
228
277 345
1,500
Rs cr
252 280 333 310
207
202 187 273
1,000 377
330 396
362
287 314 1,211
500 327 833
410 385 296
0
1QCY2009 2QCY2009 3QCY2009 4QCY2010 1QCY2010
North America Europe India Asia Pac & CIS RoW
Source: Company, Angel Research
Improvement in Base business OPM: Ranbaxy reported OPM (excluding Other
Operating Income) of 31.0% driven by Valtrex exclusivity. Excluding the exclusivity,
we expect the Base business OPM to be in the range of 6-7%, which has seen an
overall improvement owing to cost restructuring across various geographies and
strong growth in the Europe and CIS region.
Bottom-line driven by Exclusivity, Operating Income and Forex gains: The company
clocked Net Profit of Rs960.5cr (Loss of Rs767.3cr). Ranbaxy received US $50mn
on Flomax settlement from Boehringer Ingelheim, which was above our expectation.
The company also reported Forex translation gains of Rs319.4cr on MTM on forex
derivatives. Excluding the forex translation gains, Operating PAT came in at a strong
Rs657.1cr (Loss of Rs26.2cr).
Other Takeaways
• The company maintained its Revenue guidance of Rs7,800cr with Net Profit of
Rs460cr for CY2010, in spite of the stellar 1QCY2010 performance
• On the US FDA and DoJ issue, the company has stated that
re-inspection of Dewas by US FDA is still pending with Corrective Action
Plan (CAP) for Gloversville is in process for submission, while CAP is still
under implementation at Poanta Sahib facility.
• Ranbaxy has settled patent litigation with Takeda Pharmaceutical on the
generic version of Actos (Pioglitazone Hydrochloride) enabling the
company to launch the drug with shared exclusivity in August 2012.
Actos had US $3.4 billion in brand sales for the twelve months ended
December 31, 2009.
May 12, 2010 3
4. Ranbaxy I 1QCY2010 Result Update
Outlook and Valuation
Ranbaxy, one of the India's largest pharmaceutical companies, is an integrated,
research based international pharmaceutical players. For 2009, the company
recorded Global Sales of US $1,519 mn. The company has a balanced mix of
Revenues from Emerging and Developed markets that contribute 54% and 39%,
respectively. In June 2008, Ranbaxy was acquired by one of the largest Japanese
innovator companies, Daiichi Sankyo, to create an innovator and generic
pharmaceutical powerhouse. The combined entity now ranks among the Top-20
pharmaceutical companies, globally.
Post the strong 1QCY2010 results, we have primarily revised our CY2010 estimates
to incorporate higher sales from Valtrex and settlement income of US$50mn from
Flomax. We recommend Neutral on the stock on account of the US FDA issue
continuing, with a Fair Value of Rs480 (Rs445), valuing the base business at Rs374
(Rs348) at 2.2x CY2011E EV/Sales and Rs106 (Rs97) per share for the Para-IV
pipeline incorporating higher value for Valtrex and Actos in our Para-IV pipeline.
Exhibit 3: One-year forward EV/Sales Band
35,000
4.0x
30,000
25,000 3.0x
EV (Rs cr)
20,000
2.0x
15,000
10,000
1.0x
5,000
0
Apr-05
Apr-06
Apr-07
Apr-08
Apr-09
Apr-10
Oct-05
Oct-06
Oct-07
Oct-08
Oct-09
Jul-05
Jul-06
Jul-07
Jul-08
Jul-09
Jan-06
Jan-07
Jan-08
Jan-09
Jan-10
Source: C-line, Angel Research
May 12, 2010 4
8. Ranbaxy I 1QCY2010 Result Update
Research Team Tel: 022- 4040 3800 E-mail: research@angeltrade.com Website: www.angeltrade.com
DISCLAIMER
This document is solely for the personal information of the recipient, and must not be singularly used as the basis of any investment decision. Nothing in this
document should be construed as investment or financial advice. Each recipient of this document should make such investigations as they deem necessary to
arrive at an independent evaluation of an investment in the securities of the companies referred to in this document (including the merits and risks involved),
and should consult their own advisors to determine the merits and risks of such an investment.
Angel Securities Limited, its affiliates, directors, its proprietary trading and investment businesses may, from time to time, make investment decisions that are
inconsistent with or contradictory to the recommendations expressed herein. The views contained in this document are those of the analyst, and the company
may or may not subscribe to all the views expressed within.
Reports based on technical and derivative analysis center on studying charts of a stock's price movement, outstanding positions and trading volume, as
opposed to focusing on a company's fundamentals and, as such, may not match with a report on a company's fundamentals.
The information in this document has been printed on the basis of publicly available information, internal data and other reliable sources believed to be true,
and is for general guidance only. Angel Securities Limited has not independently verified all the information contained within this document. Accordingly, we
cannot testify, nor make any representation or warranty, express or implied, to the accuracy, contents or data contained within this document. While Angel
Securities Limited endeavours to update on a reasonable basis the information discussed in this material, there may be regulatory, compliance, or other
reasons that prevent us from doing so.
This document is being supplied to you solely for your information, and its contents, information or data may not be reproduced, redistributed or passed on,
directly or indirectly.
Angel Securities Limited and its affiliates may seek to provide or have engaged in providing corporate finance, investment banking or other advisory services
in a merger or specific transaction to the companies referred to in this report, as on the date of this report or in the past.
Neither Angel Securities Limited, nor its directors, employees or affiliates shall be liable for any loss or damage that may arise from or in connection with the
use of this information.
Note: Please refer to the important `Stock Holding Disclosure' report on the Angel website (Research Section).
Disclosure of Interest Statement Ranbaxy
1. Analyst ownership of the stock No
2. Angel and its Group companies ownership of the stock No
3. Angel and its Group companies’ Directors ownership of the stock No
4. Broking relationship with company covered No
Note: We have not considered any Exposure below Rs 1 lakh for Angel and its Group companies.
Address: Acme Plaza, ‘A’ Wing, 3rd Floor, M.V. Road, Opp. Sangam Cinema, Andheri (E), Mumbai - 400 059.
Tel : (022) 3952 4568 / 4040 3800
Angel Broking Ltd: BSE Sebi Regn No : INB 010996539 / CDSL Regn No: IN - DP - CDSL - 234 - 2004 / PMS Regn Code: PM/INP000001546 Angel Securities Ltd:BSE: INB010994639/INF010994639 NSE:
INB230994635/INF230994635 Membership numbers: BSE 028/NSE:09946
Angel Capital & Debt Market Ltd: INB 231279838 / NSE FNO: INF 231279838 / NSE Member code -12798 Angel Commodities Broking (P) Ltd: MCX Member ID: 12685 / FMC Regn No: MCX / TCM /
CORP / 0037 NCDEX : Member ID 00220 / FMC Regn No: NCDEX / TCM / CORP / 0302
May 12, 2010 8