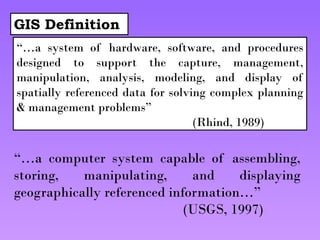
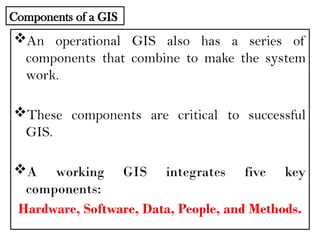
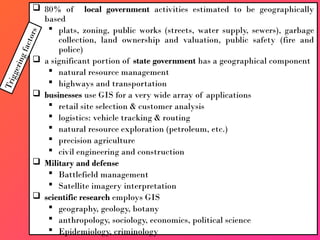
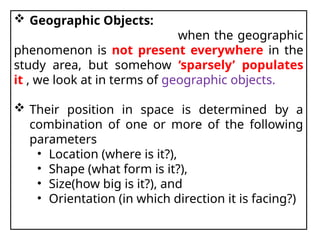
Example of GIS Applications
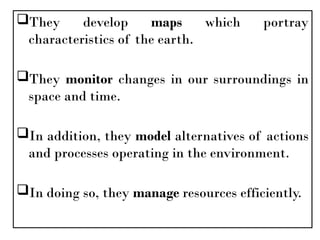
Environmental Studies: Monitoring deforestation, climate change impacts.
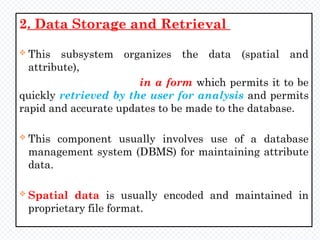
Urban Planning: Designing roads, water supply, and housing.
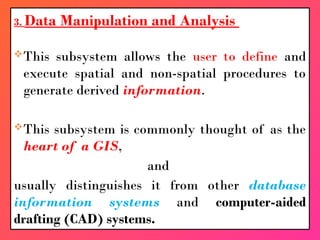
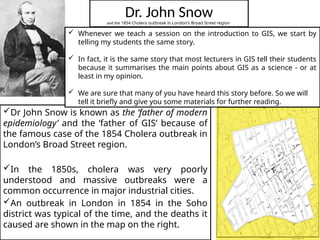
Health: Tracking disease outbreaks (e.g., mapping COVID-19 cases).
Agriculture: Precision farming, crop monitoring.
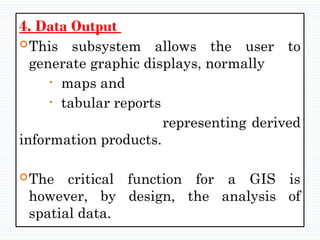
Disaster Management: Flood risk mapping, earthquake preparedness.
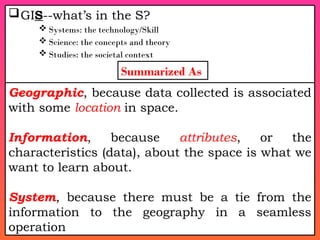
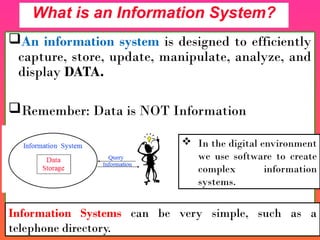
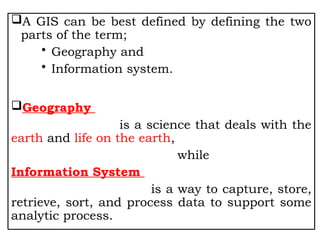
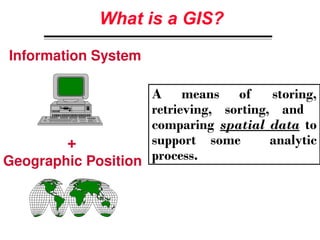
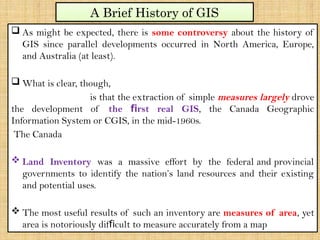
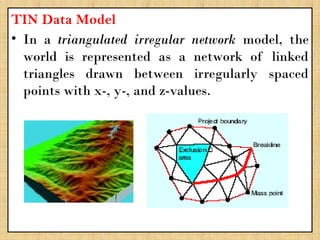
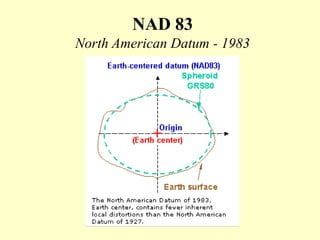
A Geographic Information System (GIS) is a technological framework that allows users to capture, store, manipulate, analyze, and visualize geographic data. Unlike traditional maps, GIS is dynamic: it integrates location (spatial data) with descriptive information (attribute data), enabling users to perform complex analyses and generate insights that support decision-making across multiple fields.
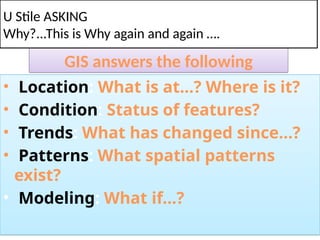
GIS is not just software—it’s a system that combines data, tools, and human expertise to answer questions such as:
Where is a feature located?
How are multiple features related in space?

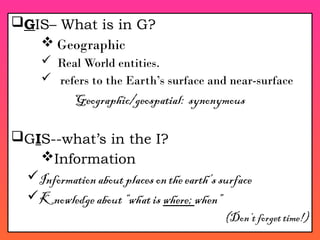
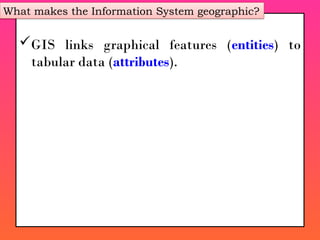
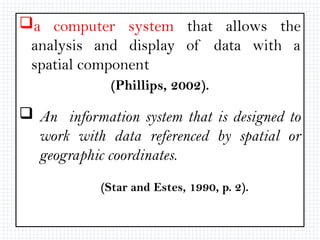
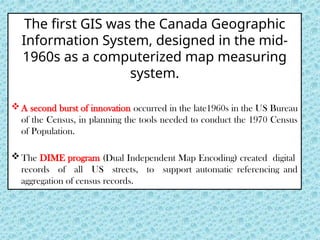
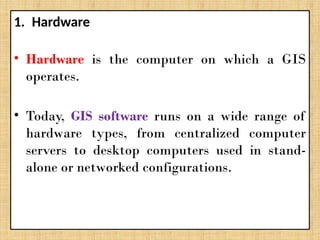
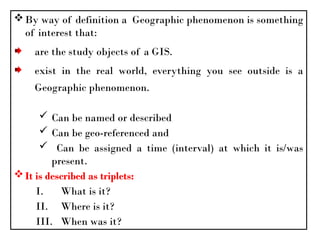
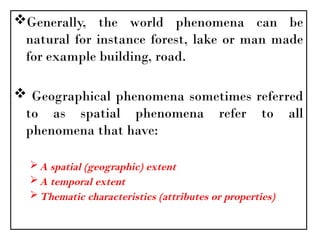
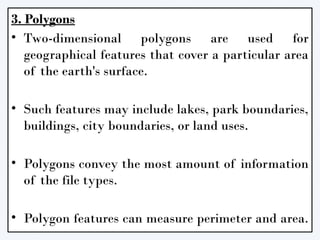
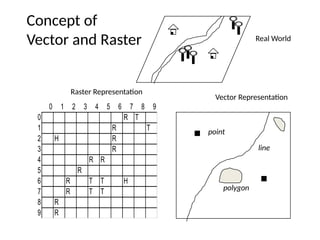
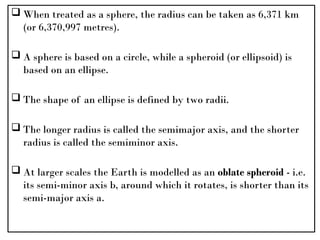
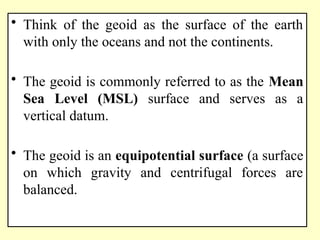
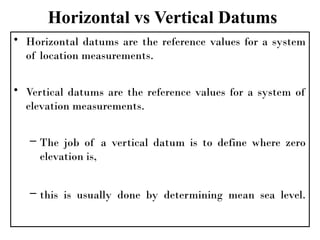
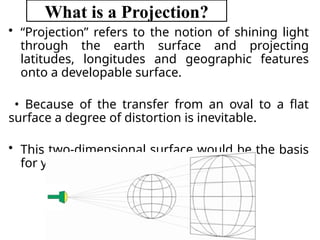
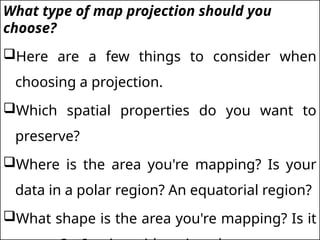
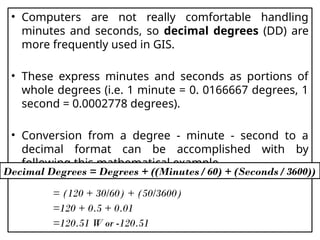
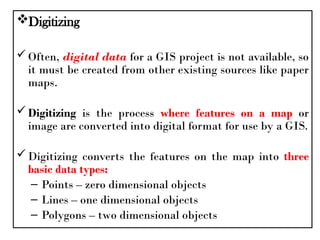
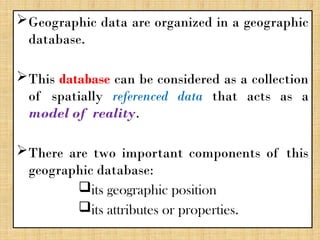
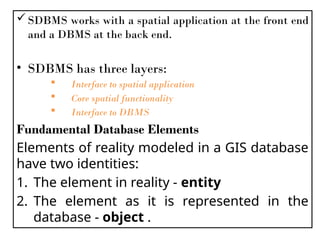
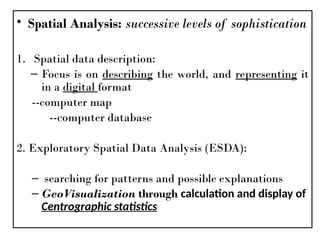
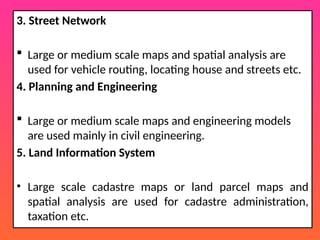
![• A coordinate is a number set that denotes a
specific location within a reference system.
• Typical coordinates are
the x-y set ([x, y]), which is used in a two-
dimensional system,
and
the x-y-z set ([x, y, z]), which is used in a three-
dimensional system.](https://image.slidesharecdn.com/geographicinformationsystemsgis-1-250828092258-e7dbcc46/85/Geographic-Information-Systems-GIS-1-pptx-66-320.jpg)


![20260201 [FOSDEM] gomodjail - library sandboxing for Go modules.pdf](https://cdn.slidesharecdn.com/ss_thumbnails/20260201fosdemgomodjail-librarysandboxingforgomodules-260201225659-76609ec4-thumbnail.jpg?width=640&height=640&fit=bounds)


![谷歌留痕技术教程[ 𝙩𝙤𝙥 𝟮𝟯𝟯. 𝙘 𝙤𝙢 ]](https://cdn.slidesharecdn.com/ss_thumbnails/top233-260130173900-2eb784f9-thumbnail.jpg?width=640&height=640&fit=bounds)


