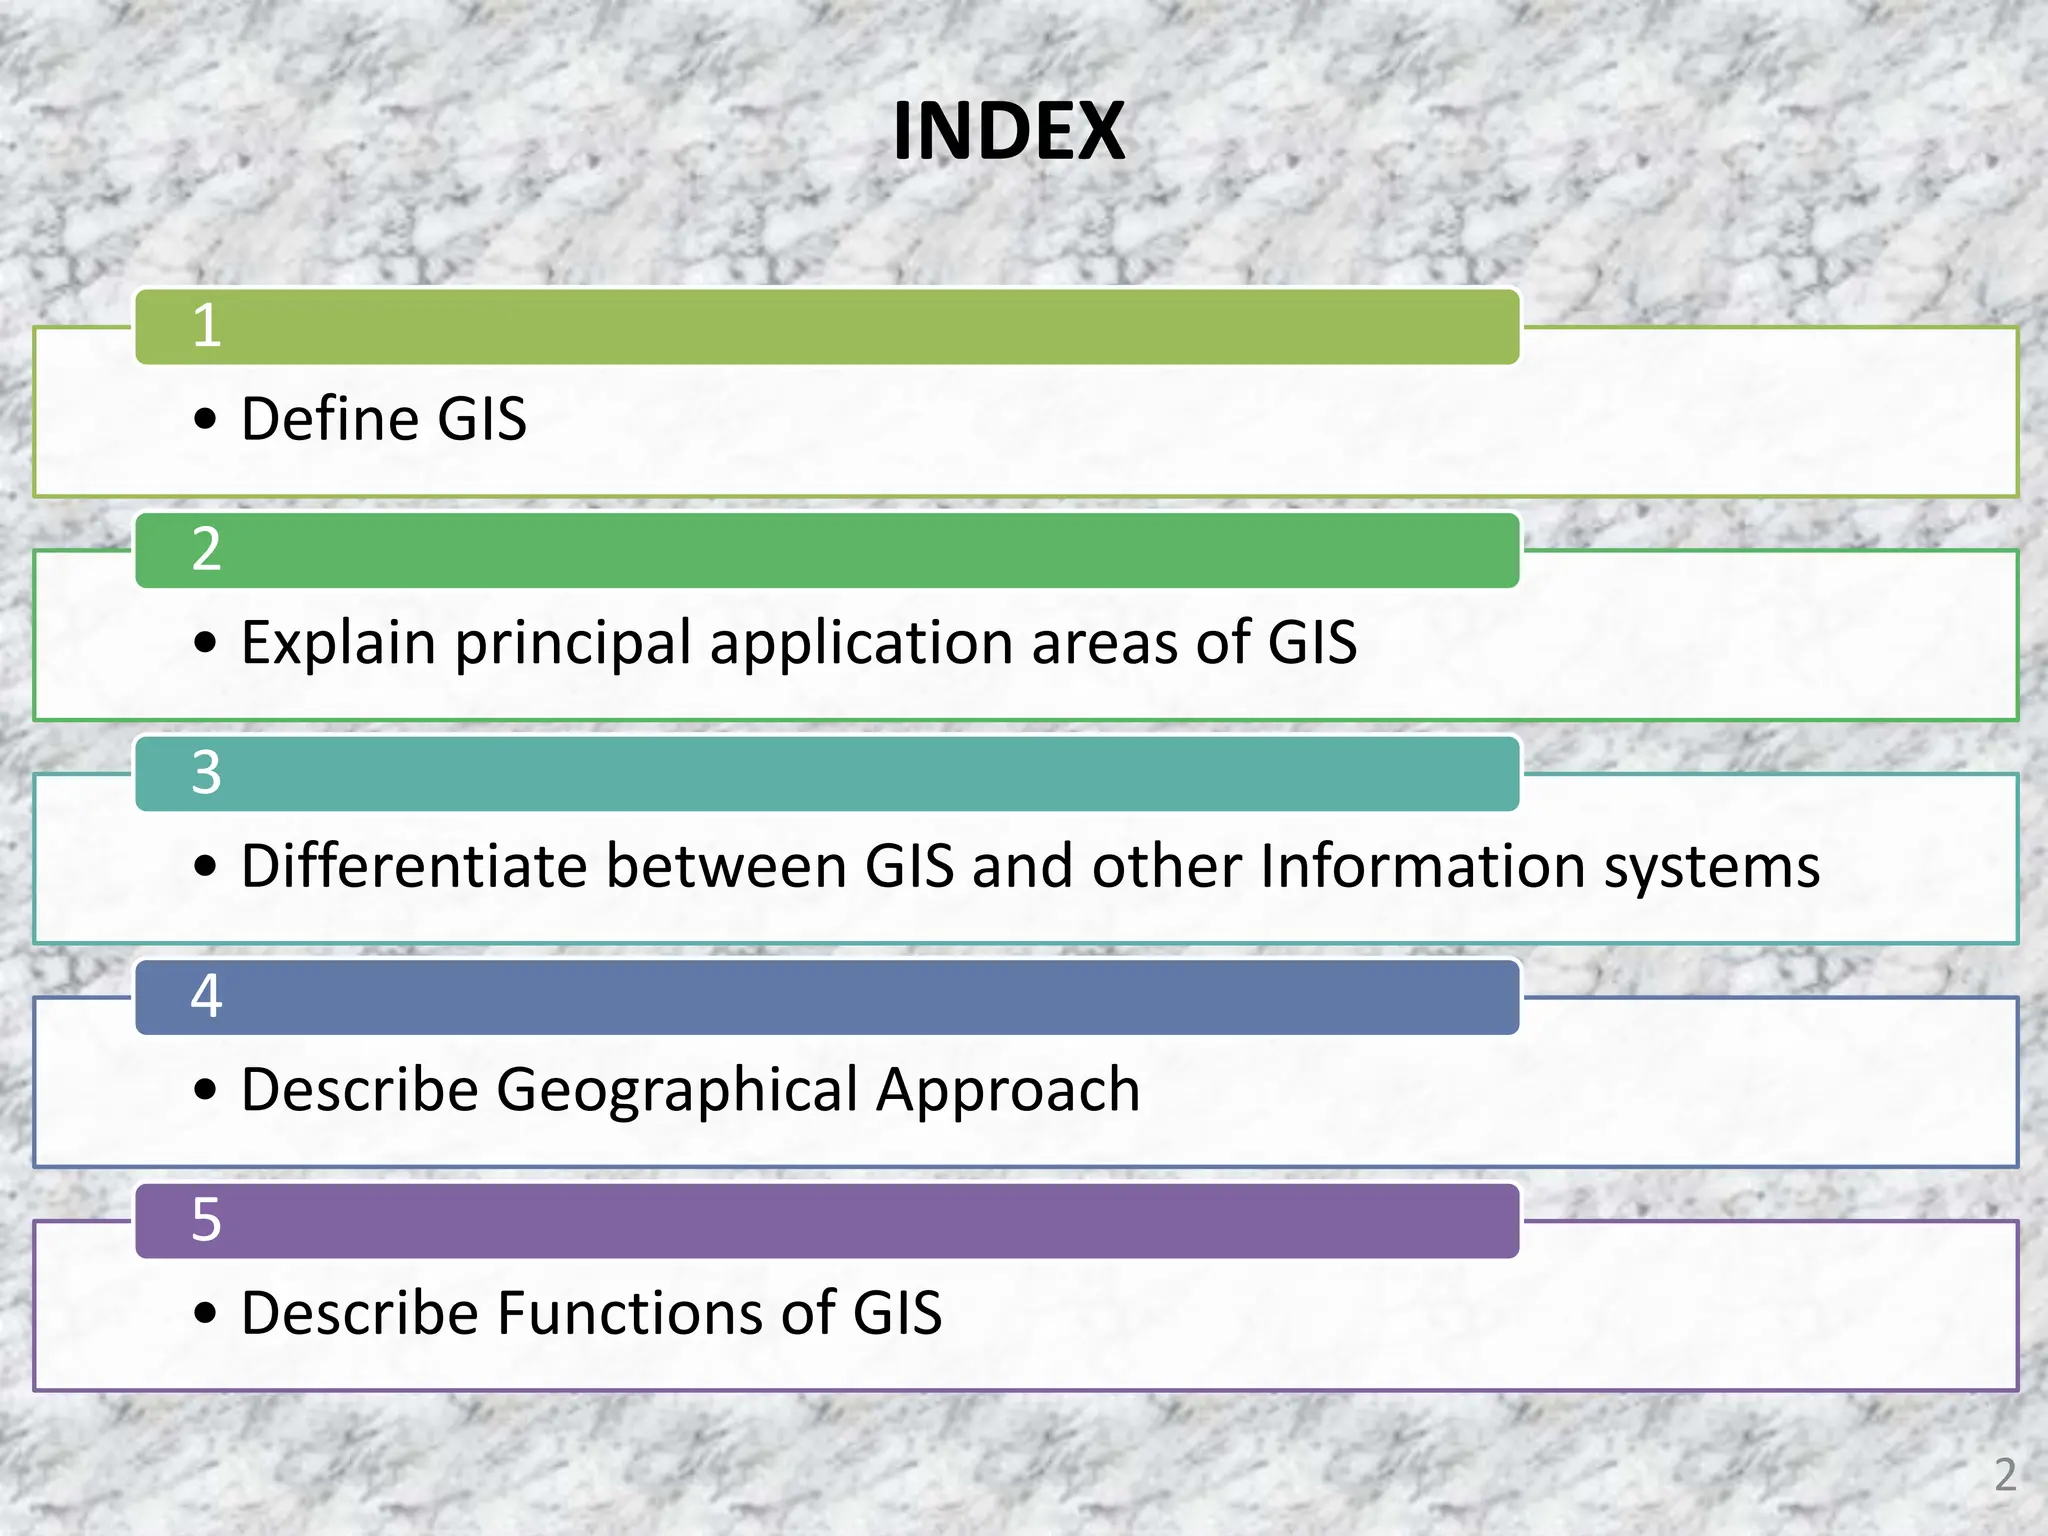
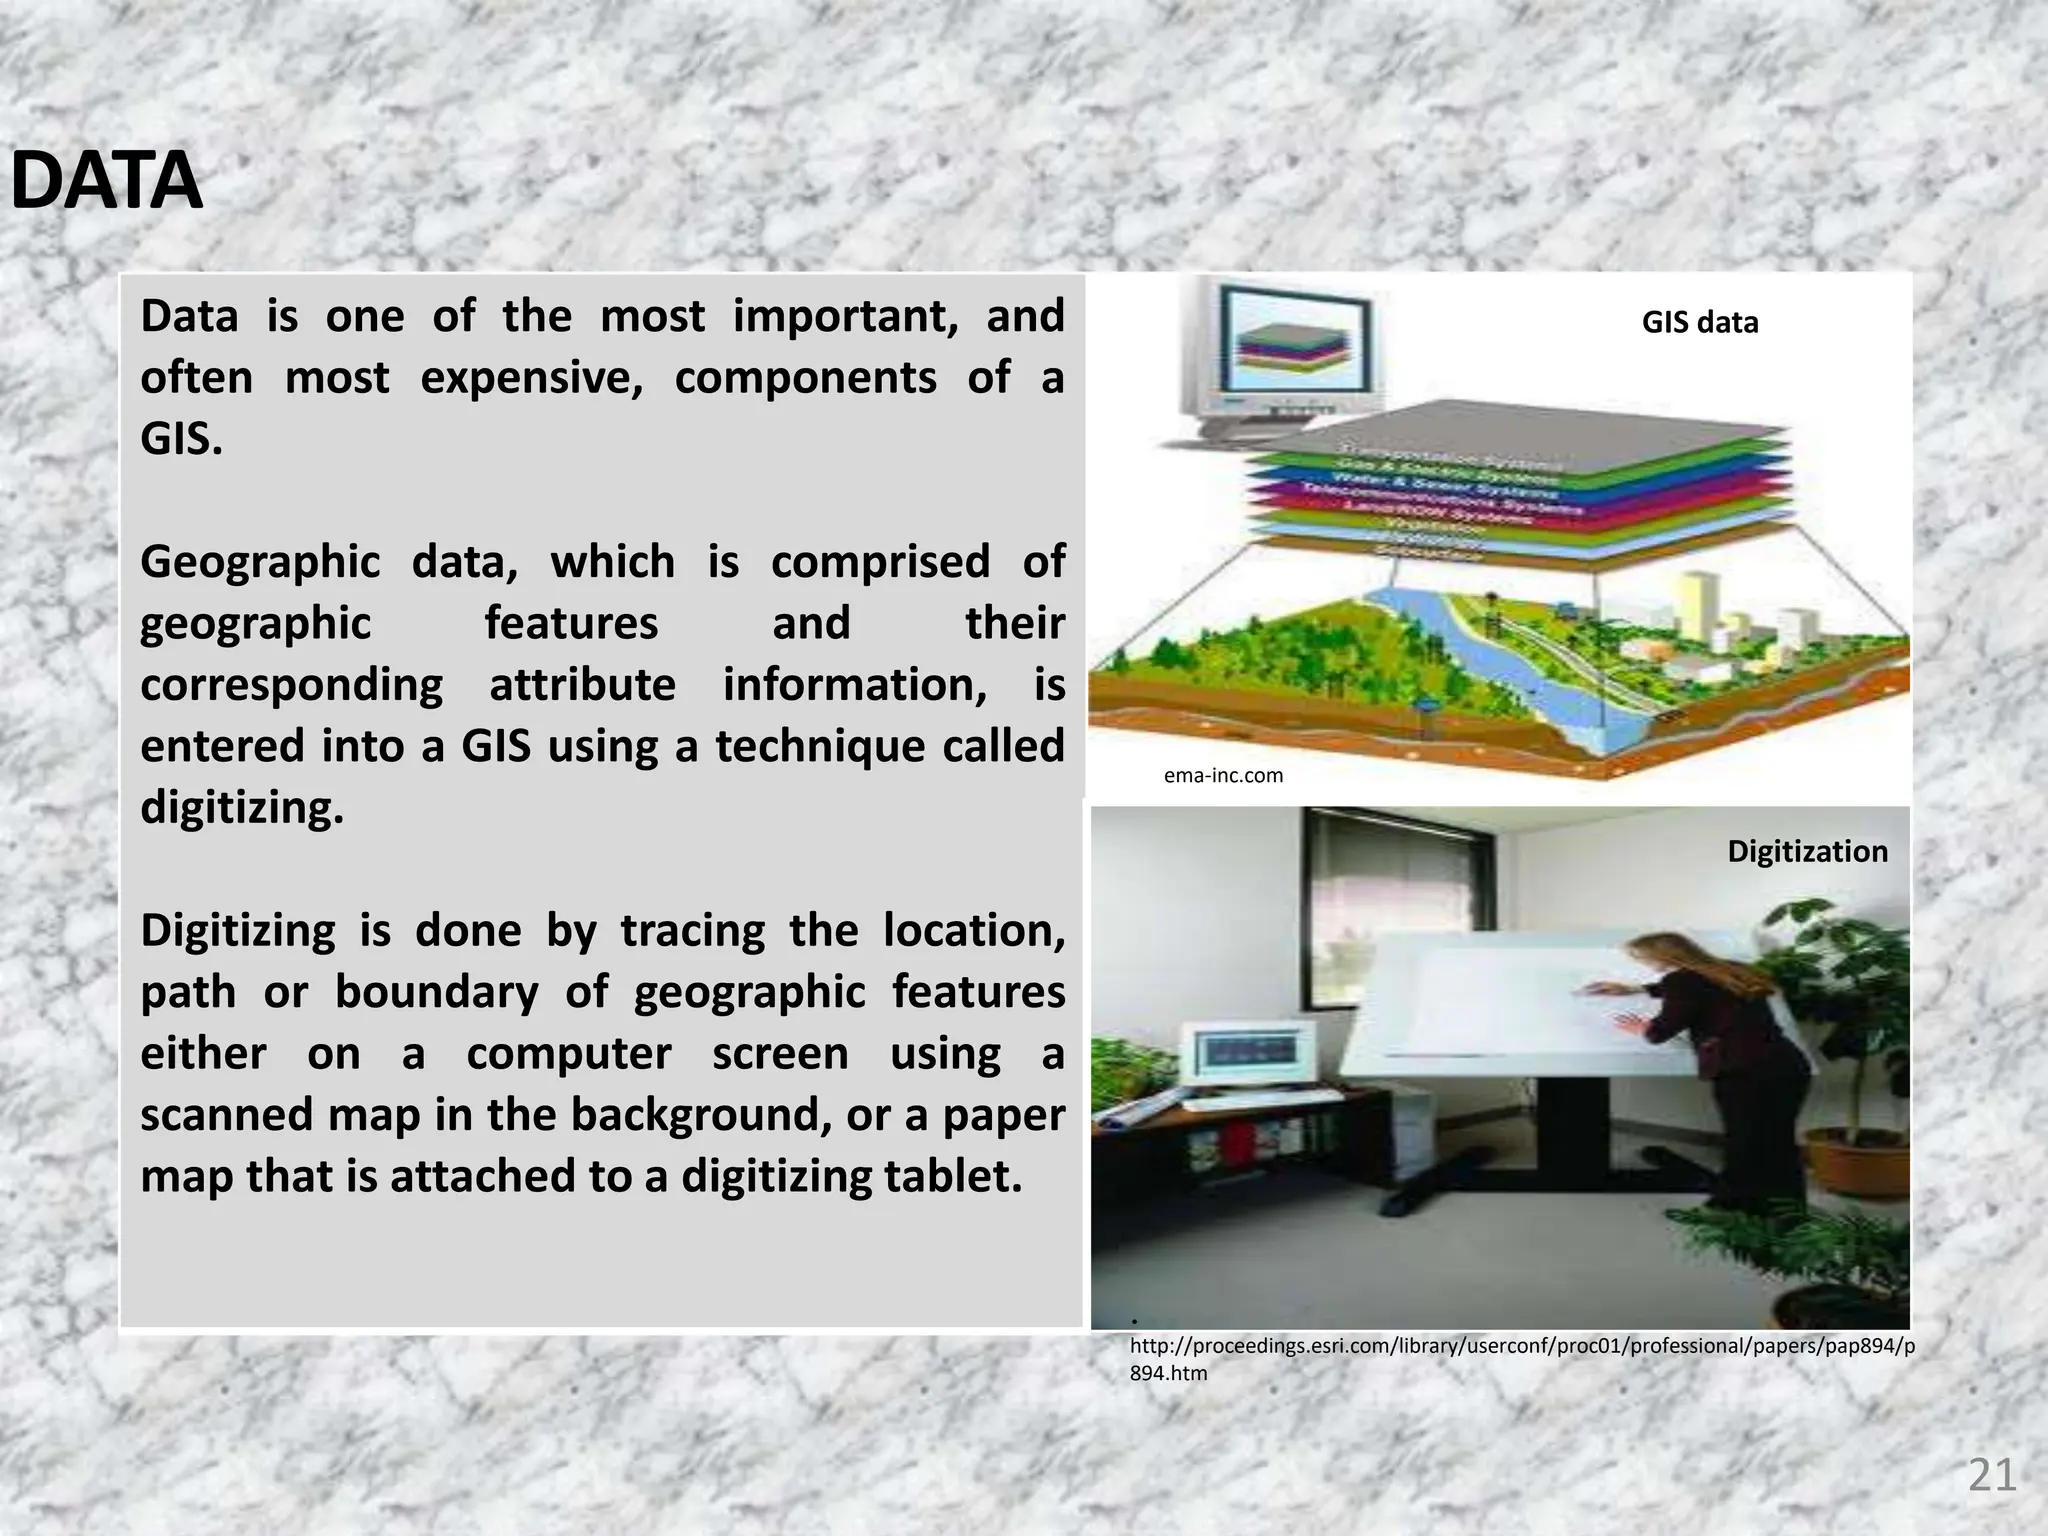
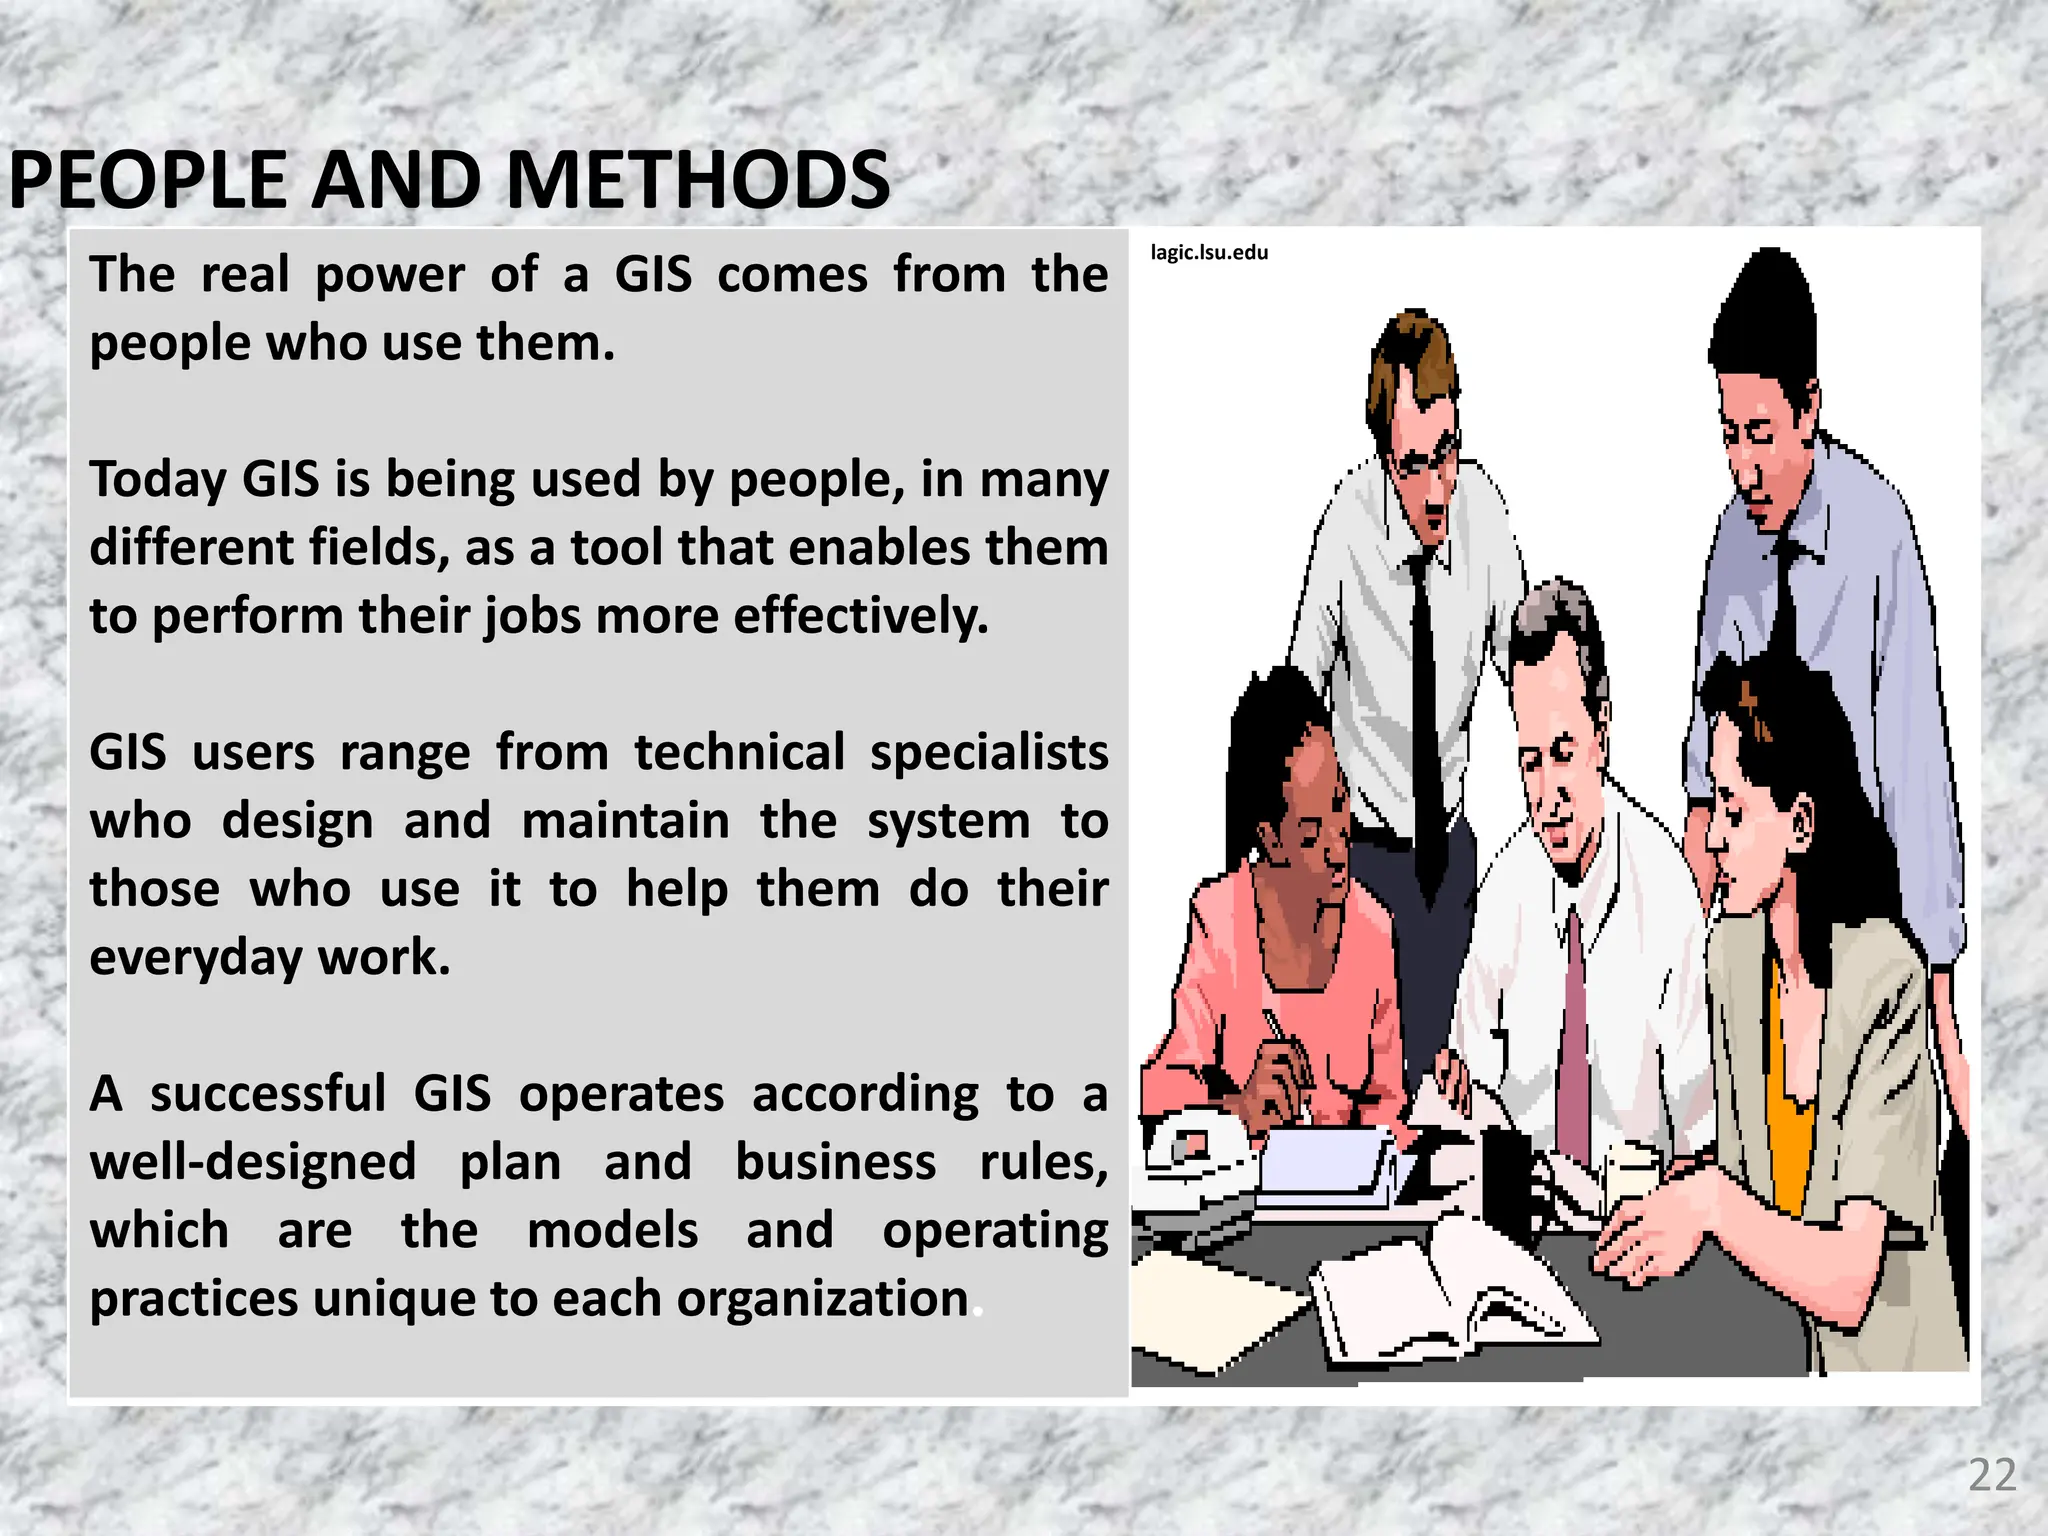
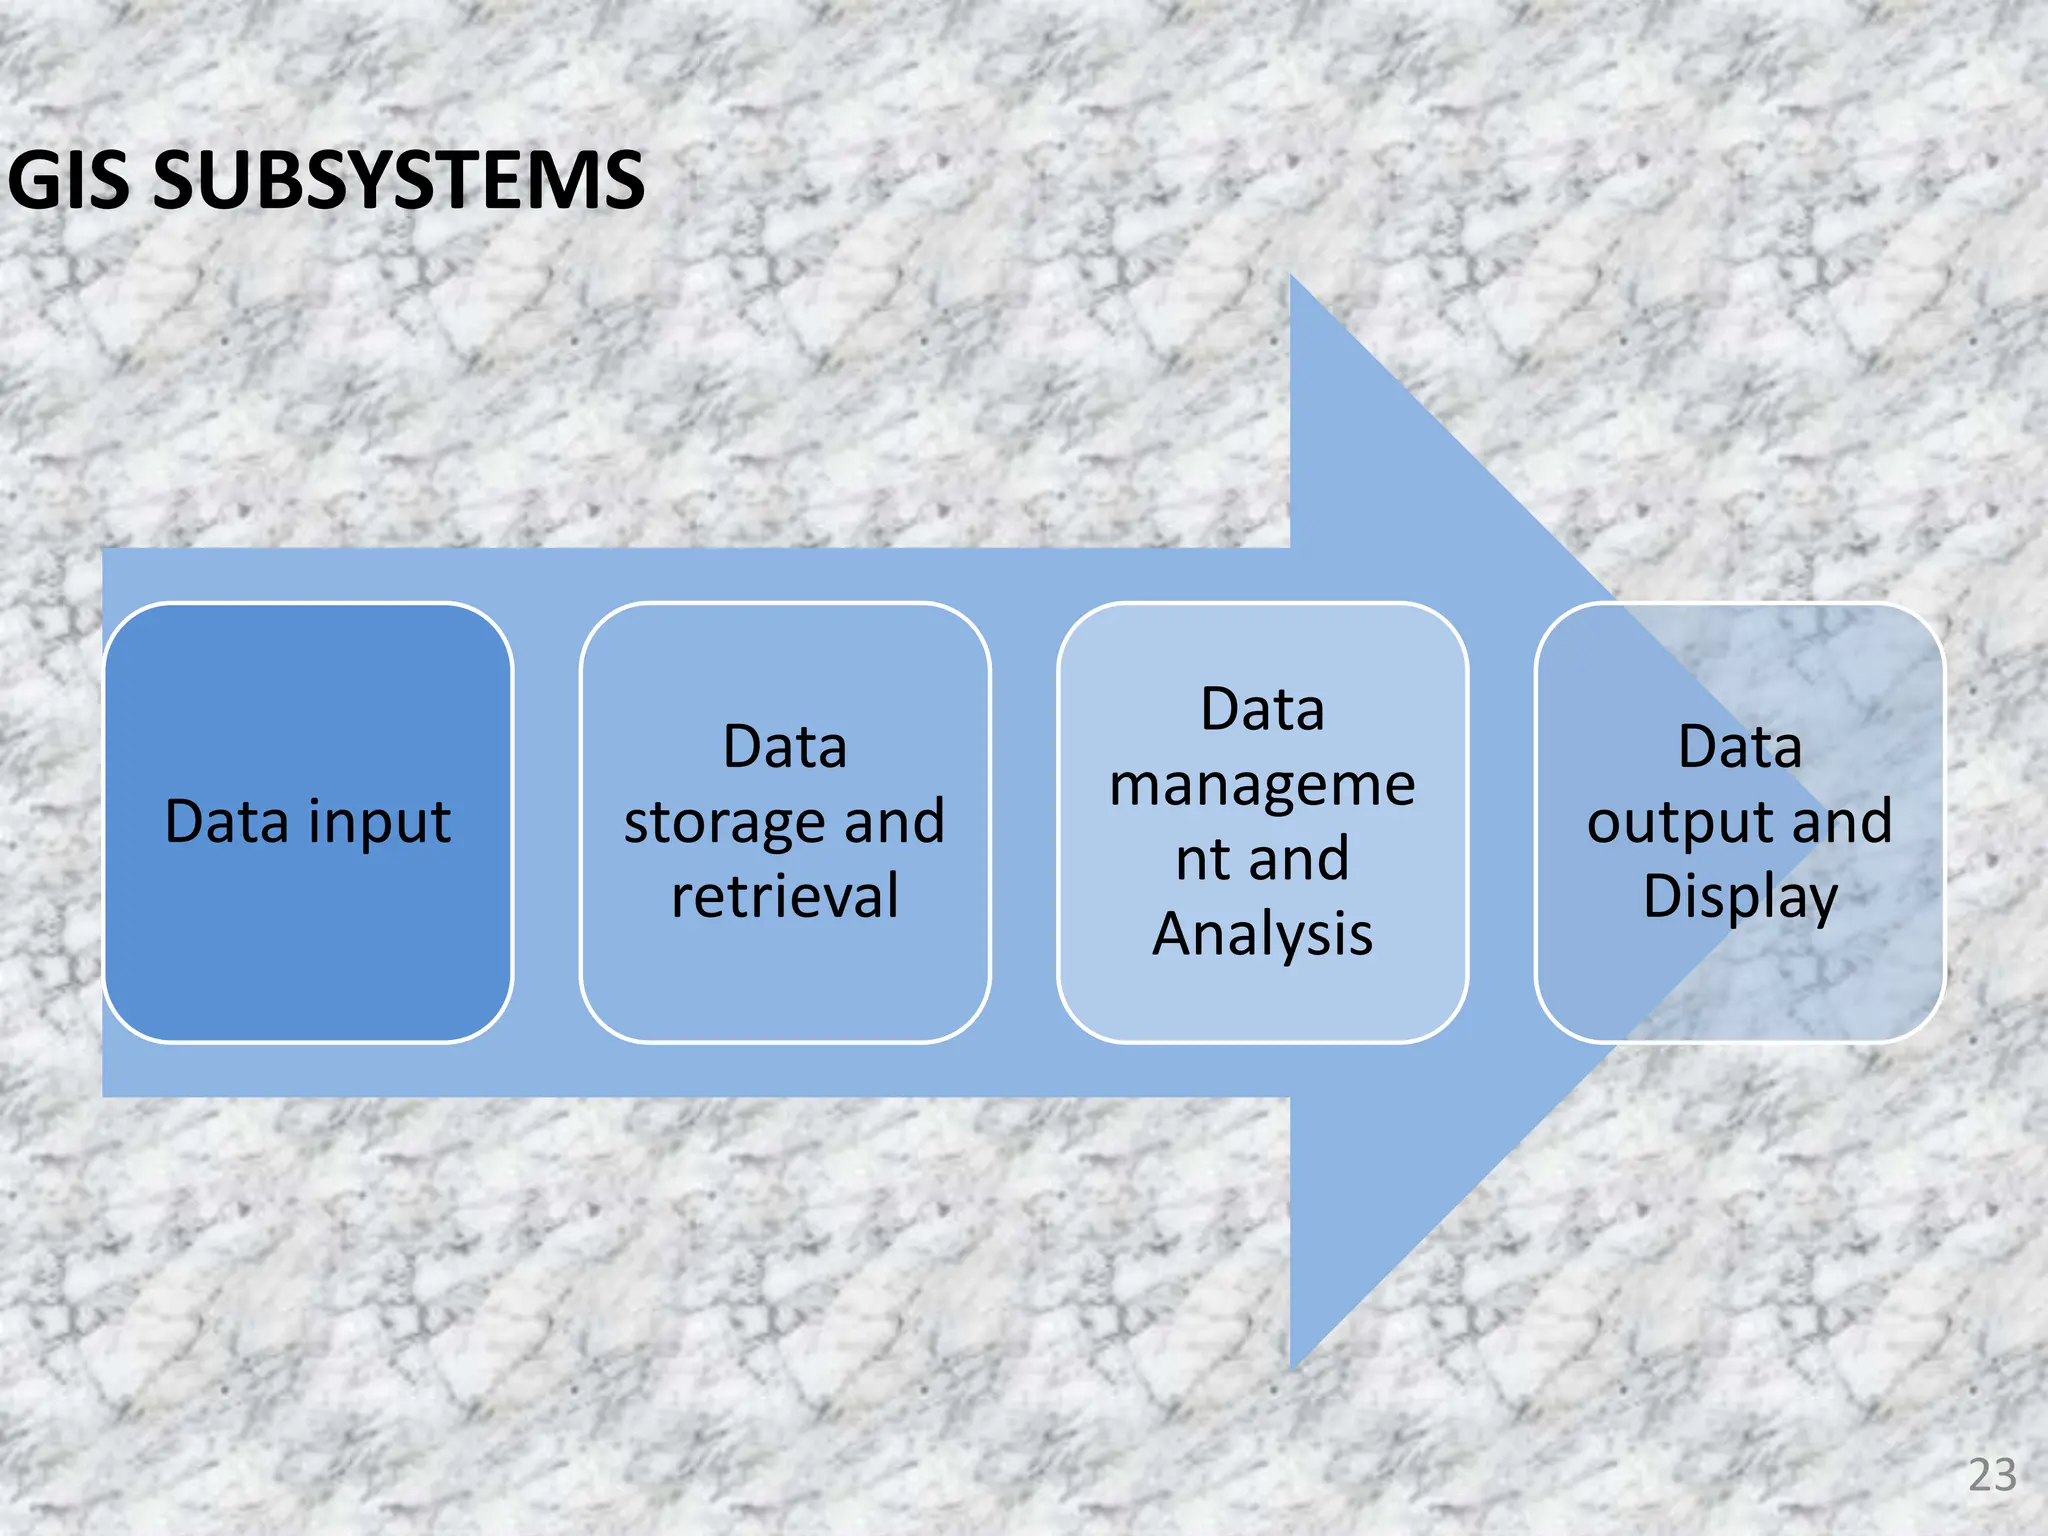
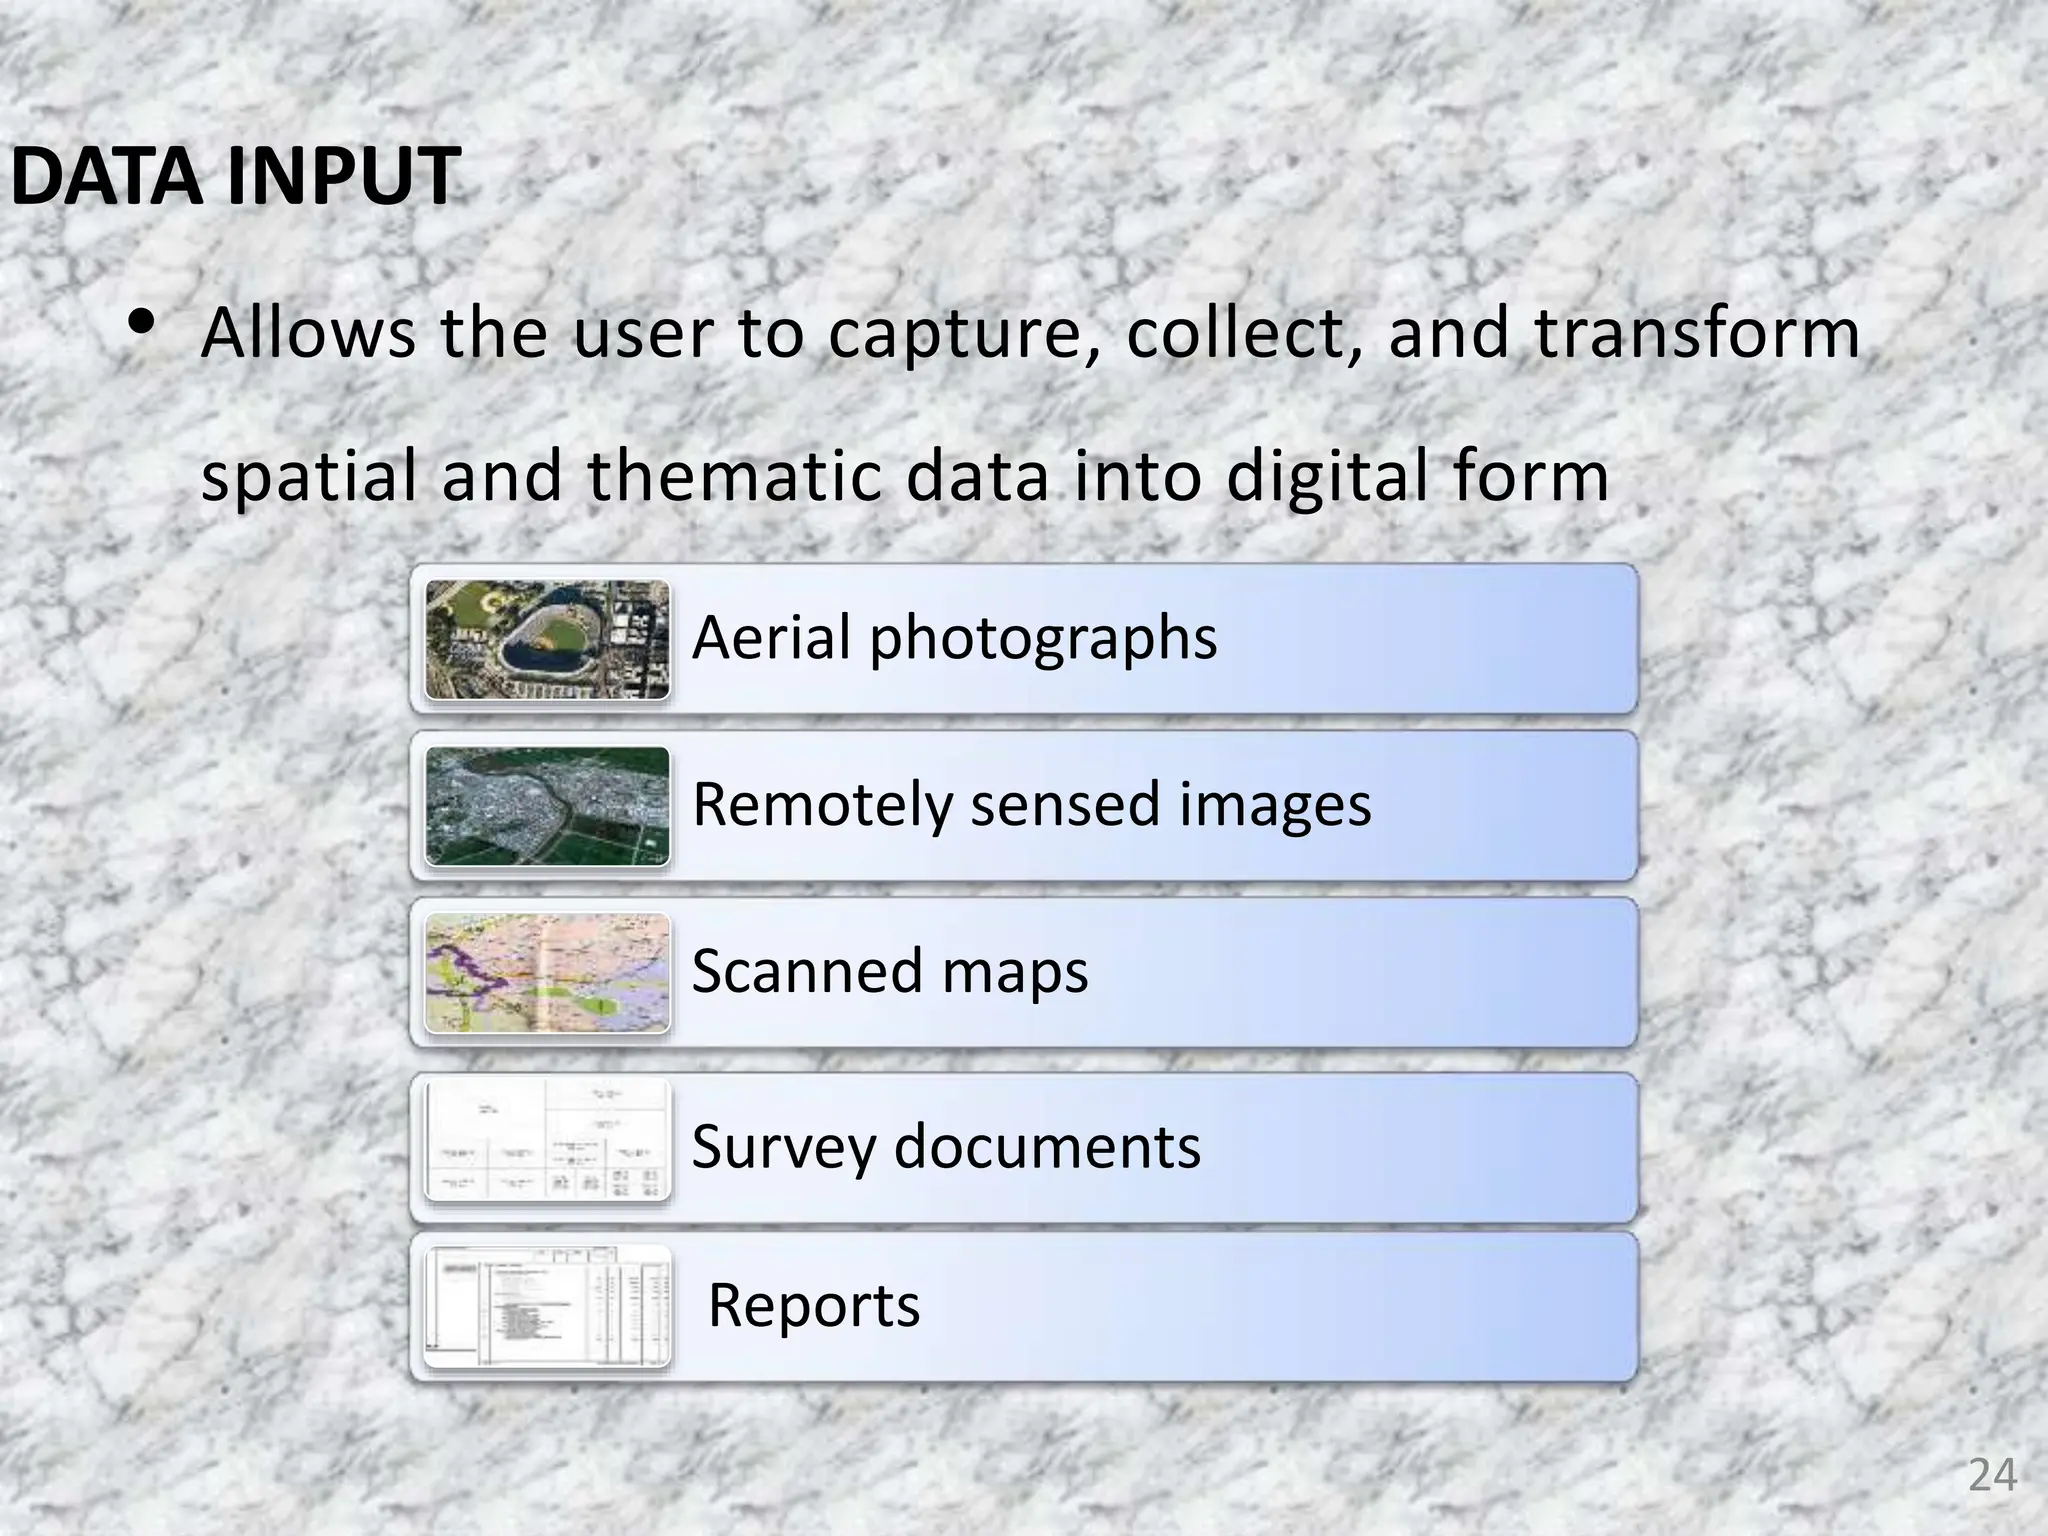
The document provides an overview of Geographic Information Systems (GIS), explaining key concepts, applications, and components. It discusses how GIS enables the storage, analysis, and visualization of geographic data, as well as the differences between GIS and other information systems. Additionally, it covers data models, thematic maps, data quality, and the importance of metadata in GIS environments.
![GIS stands for [ ] [ ] [ ]
A GIS stores geographic information in a [ ] and displays it on a map.
GIS maps are [ ].
A GIS stores two type of geographic information: features and [ ]
The functions of GIS are [ ], geo-data [ ] and
Geographic[ ].
People use the information from a GIS to make decisions and [ ]
Problems.
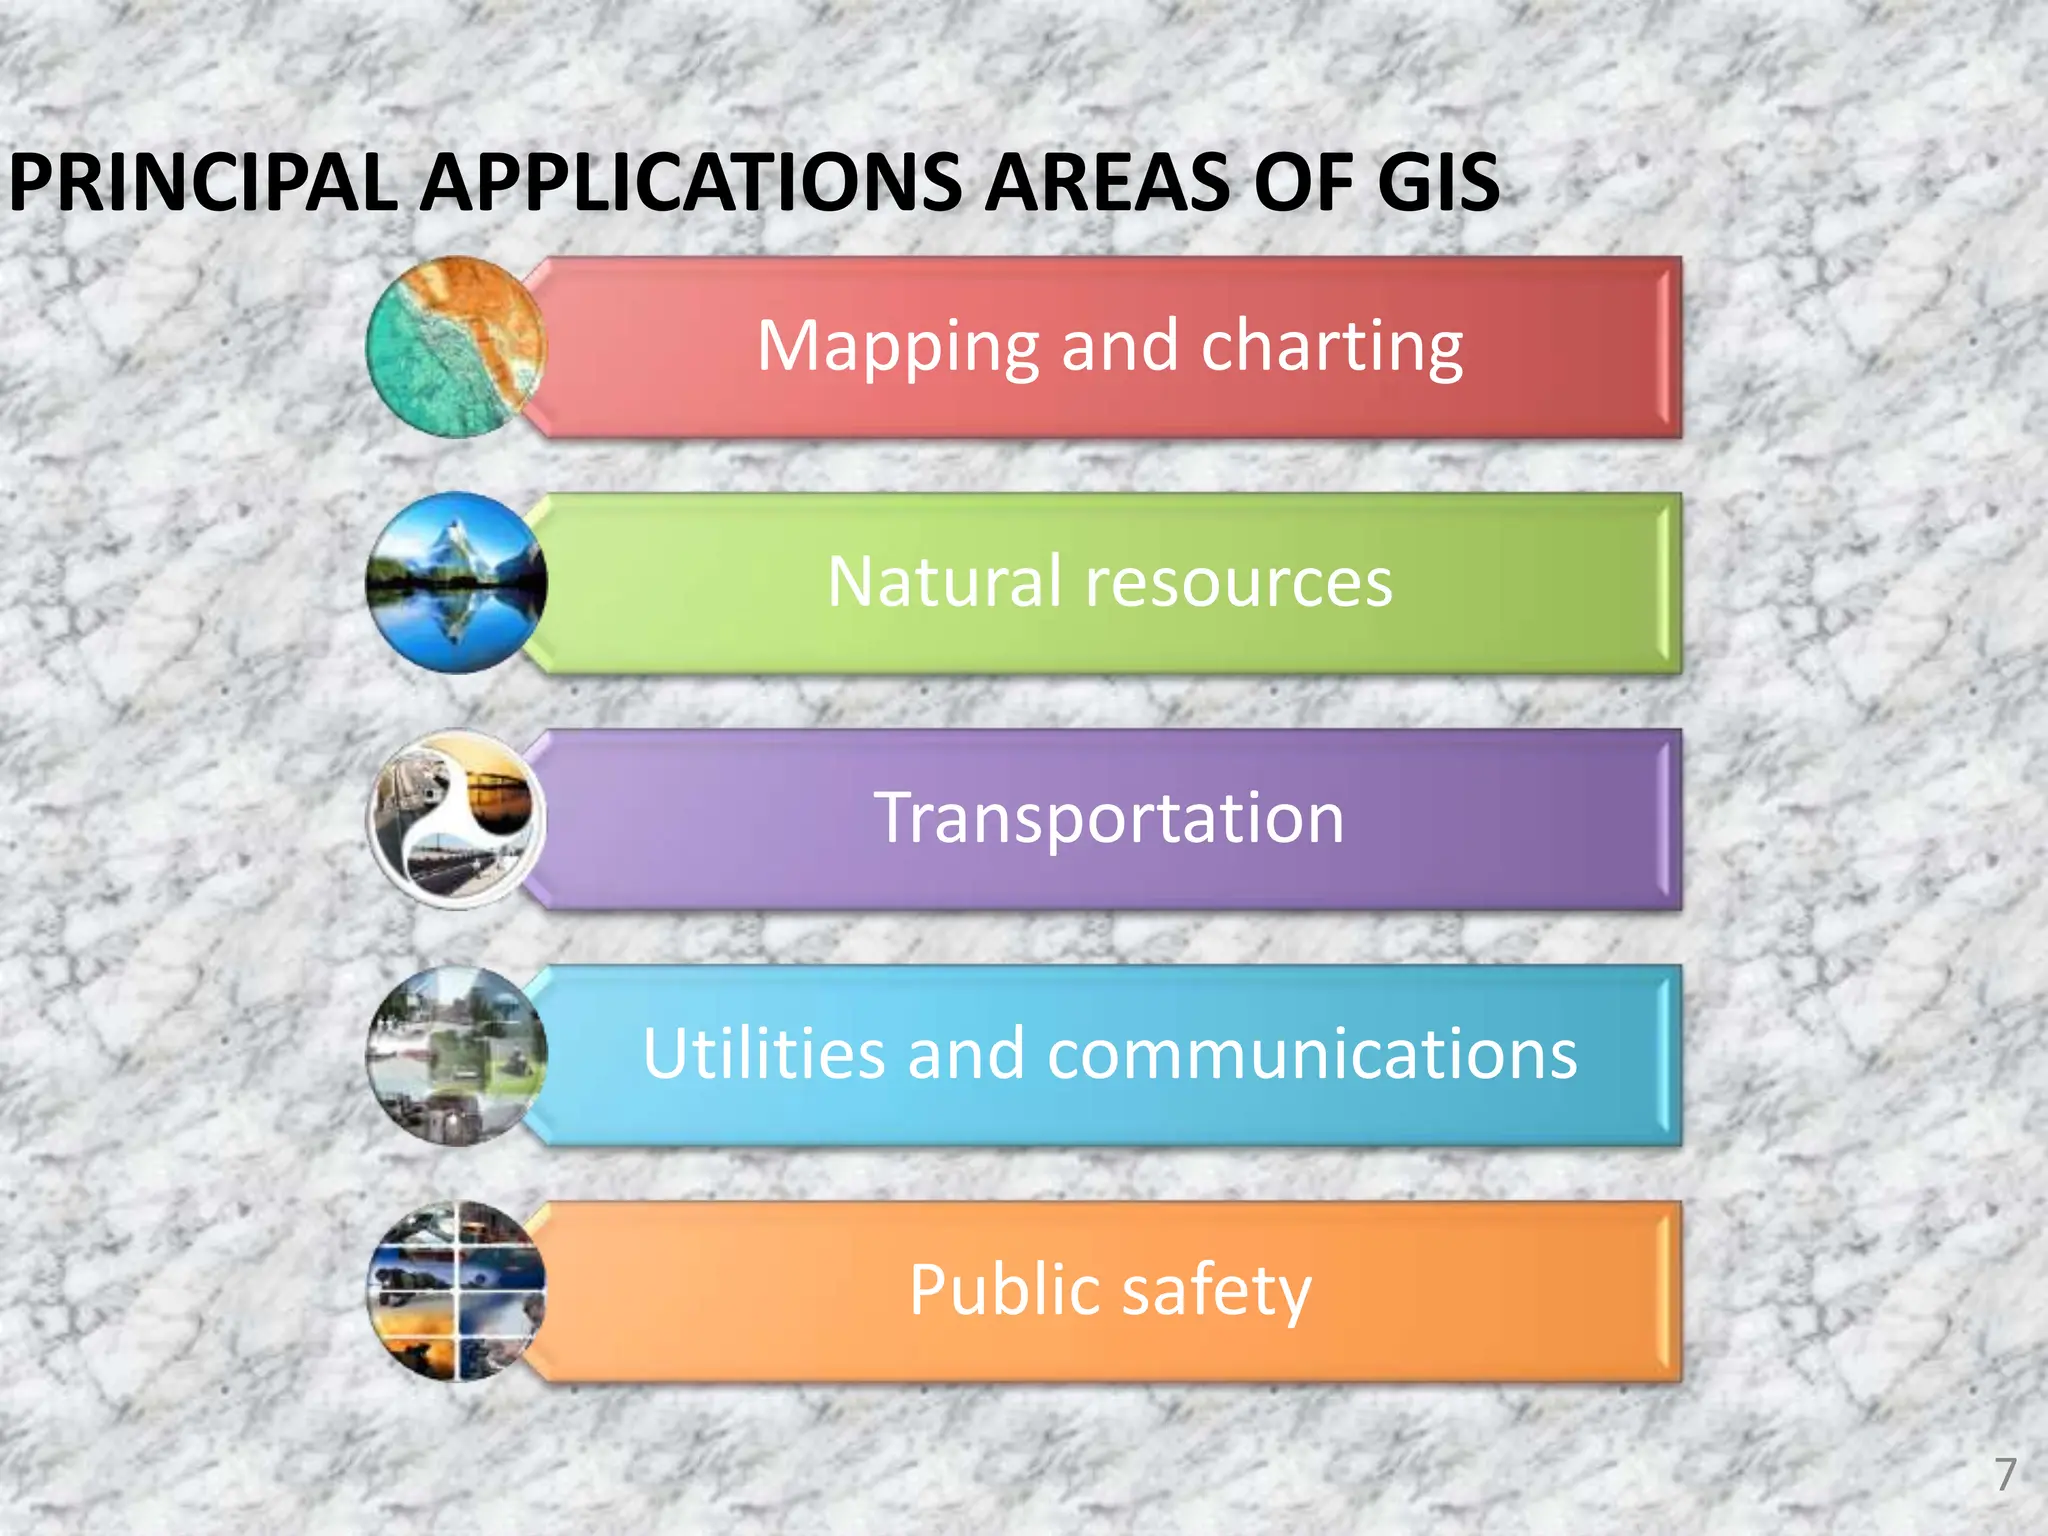
6
WHAT IS THE
DEFINITION OF GIS?
analysis
attributes
database
dynamic
geographic
information
management
solve
system
visualization
geographic information system
database
dynamic
attributes
solve
visualization management
analysis
*Source ESRI](https://image.slidesharecdn.com/gisconcepts-240510174121-1a48ea65/75/GIS-CONCEPTS-ASSORTED-CONSPECTS-pptx-6-2048.jpg)
![GIS
loss of
biodiversity
climate
change
pollution
over
population
limited
resources
political
conflicts
11
A GEOGRAPHIC APPROACH [1]
There are many problems that challenge our world and its future
To combat these problems we need understanding
knowledge, and integrated approaches](https://image.slidesharecdn.com/gisconcepts-240510174121-1a48ea65/75/GIS-CONCEPTS-ASSORTED-CONSPECTS-pptx-11-2048.jpg)
![By combining the science of geography with the
technology of GIS, we can
• Collect and organize the data for better understanding
of the Earth.
• Analyze data to create geographic knowledge.
• Apply geographic knowledge to find solutions we call
this as “a geographic approach”
12
A GEOGRAPHIC APPROACH [2]](https://image.slidesharecdn.com/gisconcepts-240510174121-1a48ea65/75/GIS-CONCEPTS-ASSORTED-CONSPECTS-pptx-12-2048.jpg)
![Today a wide variety of disciplines and Organizations
use geographic approach to
• Automate workflows
• Organize key information
• Use recourse wisely
• Make and support decisions
13
A GEOGRAPHIC APPROACH [3]](https://image.slidesharecdn.com/gisconcepts-240510174121-1a48ea65/75/GIS-CONCEPTS-ASSORTED-CONSPECTS-pptx-13-2048.jpg)
![14
A GIS has 3 primary functions
FUNCTIONS OF GIS [1]
Visualization Looking at different views of your
geographic data. Visualization
allows you to gain information and
see relationships.
Geo data management Organizing and updating geographic data
to make it useful.
Analysis Applying GIS tools to geographic data to
answer questions and make decisions.](https://image.slidesharecdn.com/gisconcepts-240510174121-1a48ea65/75/GIS-CONCEPTS-ASSORTED-CONSPECTS-pptx-14-2048.jpg)
![• Suppose you own several book shops and you want to expand
in the same city. Where are potential areas for a new shop?
• First map existing book shop locations, demographic data, city
zoning data
15
FUNCTIONS OF GIS [2]
Existing book shop locations Demographic data City zoning](https://image.slidesharecdn.com/gisconcepts-240510174121-1a48ea65/75/GIS-CONCEPTS-ASSORTED-CONSPECTS-pptx-15-2048.jpg)
![Then use GIS tools to combine the data and find areas
that meet your criteria
16
FUNCTIONS OF GIS [3]
Map showing potential areas for new book stores
Potential areas for
a new book store](https://image.slidesharecdn.com/gisconcepts-240510174121-1a48ea65/75/GIS-CONCEPTS-ASSORTED-CONSPECTS-pptx-16-2048.jpg)
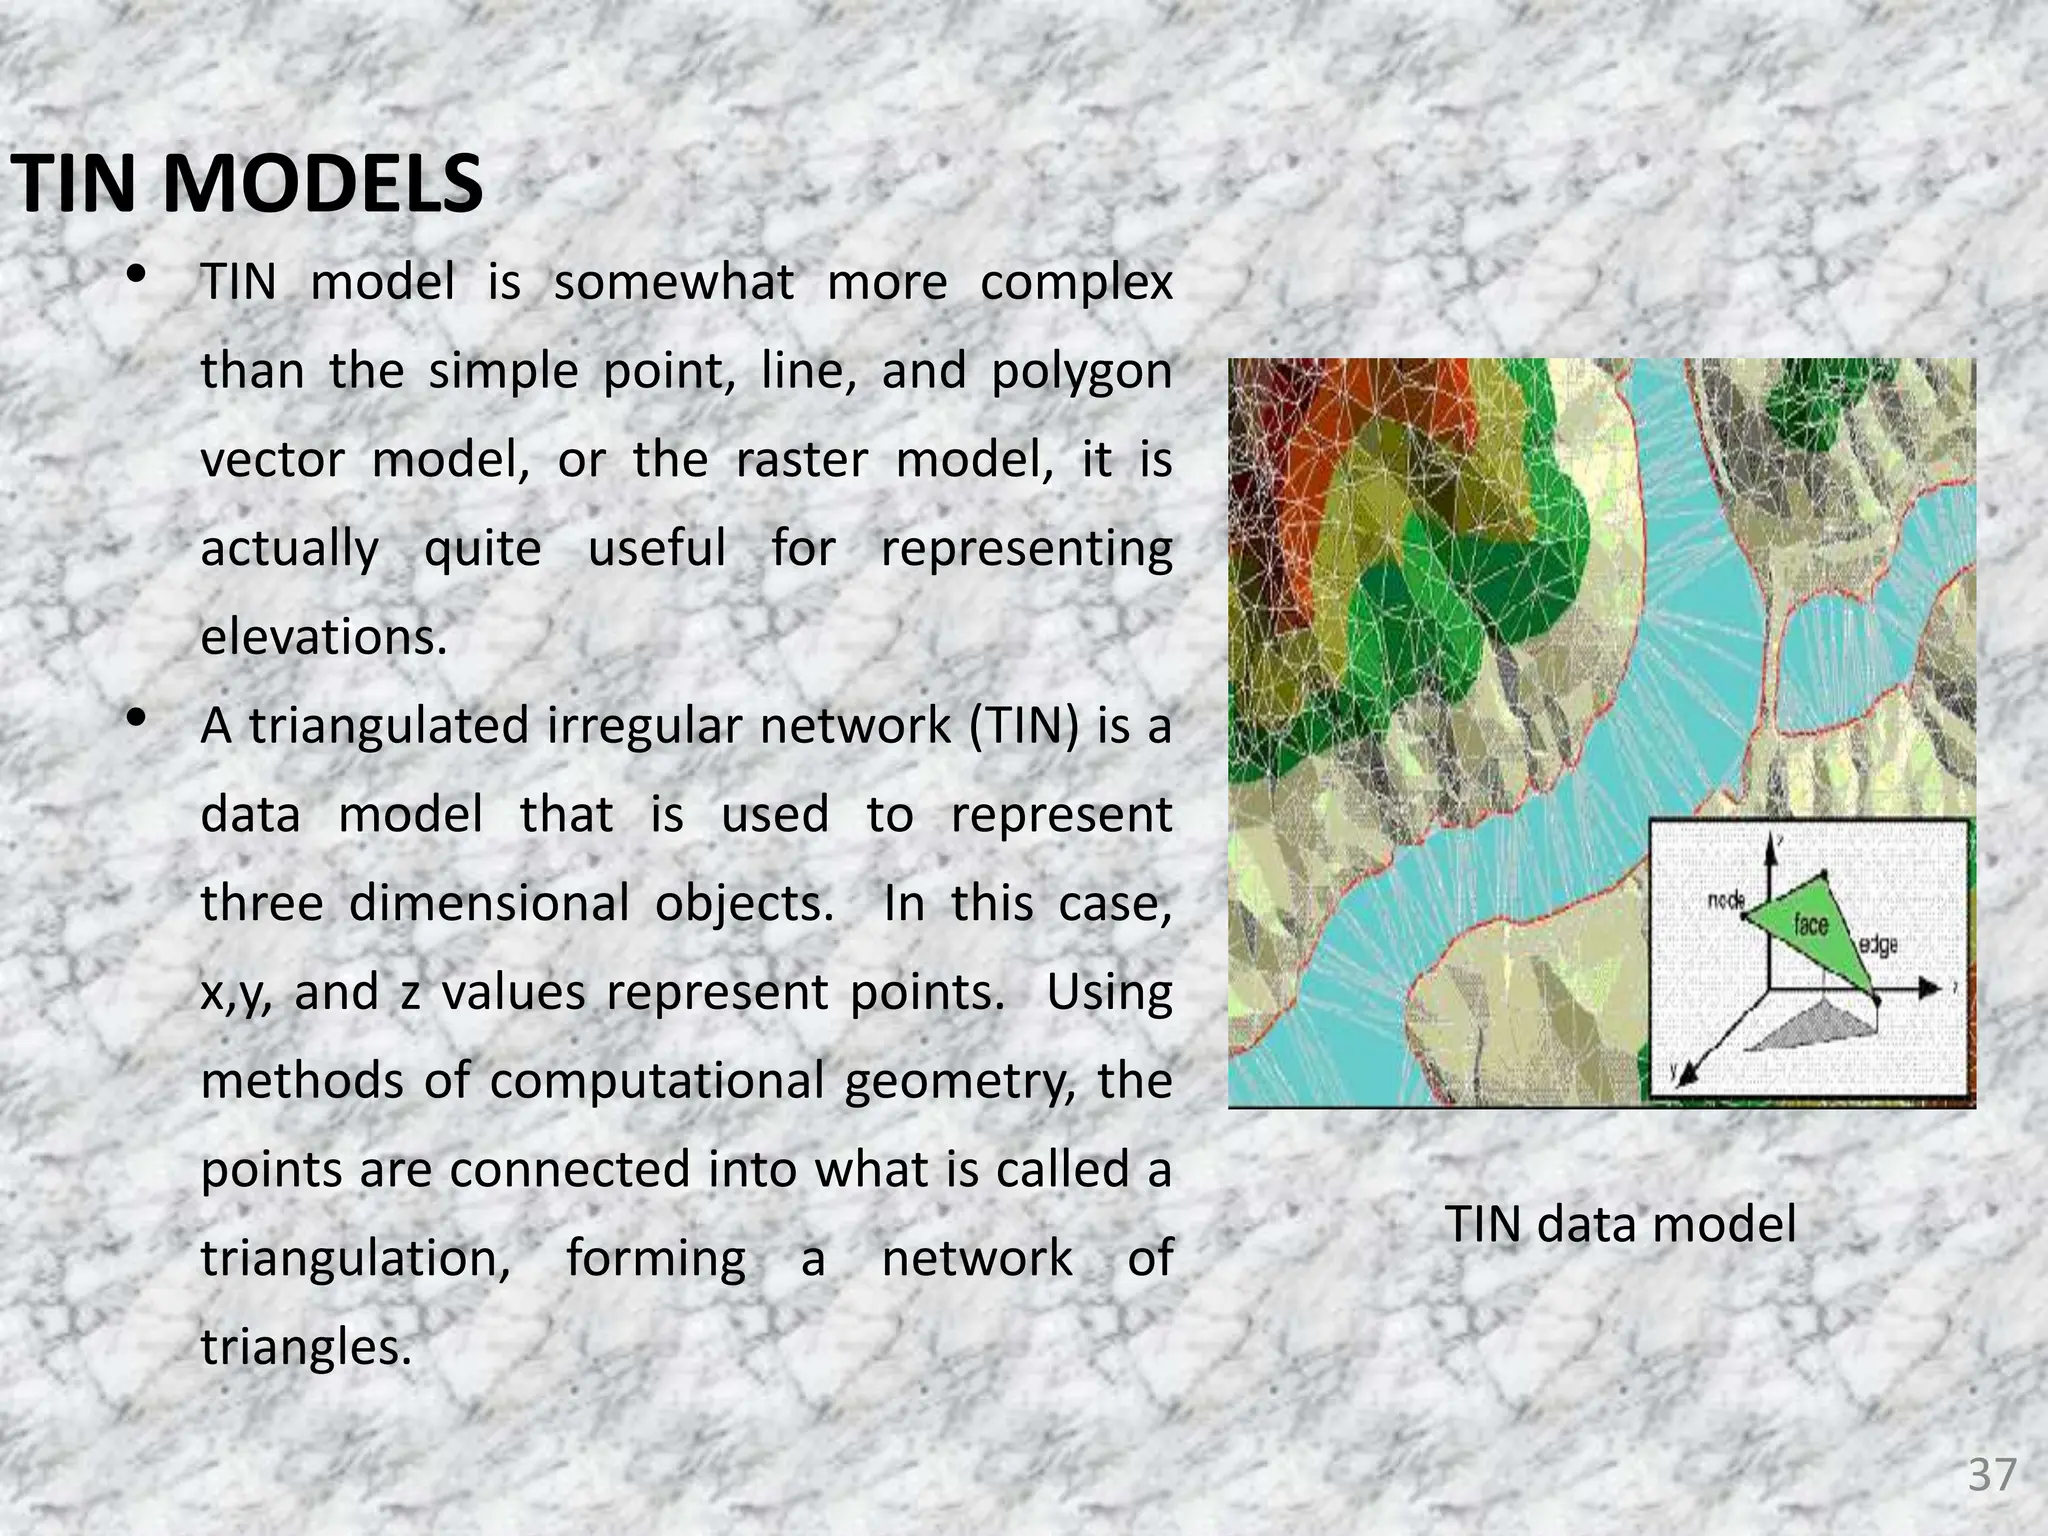
![All spatial data models are approaches for storing the spatial
location of geographic features in a data base. Three basic
types of spatial data models have evolved for storing
geographic data digitally.
• Vector
• Raster
• TIN
30
DATA MODELS [1]](https://image.slidesharecdn.com/gisconcepts-240510174121-1a48ea65/75/GIS-CONCEPTS-ASSORTED-CONSPECTS-pptx-30-2048.jpg)
![Vector Representation
X-AXIS
500
400
300
200
100
600
500
400
300
200
100
Y-AXIS
River
House
600
Trees
Trees
B
B
B B
B
B
B
B G
G
BK
B
B
B
G
G
G G
G
Raster Representation
1 2 3 4 5 6 7 8 9 10
1
2
3
4
5
6
7
8
9
10
Real World
G
G
DATA MODELS [2]
31](https://image.slidesharecdn.com/gisconcepts-240510174121-1a48ea65/75/GIS-CONCEPTS-ASSORTED-CONSPECTS-pptx-31-2048.jpg)
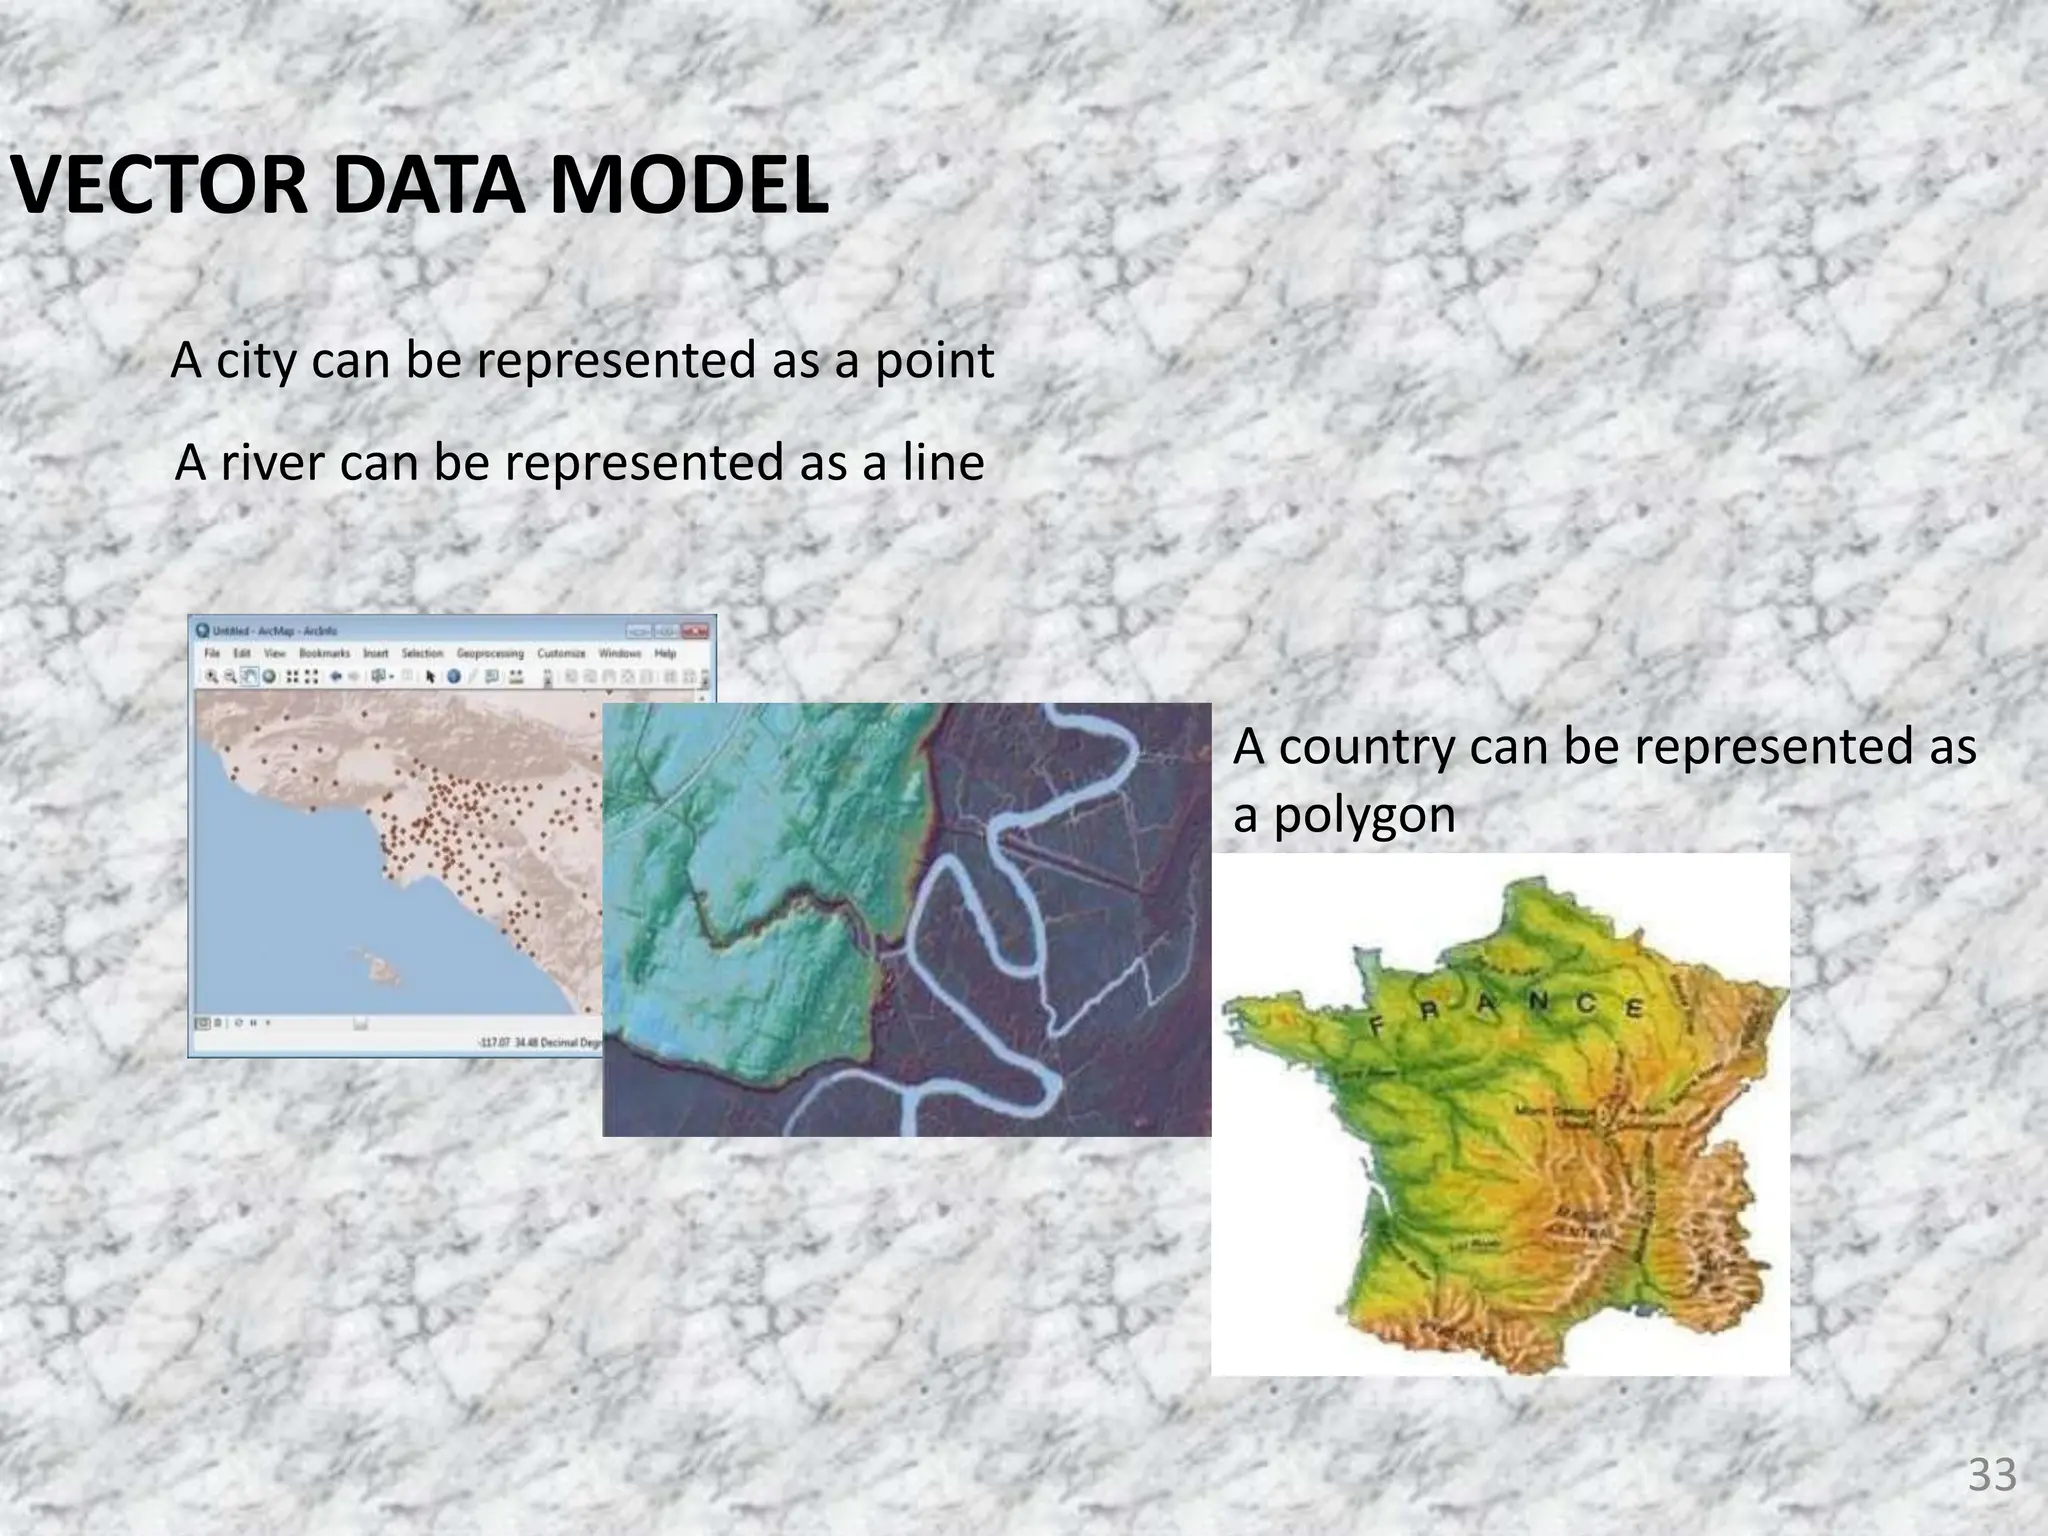
![• Vector data model:
Vector data model
represents geographic
objects with the basic
elements points, lines
and areas, also called
polygons.
32
Point
line
Polygon
DATA MODELS [3]](https://image.slidesharecdn.com/gisconcepts-240510174121-1a48ea65/75/GIS-CONCEPTS-ASSORTED-CONSPECTS-pptx-32-2048.jpg)
![• Raster datasets represent
geographic features by
dividing the world into
discrete square or
rectangular cells laid out in a
grid. Each cell has a value
that is used to represent
some characteristic of that
location.
• Raster data includes images
and grids.
34
RASTER DATA MODEL[1]](https://image.slidesharecdn.com/gisconcepts-240510174121-1a48ea65/75/GIS-CONCEPTS-ASSORTED-CONSPECTS-pptx-34-2048.jpg)
![• Grids represent derived data and are often used for analysis
and modeling.
• Grids can store continuous values, such as for an elevation
• They can also store categories, such as for a grid of
vegetation types.
35
RASTER DATA MODEL[2]](https://image.slidesharecdn.com/gisconcepts-240510174121-1a48ea65/75/GIS-CONCEPTS-ASSORTED-CONSPECTS-pptx-35-2048.jpg)
![• On a GIS map, there's more to a feature than its location and
shape. There's all the information associated with that
feature.
• For a road, this might include its name, speed limit, and
whether it's one-way or two-way.
• For a city, this might include its population, demographic
characteristics, number of schools, and average monthly
temperatures.
38
GIS MAPS-ATTRIBUTES [1]](https://image.slidesharecdn.com/gisconcepts-240510174121-1a48ea65/75/GIS-CONCEPTS-ASSORTED-CONSPECTS-pptx-38-2048.jpg)
![• A particular type, or category, of
information associated with a feature
in a GIS is called an attribute.
• For example, population can be an
attribute of a city, country, continent,
and other features. Feature attributes
are stored in an attribute table.
39
GIS MAPS-ATTRIBUTES [2]](https://image.slidesharecdn.com/gisconcepts-240510174121-1a48ea65/75/GIS-CONCEPTS-ASSORTED-CONSPECTS-pptx-39-2048.jpg)
![• A feature on a GIS map is linked to
its record in the attribute table by a
unique numerical identifier (ID)
• Because features on the map are
linked to their records in the table,
you can click a feature on the map
and see the attributes stored for it in
the table. When you select a record
in the table, the linked feature on
the map is automatically selected as
well
40
GIS MAPS-ATTRIBUTES [3]](https://image.slidesharecdn.com/gisconcepts-240510174121-1a48ea65/75/GIS-CONCEPTS-ASSORTED-CONSPECTS-pptx-40-2048.jpg)