Downloaded 159 times


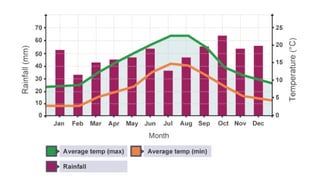

The document discusses various types of graphs used in geography, including line graphs, pie charts, bar charts, and climate graphs, detailing their construction and applications. It explains how these graphs can represent different data sets, allowing for comparisons and trends to be visualized. Additionally, it emphasizes the importance of understanding climate patterns based on the information presented in climate graphs.


