Download to read offline

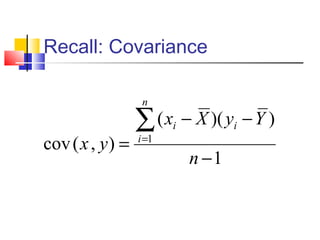
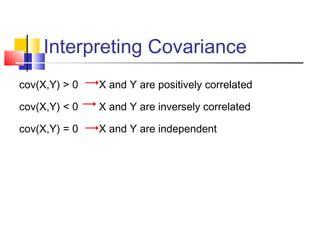
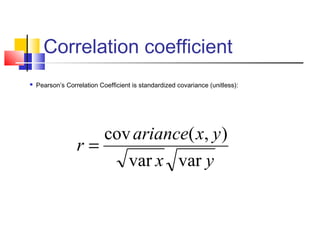
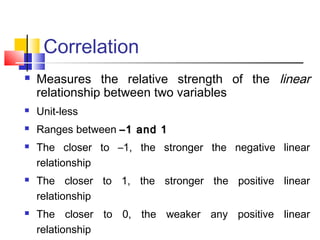
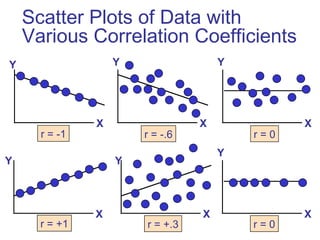
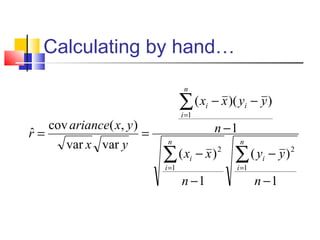
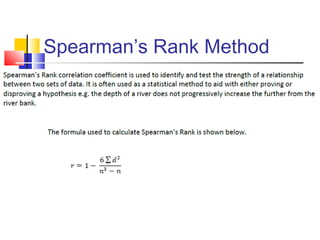
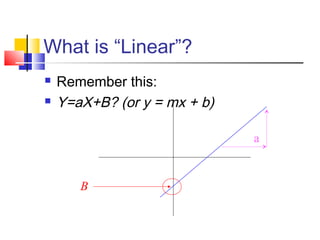
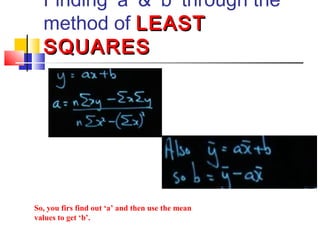
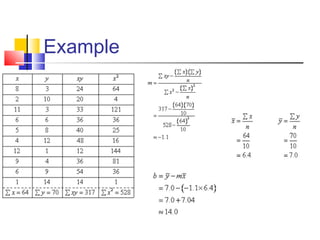
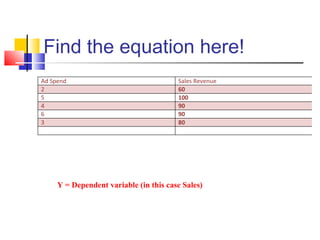
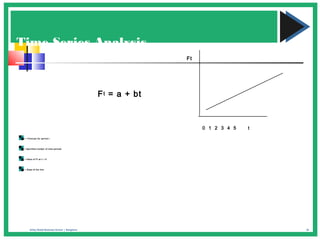
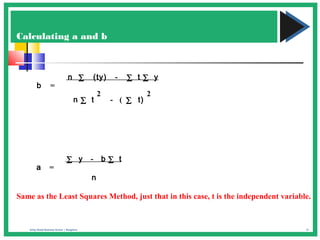
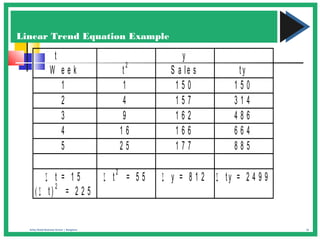
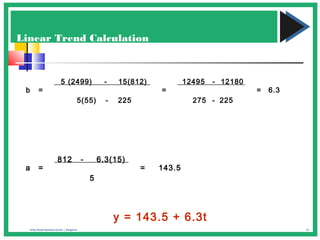

The document discusses various forecasting techniques including covariance, correlation coefficients, scatter plots, and linear regression. It defines covariance and correlation, and how they measure the strength and direction of relationships between variables. Linear regression finds the linear trend line that best fits the data using the method of least squares to calculate the slope (a) and y-intercept (b) values. Time series analysis can also use linear regression to model a linear trend over time and make forecasts by extending the trend line into the future.


![7.__Developing_a_Research_Proposal[1].pptx](https://cdn.slidesharecdn.com/ss_thumbnails/7-260131073037-df92dd7d-thumbnail.jpg?width=640&height=640&fit=bounds)


![제 23회 보아즈(BOAZ) 빅데이터 컨퍼런스 - [MBOAX] : ABSA를 활용한 소비자 반응 분석 기반 운영 효율화 대시보드 설계](https://cdn.slidesharecdn.com/ss_thumbnails/3-1boaz23rdconferencemboax-260203102709-9d519923-thumbnail.jpg?width=640&height=640&fit=bounds)


