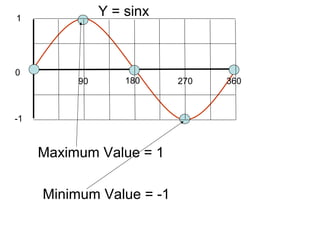
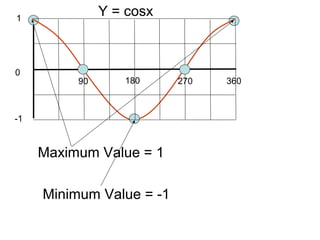
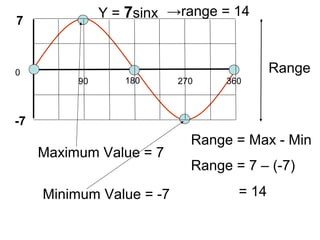
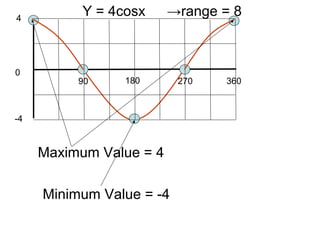
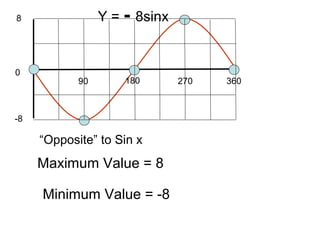
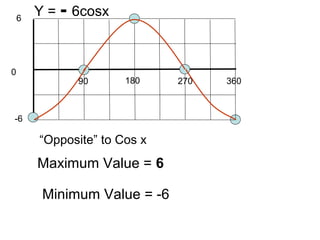
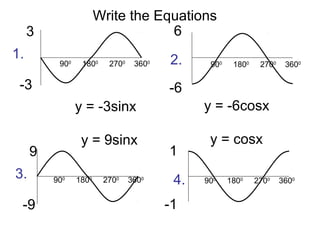
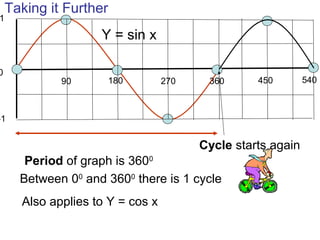
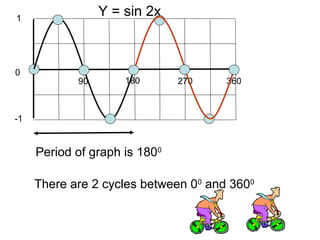
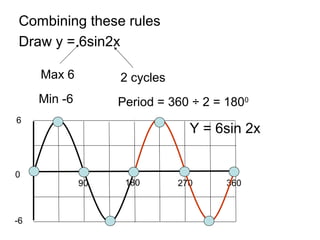
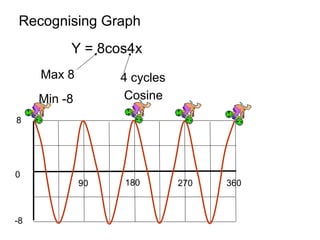
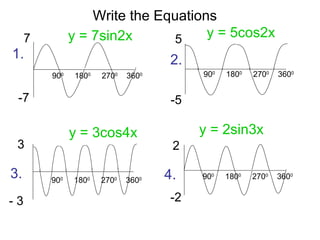
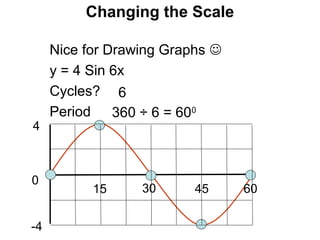
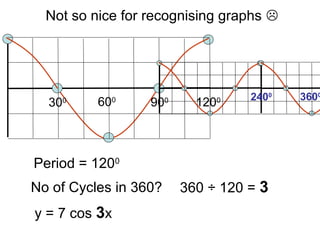
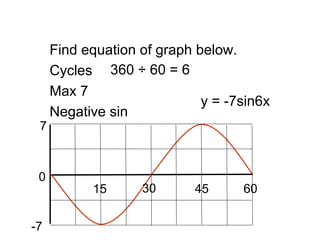
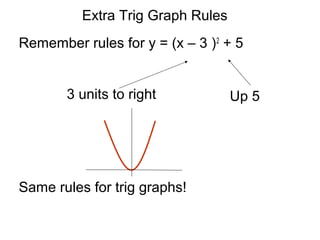
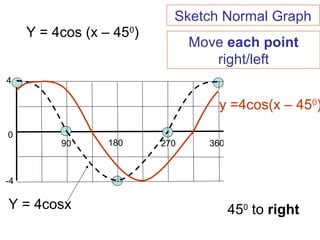
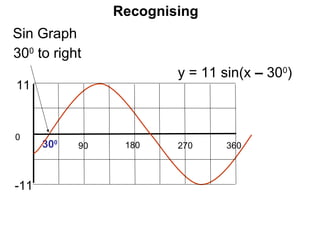
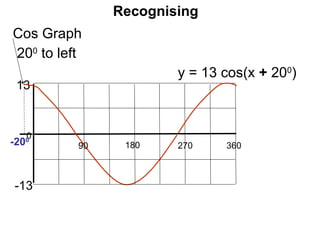
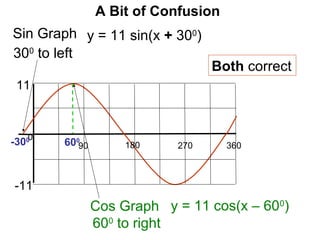
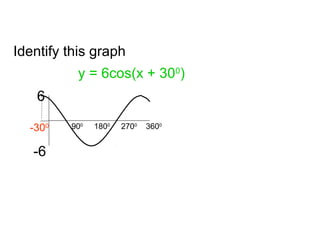
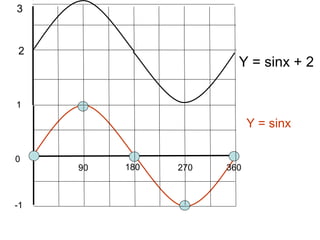
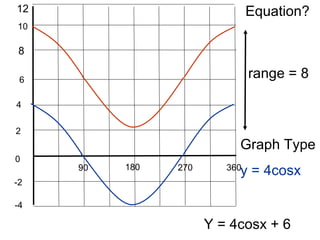
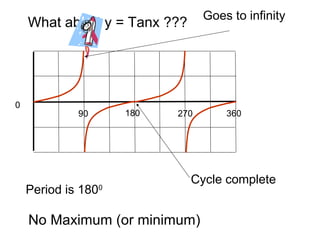
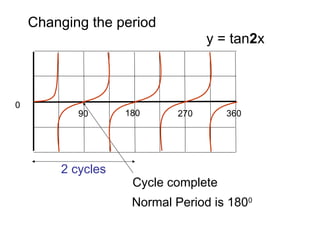
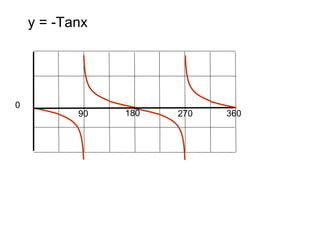
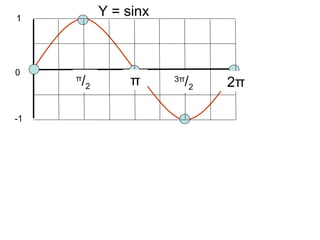
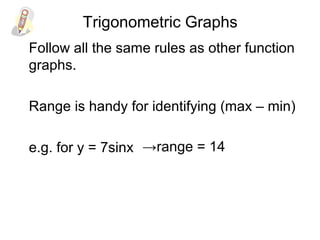
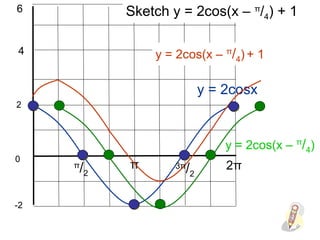
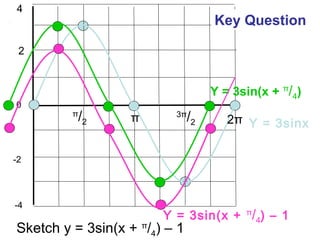
This document provides a review of trigonometric graphs including how to draw and identify them. It discusses the maximum and minimum values, range, period and number of cycles for sin and cos graphs. It also covers shifting graphs horizontally or vertically and combining trig functions with constants. Examples are provided to illustrate identifying trig graphs from their equations and sketching shifted or combined trig graphs.